Ferroelectric phase transition, ionicity condensation, and multicriticality in charge transfer organic complexes
Abstract
To elucidate a novel pressure-temperature phase diagram of the quasi-one-dimensional mixed-stack charge-transfer (CT) complex TTF-CA, we study the quasi-one-dimensional spin-1 Blume-Emery-Griffith (BEG) model. In addition to the local charge transfer energy and the inter-stack polar (dipole-dipole) interaction, we take account of the inter-stack electrostriction effect. Using the self-consistent chain-mean-field theory, where the intra-stack degrees of freedom are exactly treated by the transfer-matrix method, we reproduce the gas-liquid-solid like phase diagram corresponding to the neutral (N), paraelectric ionic (Ipara), and ferroelectric ionic (Iferro) phases, respectively. We also give an explanation on the experimentally observed multicritical behavior and concomitant discontinuous inter-stack lattice contraction in TTF-CA.
I Introductoin
In the “critical phase control technology,”condensed molecular materials play quite a promising role, because molecular orbitals and stacking architecture are manipulable in a desirable way. To elucidate interrelation of constituent molecular structures and emergence of various thermodynamic phases such as superconductivity, magnetism, and ferroelectricity is of great interest there. A neutral-to-ionic phase transition (NIT) in quasi-one-dimensional charge-transfer (CT) complexes comprising mixed-stack architecture of electron donor (D) and accepter (A) moleculesTorrance81a has played a key role in this field.
In particular, phase control by pressureCailleau97 ; Luty02 or laser radiationKoshihara90 ; Luty02 in the tetrathiafulvalene--chloranil (TTF-CA), that exhibits the NIT around 80K at ambient pressure, has attracted a great deal of interest. Very recently, Collet at al.,Collet03 using highly refined time-resolved X- ray diffraction technique, have reported direct observation of a photo-induced paraelectric-to-ferroelectric structural order in the crystal. In the ionic phase, the D+A- pair forms a dimer due to the electrostatic instabilityIizuka-Sakano-Toyozawa95 or subsequent spin-Peierls instability.Nagaosa88 The ionized dimer on the DA chain carries a local electric dipole moment with opposite directions depending on the dimerization patterns D+A- or A-D+. Once acquires a macroscopic mean value , a spontaneous inversion symmetry breaking (SISB) occurs and the system undergoes a phase transition to a ferroelectric-ionic (Iferro) phase. The ionic phase itself is simply described by ionicity condensation . Since is a symmetry-breaking order parameter but is not, we expect that and play separate roles. The appearance of two distinct order parameters and is a direct consequence of the degeneracy of the two configurations of dimerization pattern, IA ( D+A-D+A- ) and ( A-D+A-D+ ).
Recently, the respective roles of and have been highlighted in both equilibriumCailleau97 and nonequilibriumLuty02 processes. Using the neutron diffraction along with nuclear-quadrupole-resonance (NQR) measurements, Lemée-Cailleau et al.Cailleau97 found a novel phase where the system is ionic but dipoles remain disordered, i.e., a paraelectric ionic (Ipara) phase. They proposed a pressure-temperature phase diagram of TTF-CA, where the N, Ipara, and Iferro phases are like gas, liquid, and solid phases, respectively. The ferroelectric order is well signaled by the appearance of Bragg peaks that indicate the inversion symmetry breaking. The “sublimation” line separating the N and Iferro phases continues up to a triple point . Above the triple point, in addition to the “crystallization (or melting)” line, there appears a “condensation” line separating the Ipara and Iferro phases accompanied by a concomitant discontinuous change of , ending at a critical point . The purpose of this paper is to give a qualitative understanding of this phase diagram. This phase diagram, in addition to the phenomenological description offered in ref.Luty02 .
Since the SISB is prohibited by thermal fluctuations in a purely one-dimensional stack, inter-stack coupling is required to realize the SISB. In addition, the experimental observation strongly indicates that electronic and lattice degrees of freedom are coupled with each other in a unique manner. That is to say, upon crossing the transition lines in the gas-liquid-solid like phase diagram,Cailleau97 ; Luty02 the unit cell parameter (for the axis perpendicular to the stack) exhibits about 0.5 % discontinuous contraction at the condensation transition but exhibits continuous contraction at the crystallization transition. On the other hand, the unit cell parameter (for the stacking axis) exhibits only continuous contraction at the condensation transition and below it remains almost constant.Luty02 Now we are ready to ask the question: (1) what kind of inter-stack interactions are responsible for the occurrence of the Iferro phase, and (2) how the lattice anomalies are coupled to the phase transitions ?
As for the first question, Luty et al. Luty02 ; Luty96Rev stressed that the inter-stack non-polar couplingNagaosa88 alone cannot drive the ferroelectric ordering and the dipolar coupling plays an essential role. As for the second question, Kawamoto et al.Kawamoto01 took account of the charge distribution on the atoms inside each molecule by an ab initio quantum chemical method and elucidated the importance of inter-stack Coulomb attraction eV, which may cause inter-stack electrostriction (Coulomb-lattice coupling).
II Quasi-one-dimensional Blume-Emery-Griffith model and interchain mean field theory
Now we shall set up a model. The ground-state energy of the mixed stacks has three minima as a function of the dimerization displacement, i.e., the N and the degenerate IA and IB states. The three states may be described by the spin-1 Ising variable on the th dimer inside the th stack.Cailleau97 ; Luty02 ; Luty96Rev The charge transfer energy (), the intra- (with subscript ) and inter- (with subscript ) stack dipolar () and non-polar () interactions, and the coupling with the electric field () are described by the quasi one-dimensoinal (Q1D) Blume-Emery-Griffith (BEG) model,BEG71 , where
| (1) | |||||
| (2) |
The intra-stack dipolar interaction is caused by coupling between the charge transfer and the lattice distortion,Luty96Rev while the inter-stack dipolar interaction is regarded as a direct interaction between the induced dipoles on adjacent stacks. The intra-stack couplings are much stronger than the inter-stack couplings, and the electric dipoles are aligned along the stacks. The energy cost to create one D+A- pair is given in the limit of no molecular overlap by where and denote the donor’s ionization energy and the accepter’s affinity, respectively, and denotes the Madelung energy.MacConnel65 Generally speaking, increasing pressure decreases the lattice spacing and consequently increases . Therefore, decreases upon applying pressure.
We treat the Hamiltonian (2) by using the self-consistent chain mean-field theorySIP75 . Introducing the thermal averages, and we have the effective 1D BEG model,
| (3) | |||||
where and with being the inter-stack coordination number. Treating exactly by the transfer matrix method, we obtain the free energy per site,
| (4) |
where is the maximum eigenvalue of the transfer matrix for , given by
| (8) |
with . Possible phase diagrams of the BEG model have been extensively studied through mean-field theories,BEG71 ; Hoston-Berker91 renormalization-group,Berker-Wortis76 and transfer-matrix methods.Albayrak-Keskin00 For the parameter regions relevant to the present case, , , , , and are all positive, so that a solid-liquid-gas type phase diagram with proper slopes of transition lines is not obtained.
III Interchain electrostriction
Then, we consider the inter-stack lattice degrees of freedom that have not explicitly been taken into account in (2). It is well known that an electrostriction effect potentially converts a continuous transition to a discontinuous one, since this gives rise to an additional negative free-energy term that contains the forth power of the relevant order parameter.BasicNotion In the present case, we phenemenologically introduce an additional free energy,
| (9) |
where the first and second terms represent Coulomb attraction between the nearest neighbor stacksKawamoto01 and the elastic energy for the distortion in the inter-stack direction. Note that has already been absorbed into . The lattice constant without distortion is , and denotes the distortion. By minimizing with respect to , we obtain the optimized lattice constant,
| (10) |
where is a small constant. We thus have the energy gain due to the lattice distortion,
| (11) |
Now, solving the self-consistent equations is reduced to searching that gives the absolute minimum of the total free energy, The ionic phase is characterized by the ionicity condensation , while the ferroelectric phase is characterized by .
Note that, in the present scheme, any phase with is regarded as “neutral” and that the neutral phase has always . In the BEG model, because of three states , approaches the universal constant in the high temperature limit, where the entropy term dominates the internal energy term. Therefore, in the parameter region where continuously increases upon decreasing temperature, we have . In the experiments,Torrance81a the ionicity continuously increases upon decreasing temperature and jumps from to at the NIT. Thus, concerning the quantitative magnitude of the ionicity, there arises a difference between the experimental result and the present analysis. This apparent difference comes from the fact that we mapped the intra-stack CT transfer and the DA dimerization onto the simple spin-1 Ising variables. Therefore, we should regard the difference as an artifact of the classical BEG model.
IV Numerical results and phase diagram
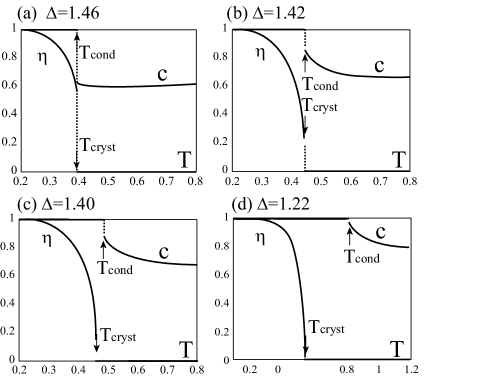
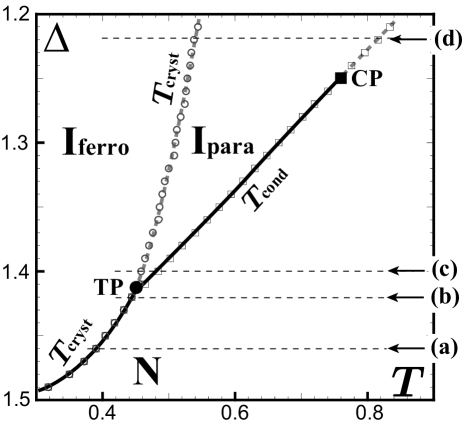
From now on, we set as an energy unit and the electric field is set to be zero. In Fig. 1, we show the temperature dependence of and for various magnitudes of with , , , and We introduce the condensation temperature and the crystallization temperature . The ionicity jumps into at , while the ferroelectric order parameter acquires a finite magnitude at . The ground state becomes ionic for . Both and exhibits a discontinuous change at the same transition temperature (the sublimation temperature) for . That is to say, . For , there appears a region, , where the system is ionic but still paraelectric. This region is identified with the phase that is observed in TTF-CA under pressure. The point is identified with the triple point (indicated by “TP” in Fig. 5). For , still exhibits a discontinuous change at , but continuosly evolves at , as shown in Fig. 1(c). The discontinuity jump of becomes smaller and seems to vanish, as decreases, as shown in Fig. 1(d). We stress that this discontinuity is a direct consequence of the weak but finite electrostriction effect. Without the electrostriction, as decreases, and continue to coincide with each other, and the transition simply changes from discontinuous to continuous at some critical value of .BEG71 ; Hoston-Berker91 ; Berker-Wortis76 ; Albayrak-Keskin00
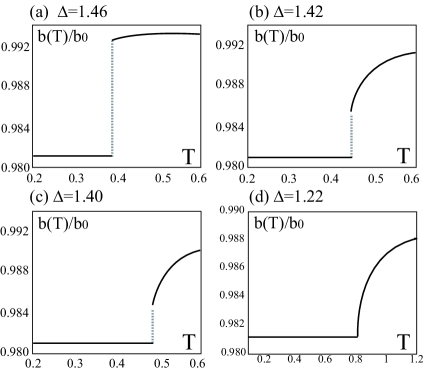
As clearly seen from (10), about 0.5% discontinuous contraction of the inter-stack lattice constant (unit cell parameter ) is accompanied by the discontinuous jump of the ionicity. In Fig. 2, setting as a length unit, we show the temperature dependence of the unit cell parameter given by (10), using the same parameter set as that in Fig. 1. Although the magnitude of the discontinuous contraction depends on the parameter choice of and , the qualitative nature ( jumps at ) does not change.
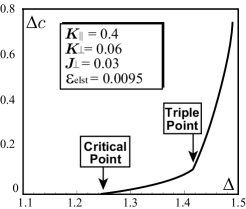
To see the discontinuity of the ionicity more closely, we show in Fig. 3 the dependence of the discontinuity at the condensation temperature, . It is clearly seen that decreases as decreases and eventually reaches zero at . For , the condensation occurs without ionicity jump. Then, the lattice contraction at also becomes continuous. Therefore, with the corresponding is idendentified with a critical point (indicated by “CP” in Fig. 5). This result is well consistent with the experimental fact that the ionicity jump finishes at the critical point.Cailleau97
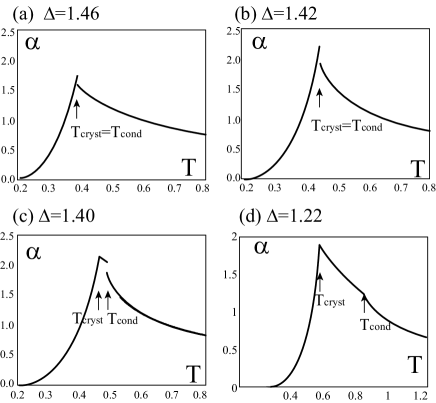
The dielectric constant is given by , where the uniform polarizability is In Fig. 4, we show the temperature dependence of for various magnitudes of . It is seen that along the N-Iferro boundary, the polarizability exhibits a sharp single cusp at . For , a discontinuous jump occcurs at and a cusp at . The discontinuity at finishes at .
In Fig. 5, we show the phase diagram of the system for , , , and Regarding the decreasing as increasing pressure, this phase diagram is consistent with the experimentally found, pressure-temperature phase diagram of TTF-CA.Cailleau97 The tiriple point, the critical point, and the observed inter-stack lattice contraction are reproduced. For simplicity, we here ignored the change of due to thermal lattice contraction. Exactly speaking, to convert our - phase diagram to a - diagram, we need to take account of the temperature dependence of , . By appropriately treating , we may obtain the corresponding phase diagram satisfying the Clausius-Clapeyron relation. We stress that, even when we take this simple view, a qualitative nature of the phase diagram is not changed. Identifying the triple point with the experimentally obtained one , we see that our parameter choice here corresponds to K and K.
Lajzerowicz and SivardiéreLajzerowicz75 extensively developed a mean-field analysis of the BEG model and obtained liquid-gas-solid like phase diagrams on the - plane. However, they considered a lattice gas analogue of a simple fluid, where the physical pressure of the lattice gas is simply given by , with being the Helmholtz free energy per volume. In the present context, the pressure of the spin system has no physical meaning and the phase diagram obtained by Lajzerowicz and Sivardiére cannot be applied to TTF-CA.
V Concluding remarks
In this paper, we showed that the inter-stack electrostriction causes the term with a small coefficient and makes the phase diagram rich. We thus conclude that the inter-stack polar interaction together with the inter-stack electrostriction drives the discontinuous inter-stack lattice contraction and the multicritical behavior observed in TTF-CA.Cailleau97 ; Luty02 Our considerations are limited to classical models, i.e., we considered classical effective models, where all the microscopic (electronic or phonon) degrees of freedom are implicitly integrated out. To obtain the truly microscopic mechanism behind the multicriticality, we need to get back to such a microscopic Hamiltonian as an extended Peierls-Hubbard model.Miyashita03 We would keep this issue for future study.
This work was partly supported by a Grant-in-Aid for Scientific Research (C) from Japan Society for the Promotion of Science. TL wishes to acknowledge hospitality at the Institute for Molecular Sciences, Okazaki, and thank colleauges for creating a pleasant and stimulating environment there.
References
- (1) J. B. Torrance, J. E. Vazquez, J. J. Mayerle, and V. Y. Lee, Phys. Rev. Lett. 46, 253 (1981).
- (2) M. H. Lemée-Cailleau, M. Le Cointe, H. Cailleau, T. Luty, F. Moussa, J. Roos, D. Brinkmann, B. Toudic, C. Ayache, and N. Karl, Phys. Rev. Lett. 79, 1690 (1997).
- (3) T. Luty, H. Cailleau, S. Koshihara, E. Collet, M. Takesada, M-H. Lemée-Cailleau, M. Buron-Le Cointe, N. Nagaosa, Y. Tokura, E. Zienkiewicz, and B. Ouladdiaf, Europhys. Lett. 59, 619 (2002).
- (4) S. Koshihara, Y. Tokura, K. Takeda, T. Koda, Phys. Rev. Lett. 68, 1148 (1992).
- (5) E. Collet, M. H. Lemee-Cailleau, M. Buron-Le Cointe, H. Cailleau, M. Wulff, T. Luty, S. Koshihara, M. Meyer, L. Toupet, P. Rabiller and S. Techert, Science, 300, 612 (2003).
- (6) T. Iizuka-Sakano and Y. Toyozawa, J. Phys. Soc. Jpn. 65, 671 (1996).
- (7) N. Nagaosa, J. Phys. Soc. Jpn. 55, 3488 (1986).
- (8) T. Luty in Relaxatoins of Excited States and Photo-Induced Structural Phase Transitions, edited by K. Nasu, Springer Series in Solid-State Sciences 124 (Springer-Verlag, 1996) p. 142.
- (9) T. Kawamoto, T. Iizuka-Sakano, Y. Shimoi, and S. Abe, Phys. Rev. B 64, 205107 (2001).
- (10) M. Blume, V. J. Emery, and R. B. Griffiths, Phys. Rev. A 4, 1071 (1971).
- (11) H. M. McConnel, B. M. Hoffman, and R. M. Metzger, Proc. Natl. Acad. Sci. U.S.A. 53, 46 (1965).
- (12) D. J. Scalapino, Y. Imry, and P. Pincus, Phys. Rev. B 11, 2042 (1975).
- (13) W. Hoston, A. N. Berker, Phys. Rev. Lett. 67, 1027 (1991).
- (14) A. N. Berker and M. Wortis, Phys. Rev. B 14, 4946 (1976)
- (15) E. Albayrak and M. Keskin, J. Mag. Mag. Mater. 213, 201 (2000).
- (16) See, for example, P. W. Anderson, Basic Notions of Condensed Matter Physics, (Addison-Wesley, 1984), Section 2 C.
- (17) J. Lajzerowicz and J. Sivardière, Phys. Rev. A 11, 2079 (1975).
- (18) N. Miyashita, M. Kuwabara, and K. Yonemitsu, cond-mat/0211487 (unpublished), J. Phys. Soc. Jpn. (in press).