Induced Ge Spin Polarization at the Fe/Ge Interface
Abstract
We report direct experimental evidence showing induced magnetic moments on Ge at the interface in an Fe/Ge system. Details of the x-ray magnetic circular dichroism and resonant magnetic scattering at the Ge L edge demonstrate the presence of spin-polarized s states at the Fermi level, as well as d character moments at higher energy, which are both oriented antiparallel to the moment of the Fe layer. Use of the sum rules enables extraction of the L/S ratio, which is zero for the s part and for the d component. These results are consistent with layer-resolved electronic structure calculations, which estimate the s and d components of the Ge moment are anti-parallel to the Fe 3d moment and have a magnitude of .
pacs:
PACS numbers: 75.70.Cn, 78.70.Dm, 79.60.JvTransport of spins across the ferromagnet/semiconductor interface and their manipulation poses many fundamental questions but has wide implications for spin-based electronicsWolf et al. (2001). A key area is understanding how spin polarized electrons or holes are injected from a magnetic material into a semiconductorFiederling et al. (1999); Ohno et al. (1999). Semiconductor-based systems are intriguing since the electron’s spin can maintain coherence in a semiconductor while being transported over length scales that are orders of magnitude larger than those achievable in a metalKikkawa and Awschalom (1999). The Fe/GaAs system initially demonstrated low efficiency of spin injection,Zhu et al. (2001) which was understood to result from the large conductivity mismatch between the metal and semiconductorSchmidt et al. (2000). Recent results though have demonstrated high spin injection efficiencies by tunneling through the Schottky barrier formed at the metal/semiconductor interfaceHanbicki et al. (2002). However, to fully understand these systems requires a detailed understanding of the electronic and magnetic structure at this boundary, which will impact the ability for electron or holes to be transported into the semiconductor.
Interest in Fe/semiconductor systems (e.g.,Fe/Ge, Fe/GaAs,…) has been driven by the close lattice match between the two materials enabling growth of single-crystal structures. Early work demonstrated the ability to grow expitaxial thin filmsPrinz (1990), but significant intermixing at the interface was observed as welldel Guidice et al. (1987); Chambers et al. (1986). Further studies demonstrated that at the thin film limit the Fe layer possessed an in-plane uniaxial anisotropyKneedler et al. (1997); Ma and Norton (1997); Xu et al. (1999), which has been connected to thickness dependent interface strainThomas et al. (2003). Evidence of significant 3d charge transfer at the Fe/GaAs interface has been observed and was connected to bonding between Fe and AsFreeland et al. (2001a). With respect to the interface induced moment, electronic structure calculations have predicted an induced moment and modified density of states at the boundaryPickett and Papaconstantopoulos (1986); Cabria et al. (2001); Erwin et al. (2002). To date though there has been no direct evidence for these induced interface moments.
In this Letter we present direct evidence of spin-polarized Ge at the interface with a magnetic transition metal. X-ray magnetic circular dichroism at the Ge L edge in an Fe/Ge multilayer provided unambiguous evidence for induced spin on Ge. Comparison with single crystal results enable the identification of the spin polarization into a s moment close to the Fermi level and a d component at higher energy. The data is consistent with an antiparallel induced moment on Ge with indications of a nonzero orbital moment for the d component. Layer-resolved electronic structure calculations show the induced moment is localized around the interface with the s and d moments that are anti-parallel to the Fe 3d moment.

Element-selective magnetic measurements were made using x-ray magnetic circular dichroism (XMCD)Chen et al. (1995), which arises from the coupling of the magnetic orientation to the x-ray polarization. These experiments were performed at sector 4 of the Advanced Photon SourceFreeland et al. (2001b). Beamline 4-ID-C provides high-resolution polarized x-rays in the intermediate x-ray range of 500 - 3000 eV. The x-rays are generated by a novel circularly polarized undulator that provides left- and right-circular polarization switchable at demand at a polarization 96. The samples were studied by measurement of total fluorescence yield (TFY) using a microchannel plate detector. Fluorescence yield was used both because of its bulk sensitivity, as well as the ability to measure in an applied magnetic field. The measurement involves changing the magnetization direction at each energy point of the absorption curve to measure the absorption with photon helicity and magnetization parallel () and antiparallel (). The sum (-) provides chemical information while the XMCD (-) is magnetic in origin. Since the XMCD signal is very small, it was confirmed that the XMCD changed sign upon reversal of the photon helicity. In addition, x-ray resonant magnetic scattering (XRMS) was utilized to determine the spatial location of the induced spinKao et al. (1990); Freeland et al. (1999).
To maximize the interface contribution to the absorption signal, a multilayer sample was used. The Fe/Ge multilayers were prepared by sputtering at room temperature with a nominal structure of Si(100)/Ge(100 Å)/[Fe(22 Å)/Ge(22 Å)]20/Ge(100 Å) as confirmed by x-ray reflectivity and TEM. It should be noted here that Ge grown on Fe results in an amorphous structureMajkrzak et al. (1985). With the Ge unit cell being 5.66 Å, each monolayer (ML) will correspond to 2 Å of Ge from which it can be estimated that the interface comprises about 10 of the sample. A recent study though claims that this system cannot be considered simply as Fe/Ge. A large percentage of intermixing leading to coexisting Fe and FexGe1-x regionsSchleberger et al. (1999). From the details of this study we can estimate that the alloy component would comprise at most 25 of the sample.
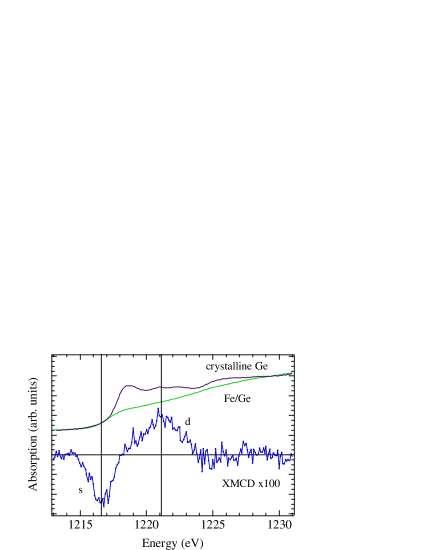
Measurement of the polarization-dependent absorption at the Ge L edge (see Figure 1) provides direct access to the electronic and magnetic order of Ge. Due to the dipole selection rules for x-ray absorption, this excitation details the d and s contributions to the spin polarized density of unoccupied states. Presence of a nonzero XMCD provides direct evidence of the spin-polarized Ge, but more detailed analysis of the data requires an understanding of the electronic character of the unoccupied states contributing to the XMCD. As will be shown below, the XMCD can be considered as consisting of 3 fundamental components: a negative peak close to the Fermi level ascribed to spin-polarized s states, higher lying spin-polarized d states, and an extended component that may be attributed to magnetic extended absorption fine structureSchütz et al. (1987). To assign the XMCD to particular electronic states first consider the results for bulk Ge, which will provide an initial framework.
Calculations for amorphous Ge (a-Ge) show the density of unoccupied states are nearly the same as crystalline (c-Ge) with only small modificationsRodrigues and Weisz (1987). The peaks in the c-Ge case result from both from the s and d density of unoccupied states as well as multiple scattering from the highly ordered crystalCastrucci et al. (1999). The edge for the c-Ge case was described by an initial peak due to s states followed by a double-peak feature due to d states. Results for the a-Ge system could be reproduced by the same density of states simply by varying the degree of coherent multiple scattering to simulate the disordered amorphous stateCastrucci et al. (1999). A comparison of our results with the crystalline case is shown in Fig. 2 and agrees well with previous results. Using this result enables an inital assignment based on the bulk electronic structure. The first XMCD peak in Fig. 2 lies in the pre-edge region close to the Fermi level, which may have important potential impact on spin-dependent transport. Bulk electronic structure in this region is predominately s character. The second XMCD peak coincides with the doublet assigned to d states. This provides an initial assignment as shown in Fig. 2, which is consistent with the analysis of the experimental data and the layer resolved density of state calculations, both of which are discussed below.
With an assignment of features, the dipole selection rules enable the determination of orientation between the Fe and Ge moments. The XMCD selection rules for p d vs. p sO’Brien and Tonner (1994); Dhesi et al. (1999) allow s and d contributions to the spin moment, , to be written as:
| (1) |
where is the probability ratio for s vs. d excitation and is the magnetic dipole term. In accord with recent results, it can be assumed that Dhesi et al. (1999) and Stöhr and König (1995). The important point is that the selection rules result in a minus sign between the d vs s XMCD for the same magnetic moment direction. Since the initial L3 XMCD is negative for Fe (not shown), this is direct evidence of the antiparallel orientation of the Ge s moment and the 3d transition metal moment. The d component has a positive signal indicating that the d component of the induced Ge moment is antiparallel to that of Fe as well. These results are in agreement with the electronic structure calculations presented below.
Sum rule analysis provides more detailed insight into the magnetic structure, but there are difficulties in the application to the case of Ge. Without a continuum excitation background subtraction and knowledge of the number of 4s and d holes in the conduction band, extraction of the spin and orbital moments is not possible. This is further complicated by the issue that not all of the electrons in the conduction band are spin polarized. As well there is charge transfer at the interface, which will mix the 3d electrons from Fe with the 4d electrons from Ge. However, the ratio, , where is the area of the respective XMCD peak, can provide the ratio of spin to orbital moment. Due to the small signal to noise in the spectrum, the peaks were fit with Gaussians, and the fit data were used for the energy integration (see Fig.1). With small signal to noise, the result can be lead astray by noise contributions. Since the purpose is to determine general trends in the spin-orbit ratio, the fit works very well and allows the two contributions to be separated assuming no overlap of the relative features.
From the area of the separate components, we can determine the orbit to spin ratio defined as:
| (2) |
In this case we have not included factors for the different character of the states. The results are shown in Table 1. The numbers for provide additional confirmation of the character assignment. The s component results in an , and the second peak in the XMCD results in a nonzero consistent with a d component. It is worth noting that the orbital moment is a significant fraction of the total moment and perhaps plays a role in the uniaxial part of the anisotropy for Fe/Ge(100)Ma and Norton (1997).
| State | ||||
|---|---|---|---|---|
| s | -0.0090 | 0.0092 | -.98 | 0.008 |
| d | 0.0122 | -.0043 | -2.9 | 0.5 |
To interpret these results theoretically, we turn to density-functional theory calculations. Two sets of calculations were performed to elucidate different aspects of induced Ge moments in Fe: (1) several specific Fe/Ge interface models representing varying degrees of Fe-Ge intermixing and (2) fixed-spin-moment calculations for bulk Ge, for the purpose of estimating the ratio between induced p-moments (which are the largest) to s and d moments (which are measured by the L edge XMCD). The calculations were performed within the generalized-gradient approximation, using projector-augmented-wave potentials Kresse and Hafner (1993); Kresse and Fürthmuller (1996). The plane-wave cutoff and k-point sampling were sufficient to converge all quantities to the precision given.
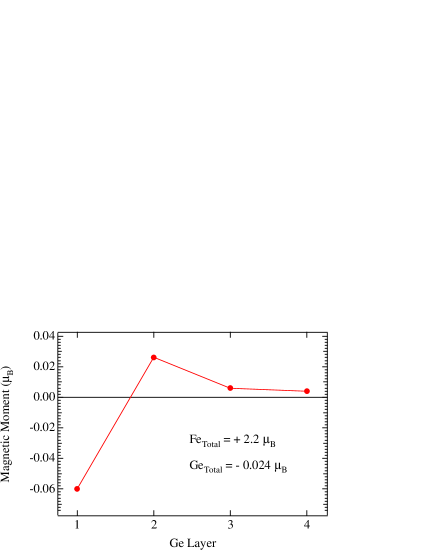
To study Fe/Ge interfaces, we used three models introduced previously for Fe/GaAs interfacesErwin et al. (2002). All are 1x1 interfaces between crystalline Ge and Fe, with the interface boundary either atomically abrupt or slightly intermixed (with 0.5 and 1.0 monolayers of Ge in the Fe host). The isolated interfaces were modeled by supercells containing seven layers each of Ge and Fe, with atomic coordinates completely relaxed within two layers of the interface. The induced Ge moments for the abrupt interface are shown in Fig. 3; the results for the other two models are qualitatively similar. The interfacial Ge layer has a moment of 0.06 antiparallel to the Fe magnetization. Although small, this is roughly half the value obtained for isolated Ge and thus appears reasonable. Ge atoms one layer away from the interface are less polarized (in the Fe direction), and further layers are essentially nonmagnetic. The Ge moments near the interface are predominantly p-like.
However, the L-edge XMCD is only sensitive to the s and d components of the total Ge moment. For the calculations described above, these contributions were only of the already small total Ge moment and hence are numerically difficult to resolve. To determine these ratios more systematically, we performed fixed-spin-moment calculations for crystalline Ge, varying the total moment, M, from zero to 1.5. For each value of M, we computed thes, p, and d contributions within an atomic sphere. The ratios Ms/Mp and Md/Mp are remarkably independent of the total moment. They do, however, depend strongly on the sphere radius used: for touching spheres Ms/Mp=0.3 and Md/Mp=0.1, while for volume-filling spheres Ms/Mp=0.1 and Md/Mp=0.3. Most importantly, the s- and d-moments are always parallel to the p-moment. These results are completely consistent with the results obtained above for the Fe/Ge interface. Hence, from these calculations, we conclude that the induced s- and d-moments on Ge atoms near the Fe/Ge interface are 0.01 , and are antiparallel to the Fe magnetization direction. However, since the XMCD averages over all layers, this measurement alone does not determine that the moment is localized at the Fe/Ge interface.
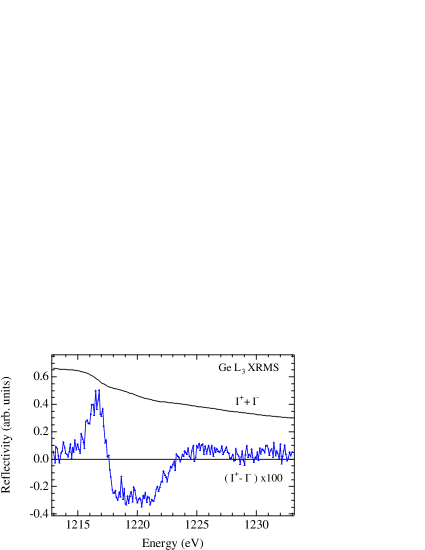
Indications of the localization of the Ge magnetic moment at the interface are provided by measurements of the x-ray resonant magnetic scattering (XRMS). Since XRMS probes changes in the chemical and magnetic density profile, it is very sensitive to the interface between two distinct elements. Figure 4 shows the average, as well as helicity-dependent signal arising from the Ge moment. Since XRMS examines the density profile, it is most sensitive to smooth interfaces with a distinct change in the chemical profile. For the case of the Fe-Ge alloy, the interface will not be well defined and should not result in a strong signal. The results here show a strong magnetic component that is of the same magnitude as the absorption result. This is a good indication of the moment localized near the Fe/Ge interface. Questions remain though concerning the presence of intermixed regions and how such a region would contribute to the magnetic signal.
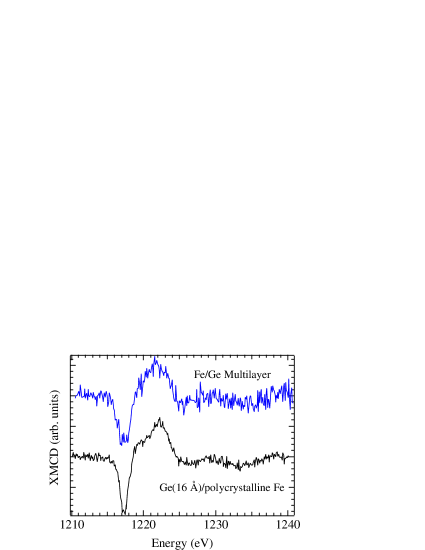
To confirm our result and rule out the possibility of this magnetic phase being ascribed to an alloy , an amphorous Ge thin film was prepared in situ on a clean polycrystalline Fe surface. As mentioned above, a previous study of Fe/Ge/Fe structures provided evidence for the formation of an Fe-Ge alloy phaseSchleberger et al. (1999). The results of this paper concluded that the alloy formation occurred during the Fe on Ge growth, not for the Ge grown on Fe. Using a UHV surface science chamber, a sample with the following structure was prepared: Si/polycrystalline Fe(50 Å)/amorphous Ge(16 Å). X-ray photoelectron spectroscopy (XPS) showed the sample was free from contamination and there was minimal intermixing of Fe and Ge. The measured XMCD spectra of the single Ge layer and the Fe/Ge multilayer are identical (see Fig. 5), which proves that the moment is formed at the Fe/Ge interface and not due to an FexGe1-x phase. Future work will focus on these single-layer structures to extract more a more detailed understanding of the interface electronic and magnetic structure.
Use of the Advanced Photon Source was supported by the U.S. Department of Energy, Office of Science, under Contract No. W-31-109-Eng-38. Computations were performed at the DoD Major Shared Resource Centers at ASC. This work was supported in part by the Office of Naval Research.
References
- Wolf et al. (2001) S. A. Wolf et al., Science 294, 1488 (2001).
- Fiederling et al. (1999) R. Fiederling et al., Nature 402, 787 (1999).
- Ohno et al. (1999) Y. Ohno et al., Nature 402, 790 (1999).
- Kikkawa and Awschalom (1999) J. M. Kikkawa and D. Awschalom, Nature 397, 139 (1999).
- Zhu et al. (2001) H. J. Zhu et al., Phys. Rev. Lett. 87, 16601 (2001).
- Schmidt et al. (2000) G. Schmidt et al., Phys. Rev. B 62, R4790 (2000).
- Hanbicki et al. (2002) A. T. Hanbicki et al., Appl. Phys. Lett. 80, 1240 (2002).
- Prinz (1990) G. Prinz, Science 250, 1092 (1990).
- del Guidice et al. (1987) M. del Guidice, J. Joyce, and J. Weaver, Phys. Rev. B 36, 4761 (1987).
- Chambers et al. (1986) S. Chambers et al., Phys. Rev. B 34, 6605 (1986).
- Kneedler et al. (1997) E. Kneedler et al., Phys. Rev. B 56, 8163 (1997).
- Ma and Norton (1997) P. Ma and P. Norton, Phys. Rev. B 56, 9881 (1997).
- Xu et al. (1999) Y. Xu et al., Phys. Rev. B 58, 890 (1999).
- Thomas et al. (2003) O. Thomas et al., Phys. Rev. Lett. 90, 17205 (2003).
- Freeland et al. (2001a) J. W. Freeland et al., Phys. Rev. B 63, 193301 (2001a).
- Pickett and Papaconstantopoulos (1986) W. E. Pickett and D. A. Papaconstantopoulos, Phys. Rev. B 34, 8372 (1986).
- Cabria et al. (2001) I. Cabria, A. Perlov, and H. Ebert, Phys. Rev. B 63, 104424 (2001).
- Erwin et al. (2002) S. C. Erwin, S.-H. Lee, and M. Scheffler, Phys. Rev. B 65, 205422 (2002).
- Chen et al. (1995) C. T. Chen et al., Phys. Rev. Lett. 75, 152 (1995).
- Freeland et al. (2001b) J. W. Freeland et al., Rev. Sci. Instrum. 73, 1408 (2001b).
- Kao et al. (1990) C. C. Kao et al., Phys. Rev. Lett. 65, 373 (1990).
- Freeland et al. (1999) J. W. Freeland et al., Phys. Rev. B 60, R9923 (1999).
- Majkrzak et al. (1985) C. Majkrzak, J. Axe, and P. Böni, J. Appl. Phys. 57, 3657 (1985).
- Schleberger et al. (1999) M. Schleberger et al., Phys. Rev. B 60, 14360 (1999).
- Schütz et al. (1987) G. Schütz et al., Phys. Rev. Lett. 58, 737 (1987).
- Rodrigues and Weisz (1987) D. Rodrigues and J. Weisz, Phys. Rev. B 36, 6685 (1987).
- Castrucci et al. (1999) P. Castrucci et al., Phys. Rev. B 60, 5759 (1999).
- O’Brien and Tonner (1994) W. L. O’Brien and B. Tonner, Phys. Rev. B 50, 12672 (1994).
- Dhesi et al. (1999) S. S. Dhesi et al., Phys. Rev. B 60, 12852 (1999).
- Stöhr and König (1995) J. Stöhr and H. König, Phys. Rev. Lett. 75, 3748 (1995).
- Kresse and Hafner (1993) G. Kresse and J. Hafner, Phys. Rev. B 47, 558 (1993).
- Kresse and Fürthmuller (1996) G. Kresse and J. Fürthmuller, Phys. Rev. B 54, 11169 (1996).