Stromatolites: why do we care?
Abstract
We apply the method of Diffusion Entropy (DE) to the study of stromatolites by means of a two-dimensional procedure that makes it possible for us to compare the DE analysis to the results of a compression method. As done with the compression method, we analyze two pairs of samples, one biotic and the other a-biotic. Each pair consists of a target, the putative stromatolite sample, and of its surrounding matrix. We use two different procedures, referring to single colors and to a color combination, respectively. We apply the DE method to both procedures and we find the same result, this being that the scaling index of the time series stemming from the biotic target yields a scaling index larger than the scaling indices of the other three curves. We argue that the DE analysis confirms the results of the compression method.
I Introduction
Let us explain the meaning of the title of this paper. One of the papers of these Proceedings michael is devoted to the intriguing problem of distinguishing biotic from a-biotic stromatolites. Why do we care about the conclusion of Ref. michael ? This is the meaning of the question posed by the title of this paper. To answer this question, we have to draw the reader’s attention to an earlier work giulia , devoted to the problem of assessing the complexity of a process, as it is mirrored by a time series derived in some way from the process under study. The title of the paper of Ref. giulia : ” Compression and diffusion: a joint approach to detect complexity” is self-explanatory. In fact, the authors of Ref. giulia discussed two methods of analysis of time series, the former with a mathematical foundation, and the latter with a physical (dynamic) foundation. The former method rests on the concept of computable information content and is, consequently, closely related to the compression algorithm used in Ref. michael . The second method rests on converting first the time series to study into a diffusion process. Then, as a second step, we evaluate the entropy of this diffusion process giulia , this being the reason why the method is called Diffusion Entropy (DE) method. We refer the reader to the paper of Ref. giulia for details on both method. Here we limit ourselves to observing that the connection between the two methods of analysis is explained as follows. If a time series is found to be compressible, this is an indication that there is strong correlation. This strong correlation means that the diffusion process generated by the first step of the DE method must reach an anomalous scaling regime, with a scaling parameter that is expected to be different from the scaling of diffusion process that would be generated by a random time series. We expect that the more compressible the time series is, the larger is the deviation of the diffusion scaling from the ordinary value (). This is the main reason why we care about the results of paper michael , which uses the compression method to study stromatolites. If the arguments of Ref. giulia are correct, and of general validity, then the DE method applied to the same stromatolites as those studied in Ref. michael , should yield for the biotic stromatolite a scaling parameter larger than that stemming from the a-biotic stromatolite. However, to get this wished result, which would support the conclusion of the earlier paper michael and, at the same time, would confirm that the arguments of Ref. giulia have a general validity, we have to adapt the DE method to the specific requests posed by the analysis of digital images of polished stromatolite slabs. We solve this problem in Section 2. Section 3 is devoted to illustrating the results and Section 4 to the concluding remarks.
II Methods
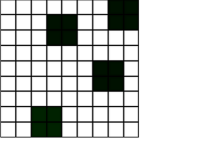
In this Section we describe, briefly, how to adapt the DE method to the analysis of digital RGB uncompressed TIFF format images of polished stromatolite slabs. For technical details on the meaning of the acronyms, we refer the reader to the paper of Ref. michael and to the papers there quoted. Each pixel of a digitalized RGB image is labeled with three integer numbers, representing the intensity of each of the three fundamental colors: a value of indicates the absence of the color, while a value of indicates the presence of the color with the maximum possible intensity, according to the RGB scale. Therefore each RGB image is represented by three different matrixes, with and denoting the dimensions, in pixels, of the image. The DE method for the analysis of time series, namely an ordered sequence of data represented by an one dimensional array, rests on using the time series itself, to create a diffusion process and to monitor the entropy increase as a function of time. To accomplish this, we move a window of increasing size through the time series, summing all the data therein contained. If is the length of the time series and is the size of the window adopted, different data are obtained through the moving and summing procedure. This numbers are considered as the possible positions that an imaginary walker can assume after moving for a time , and used to define the probability density function (pdf) of the diffusion process at this time. Finally, we evaluate the Shannon entropy of the pdf. The generalization of this procedure to the case where the data to examine are represented by a matrix is simple. The window of size to move through the sequence of data, is substituted by a square of size to be moved through the matrix. Fig. 1 illustrates how to apply this procedure to a square of size and, thus, to a matrix . The sum of all the elements inside a square has to be considered as one of the possible positions that an imaginary walker can assume after a time . With this modification it is possible to use the data contained in a matrix to build up a one-dimensional diffusion process. A digital RGB image stems from three different matrixes and we are naturally led to two possible ways of applying the DE method to the image. The first one is to create a one-dimensional diffusion process for each one of the three matrixes representing the intensity of the three fundamental colors, and to examine the dependence of the diffusion entropy on the color. We shall refer to this analysis as the “single color DE image analysis”. The second one is to use the three matrixes to create a three-dimensional diffusion process and to evaluate the change in time of its entropy. This is done using the three matrixes of an RGB image file, to determine the movement of the imaginary walker in the space, with the x, the y and the z-axis, referring to the red, green and blue color, respectively. This last technique will be referred to by us as the “global DE image analysis”.
III Results
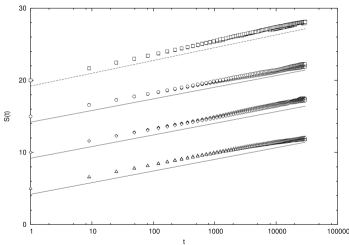
In order to establish, hopefully, the biogenicity of a given stromatolite through statistical analysis of the corresponding RGB images, the authors of Ref. michael decided to compare the results of the compressibility of putative biotic and a-biotic stromatolites with the compressibility of the rock matrix surrounding the samples. Here, we shall follow the same strategy for the results of the single-color DE image analysis and global DE image analysis. We explore the same database of Ref. michael and, for brevity, we report the results relative to just four images, a putative biotic target, the surrounding matrix of the biotic target, a putative a-biotic target and its surrounding matrix. Fig. 2 shows the results of the application of the single-color DE image analysis. For clarity, the curves relative to different images are shifted to different initial values. Moreover, another shifting procedure is applied to the three curves relative to the three different color matrixes of a single image, so that only the rates of increase of diffusion entropy are compared. We see that the three different colors, for all the images, produce, approximately, the same curve and that only the curves of the putative biotic image yield a quantitatively different rate of entropy increase, as indicated by the corresponding slopes, which are different from the others.
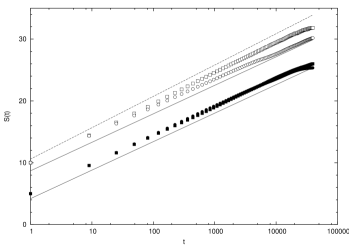
Fig. 3 shows the results of the global DE image analysis. Again, a procedure of shifting of the curves is adopted, so as to compare among themselves only the rates of entropy increase, in the linear-log representation. We see clearly that the diffusion process generated by the putative a-biotic sample and the one generated by its surrounding matrix yield, virtually, the same rate of entropy increase. It is evident, though, that the putative biotic sample yields a slope distinctly larger than that stemming from its surrounding matrix, a slope which, is, on the contrary, close to that of both a-biotic target and a-biotic surrounding. Fig. 3 shows that the biotic target has a slope close to , while the other three curves yield a slope close to . Note that an entropy increase with a slope is the result expected for an ordinary three-dimensional diffusion.
IV Concluding Remarks
We see that the extension of the DE method to the analysis of
two-dimensional images yields results supporting the conclusion of the
paper of Ref.michael . The most compressible two-dimensional
image yields the largest scaling. As to the relevance of this
conclusion for the challenge posed by the search for a way to
distinguish biotic from a-biotic stromatolites, we limit ourselves to
the following remark. We see that, although the biotic target yields
the highest scaling, also the scaling of both biotic and a-biotic
surroundings are larger than the ordinary scaling. This means that
complexity is a general property. It is not only a property of living
systems, it is rather a property of the so called living state
of matter marco ; gerardo . Thus, the fact that distinguishing
biotic from a-biotic stromatolites is a challenging issue, is a way to
answer a provocative question raised by the author of
Ref. gunter . Pete Gunter gunter writes: ” How odd it is
that on this planet at least life emerged at virtually the same
time as rocks.” We think that the field of Complexity is affording an
answer to this question. Life and rocks are perceived as foreign the
one to the others, if the vision of ordinary statistical mechanics is
adopted. Ordinary statistical mechanics is not a fair representation
of reality, but only a condition mirroring one of the two basic
properties of nature: randomness, the other being order. The balance
of randomness with order yields a condition intermediate between the
dynamic and the thermodynamic state gerardo , with phenomena
such as aging that according to the traditional wisdom seem to be
peculiar to living systems. On the contrary, as proven in
Ref. gerardo , these phenomena are manifested also by non-living
systems. So, a new perspective, moving from Bergson gunter ,
benefiting from the pioneering work of Prigogine gunter ; marco ,
and yielding, finally, the concept of Living State of Matter
marco ; gerardo , can also be used to explain why the
stromatolite problem is difficult, and so challenging, and much more
research work is required to establish how general are the conclusion
of this paper and of the companion paper of Ref. michael .
PG and MI acknowledge support from ARO, through Grant DAAD19-02-0037.
References
- (1) M. C. Storrie Lombardi, F. A. Corsetti, P. Grigolini, M. Ignaccolo, P. Allegrini, S. Galatolo and G. Tinetti, Chaos, Solitons and Fractals, Proceedings of the October 2002 Complexity Workshop.
- (2) P. Allegrini, V. Benci, P. Grigolini, P. Hamilton, M. Ignaccolo, G. Menconi, L. Palatella, G. Raffaelli, N. Scafetta, M. Virgilio, J. Yang, Chaos, Solitons and Fractals 15, 517 (2003).
- (3) M. Buiatti, M. Buiatti, Chaos, Solitons and Fractals, these Proceedings.
- (4) P. Allegrini, G. Aquino, P. Grigolini, L. Palatella, A. Rosa, submitted to Phys. Rev. E.
- (5) P. Gunter, Chaos, Solitons and Fractals, these Proceedings.