Superconductivity and crystalline electric field effects in the filled skutterudite series Pr(Os1-xRux)4Sb12
Abstract
X-ray powder diffraction, magnetic susceptibility , and electrical resistivity measurements were made on single crystals of the filled skutterudite series Pr(Os1-xRux)4Sb12. One end of the series () is a heavy fermion superconductor with a superconducting critical temperature K, while the other end () is a conventional superconductor with K. The lattice constant decreases approximately linearly with increasing Ru concentration . As Ru (Os) is substituted for Os (Ru), decreases nearly linearly with substituent concentration and exhibits a minimum with a value of K at , suggesting that the two types of superconductivity compete with one another. Crystalline electric field (CEF) effects in and due to the splitting of the Pr3+ nine-fold degenerate Hund’s rule multiplet are observed throughout the series, with the splitting between the ground state and the first excited state increasing monotonically as increases. The fits to the and data are consistent with a doublet ground state for all values of x, although reasonable fits can be obtained for a ground state for values near the end member compounds ( or ).
pacs:
71.27.+a, 74.25.Fy, 74.25.Ha, 74.62.DhI Introduction
The filled skutterudite compound PrOs4Sb12 was recently discovered to be the first Pr-based heavy fermion superconductor, with a superconducting transition temperature K and an effective mass , where is the free electron mass.Bauer02a ; Maple02a Features in the dc magnetic susceptibility , specific heat , electrical resistivity , and inelastic neutron scattering (INS) can be associated with the thermally dependent population of the ninefold degenerate Pr Hund’s rule multiplet split by a cubic crystalline electric field (CEF). These data suggest that the ground state of PrOs4Sb12 is a doublet, separated from a triplet first excited state by K.Bauer02a ; Maple02a The possibility of a singlet ground state has also been put forward based on other measurements,Aoki02 ; Kohgi03 some of which also consider tetrahedral symmetry operators in their calculations of the CEF Hamiltonian of PrOs4Sb12.Takegahara01 It has been proposed that the superconductivity in PrOs4Sb12 may be due to quadrupolar fluctuations,Bauer02a a claim that has been supported by SRMacLaughlin02 and Sb-NQRKotegawa03 measurements, which indicate a strong-coupling isotropic energy gap of . Other intriguing effects are seen in PrOs4Sb12, including multiple superconducting transitionsMaple03 ; Vollmer03 ; Oeschler03a and phases,Izawa03 and an ordered phase that is observed in high magnetic fields and low temperatures.Ho02 This high field ordered phase (HFOP), which is seen in measurements of ,Ho02 ,Vollmer03 ; Aoki02 magnetization ,Ho03 thermal expansion ,Oeschler03a and magnetostriction Oeschler03b in a magnetic field , as well as measurements of isotherms,Ho03 appears to be related to the crossing of the CEF energy levels in magnetic fields.Vollmer03 ; Frederick03a In addition, neutron diffraction experimentsKohgi03 indicate the presence of quadrupolar effects in the HFOP, analagous to those seen in PrPb3.Tayama01 PrOs4Sb12 has proven to be a unique compound, and will continue to provide a fertile area of research for many years.
The isostructural compound PrRu4Sb12 displays superconductivity below K and possesses an electronic specific heat coefficient approximately to times smaller than PrOs4Sb12, identifying it at as a conventional metal, or at most a borderline heavy fermion metal.Takeda00 It was previously reported, based on measurements of , to possess a ground state and a triplet first excited state K above the ground state.Takeda00 A later measurement of also supported this CEF level scheme.Abe02 PrRu4Sb12 appears to be a BCS-like weak-coupling superconductor, with an isotropic s-wave energy gap of , as determined from Sb-NQR measurements.Yogi03 At the present time, no quadrupolar effects or features resembling the HFOP seen in PrOs4Sb12 have been reported in PrRu4Sb12.
The substitution of PrRu4Sb12 into PrOs4Sb12 to form Pr(Os1-xRux)4Sb12 was undertaken to investigate the evolution of the superconductivity, the CEF energy level scheme, and the heavy fermion state with Ru-doping, and to investigate the relationship, if any, between these three phenomena. The present study focuses on measurements of and , which have revealed the -dependencies of and the splitting between the CEF ground state and the first excited state. We are also in the process of investigating the heavy fermion state via measurements of , and the upper critical field through measurements of (which will also reveal the -dependence of the HFOP), and will report these results in a future publication.
II Experimental Details
Single crystals of Pr(Os1-xRux)4Sb12 were grown using an Sb flux method. The elements (Ames N Pr, Colonial Metals N Os and N Ru, and Alfa Aesar N Sb) were sealed under Torr Ar in a carbon-coated quartz tube in the ratio , heated to C at C/hr, then cooled at C/hr to C. The samples were then removed from the furnace and the excess Sb was spun off in a centrifuge. The crystals were removed from the leftover flux by etching with dilute Aqua Regia (HCl:HNO3:H2O ).
X-ray powder diffraction measurements were made at room temperature using a Rigaku D/MAX B x-ray machine. The only significant impurities in any of the samples were identified with free Sb that was still attached to the crystals. Each Pr(Os1-xRux)4Sb12 sample crystallized in the LaFe4P12 structure Braun80 with a lattice constant that decreased roughly linearly with increasing Ru concentration , as displayed in Fig. 1. A silicon standard was used in order to achieve a more accurate determination of the lattice constant. Measurements of vs temperature were made in a magnetic field of tesla between and K in a commercial Quantum Design superconducting quantum interference device (SQUID) magnetometer. Measurements of and were made as a function of down to K in a 4He cryostat and, for several of the samples, down to K in a 3He-4He dilution refrigerator.
III Results
III.1 Magnetic Susceptibility
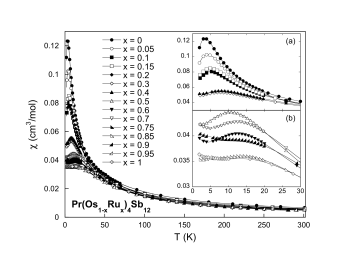
Displayed in the main portion of Fig. 2 is a plot of the dc magnetic susceptibility as a function of temperature for single crystals of Pr(Os1-xRux)4Sb12 with various values of . Above K, the inverse magnetic susceptibility is linear, indicating Curie-Weiss behavior. The data have been corrected for excess Sb by assuming that the high temperature effective moment, , of Pr should be equal to the Hund’s rule free ion value of for Pr3+, where is the Bohr magneton. Any deviation from this value was attributed to free Sb inclusions in the Pr(Os1-xRux)4Sb12 crystals. The most significant effect on from this correction was not the small diamagnetic Sb signal but instead the change in overall scaling due to the difference in mass used to calculate in units of cm3/mol from the raw magnetization data. The calculated percentages of mass attributed to Sb out of the total sample volume for all values of are listed in Table 1. The estimated value of the Sb mass depends slightly on the CEF ground state used to make the fit correction; only the values for a ground state are given for simplicity.
All of the Pr(Os1-xRux)4Sb12 samples exhibit features (peaks or plateaus) in that can be attributed to CEF effects. These features are the focus of the two insets in Fig. 2. The low temperature data for the samples from to are shown in Fig. 2(a), while Fig. 2(b) similarly displays data for the samples from to . An explanation of the fits used to determine the CEF parameters from the data, as well as the parameters themselves, is given in section IV.2.
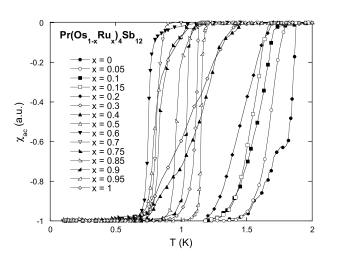
Low temperature ( K) ac magnetic susceptibility vs data for Pr(Os1-xRux)4Sb12 are shown in Fig. 3. A sharp diamagnetic transition can be seen for all values of , indicating the presence of superconductivity. The superconducting critical temperature for each concentration was determined from the data displayed in Fig. 3 as the midpoint of the diamagnetic transition. A plot of vs is displayed in Fig. 6, and is discussed further in section IV.1. An additional feature of note is the step-like structure that appears in the data for PrOs4Sb12. Since double superconducting transitions have been observed in specific heat and thermal expansion measurements on both collections of single crystals and individual single crystals,Maple03 ; Vollmer03 ; Oeschler03a it is reasonable to assume that this step in the diamagnetic transition for PrOs4Sb12 is also due to an intrinsic second superconducting phase instead of a variation of throughout the multiple crystals used in the measurements. None of the other concentrations display significant structure in their superconducting transitions, although the transitions for and are much wider than for the other concentrations. This may be due to a variation of between individual crystals for these two concentrations.
III.2 Electrical Resistivity
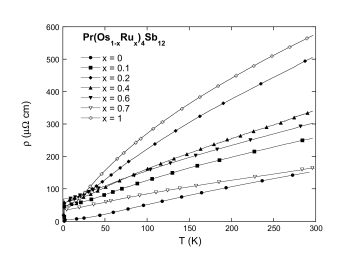
Fig. 4 displays high-temperature electrical resistivity vs data for Pr(Os1-xRux)4Sb12 for various values of between and . The values of at room temperature, , and the extrapolated values of at zero temperature from fits to the data based on calculations of that incorporate CEF splitting of the Pr multiplet (see section IV.2), , are listed in Table 1. Also listed in Table 1 is the residual resistivity ratio (RRR), defined as . It is surprising that the RRR of PrRu4Sb12 is so much lower than that of PrOs4Sb12, since they are both stoichiometric compounds and would be expected to have a low residual resistivity. A previous measurement of PrRu4Sb12 found cm and an RRR of ,Takeda00 in reasonable agreement with the data presented in this paper. The low RRR of PrRu4Sb12 is not presently understood.
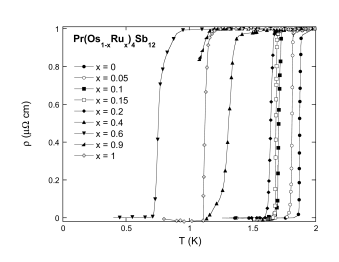
The electrical resistivity of Pr(Os1-xRux)4Sb12 below K is shown in Fig. 5. The data have been normalized to their values at K in order to emphasize the superconducting transitions. The sample did not display the onset of superconductivity down to the lowest measured temperatures and no data for this sample are shown in this plot; the heating due to large contact resistances in the and samples precluded measurements below K. The superconducting transitions as determined from are in reasonable agreement with those measured inductively (Fig. 3), and the plot of vs is discussed in the following section.
IV Analysis and Discussion
IV.1 Superconductivity
The dependence of the superconducting transition temperature on Ru concentration for Pr(Os1-xRux)4Sb12 is shown in Fig. 6. Several concentrations have more than one data point associated with them, which are from measurements of different crystals. These additional measurements were not shown in Figs. 4 and 5 or listed in Table 1 in the interest of clarity. The RRRs were nearly identical for all crystals of a given concentration, with the exception of the samples where the crystal with the lowest in Fig. 6 had an RRR about half of that measured for the other two samples, one of which is listed in Table 1. The vertical bars in Fig. 6 are a measure of the width of the superconducting transitions, taken to be the and values of the resistance change associated with the transition.
The trend of the vs data shown in Fig. 6 suggests a competition between the two different types of superconductivity seen in PrOs4Sb12 and PrRu4Sb12. This competition suppresses from both ends, culminating in a minimum of K near . Specific heat measurements are in progress, and it will be interesting to see if the heavy fermion state can be correlated with . The persistence of superconductivity throughout the series is unusual, as for heavy fermion f-electron superconductors both magnetic and nonmagnetic impurities generally produce relatively rapid depressions of . When the impurity is of an element that would produce an isostructural superconducting compound, the trend is not as clear. For example, the U1-xLaxPd2Al3 system is similar to the Pr(Os1-xRux)4Sb12 system in that one end member compound, UPd2Al3, is a heavy fermion superconductor, while the other end member compound, LaPd2Al3, is a conventional BCS superconductor. Unlike Pr(Os1-xRux)4Sb12, however, superconductivity is destroyed upon substitution on either end of the series.Zapf01b This persistence of superconductivity throughout of the Pr(Os1-xRux)4Sb12 system for all values of is observed in the CeCo1-xIrxIn5 series of compounds, which is also superconducting for all values of .Pagliuso02 This system’s similarities to Pr(Os1-xRux)4Sb12 end there, because both end member compounds (CeCoIn5 and CeIrIn5) are heavy fermion superconductors in which the superconductivity is believed to be magnetically mediated and to possess nodes in the energy gap .Movshovich02
This nodal energy gap structure may be in contrast with PrOs4Sb12, where SRMacLaughlin02 and Sb-NQRKotegawa03 measurements indicate an isotropic energy gap, a condition which could occur if the superconductivity in PrOs4Sb12 was mediated by quadrupolar fluctuations. It is also generally the case that superconductors with isotropic or nearly isotropic energy gaps are relatively insensitive to the presence of nonmagnetic impurities. Thus, the gradual decrease of , and the presence of superconductivity for all values of in Pr(Os1-xRux)4Sb12, provides further evidence for an isotropic energy gap and quadrupolar superconductivity in PrOs4Sb12, since PrRu4Sb12 also possesses an isotropic superconducting energy gap.Yogi03 The minimum in near could then be attributed to a shift from quadrupolar mediated heavy fermion superconductivity to phonon mediated BCS superconductivity. On the other hand, thermal conductivity measurements of PrOs4Sb12 in a magnetic field have been interpreted in terms of two distinct superconducting phases in the plane, one with two point nodes in in low fields, and another with six point nodes in at higher fields.Izawa03 Since no thermal conductivity measurements were reported for fields below T, the structure of is not known below this field. It is conceivable that, just as a magnetic field induces a change from a state with two point nodes into a state with six point nodes, the state with two point nodes is itself induced from an isotropic zero-field energy gap. Further measurements of the energy gap symmetry in zero and low magnetic field could shed light on this mystery.
IV.2 Crystalline Electric Field Effects
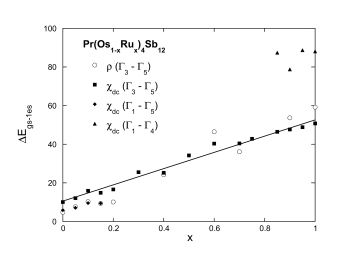
The and data for Pr(Os1-xRux)4Sb12 were fit to equations including CEF effects, in a manner identical to that reported previously.Bauer02a ; Frederick03a The CEF equations were derived from the Hamiltonian of Lea, Leask and Wolf (LLW).Lea62 In the LLW formalism, the CEF energy levels are given in terms of the parameters and , where is the ratio of the fourth and sixth order terms of the angular momentum operators and is an overall energy scale factor. It was assumed that the CEF parameter which controls the tetrahedral crystalline symmetry contribution to the HamiltonianTakegahara01 was small; thus, the calculations were made for a cubic crystalline symmetry. Assuming that is small implies that the main contribution to the crystalline electric field comes from the simple cubic transition metal sublattice (Os or Ru), as opposed to the more complicated tetrahedral Sb sublattice. The data for could be reasonably fit with either a or a ground state and a first excited state. As increases, the magnitude of the peak in decreases more rapidly than the temperature at which the peak occurs. The peak also broadens until it resembles a hump. These changes with make it unreasonable to fit a – CEF energy level scheme to the higher data, since for these data an energy level scheme with the correct makes the peak too sharp, while the correct hump shape results in a that is too high. Thus, for the Pr(Os1-xRux)4Sb12 samples with , a ground state best approximated the data. An example of a fit with a ground state for is shown in Fig. 7(a). A plot of the splitting between the ground state and the first excited state vs is shown in Fig. 8, including all reasonable fits of the data.
The Pr(Os1-xRux)4Sb12 samples with all display upturns in at the lowest temperatures (inset (b) in Fig. 2). If these upturns are due to the splitting of the CEF energy levels in a small magnetic field , then it is expected that they would be more visible in the samples with large (more Ru than Os), where is smaller at low temperatures compared to the small (more Os than Ru) data. The samples with , including PrRu4Sb12, also display structure in these upturns that appear to be an additional peak near K superimposed on the broad CEF hump, near the temperature of the CEF peak in PrOs4Sb12. The smooth progression of both the lattice parameter and indicates that there is no macroscopic phase separation of Pr(Os1-xRux)4Sb12 into PrOs4Sb12 and PrRu4Sb12. However, it is possible that the peak-like structure could be due to inhomogeneous alloying of Os and Ru on an atomic scale, wherein each Pr3+ ion sees a distribution of Os or Ru atoms, leading to a variation in the CEF throughout the crystal. Unfortunately, this possibility would be difficult to establish in the current experiments. The low-temperature upturn, especially in PrRu4Sb12, could be attributed to either CEF splitting in or paramagnetic impurities, both of which could produce a low-temperature increase in .
Takeda et al. reported that PrRu4Sb12 had a singlet ground state and a triplet first excited state, a CEF configuration that exhibits a plateau in at low temperatures.Takeda00 In the current experiment, the and samples are the only ones in which a plateau is observed. In addition, while the other samples with have their peaks reasonably well described by a ground state, the fit predicts a saturation at K that is much lower than is observed in the data. However, the low- upturn could be responsible for disguising both the maximum in and and the low temperature saturation observed in the other high Ru concentration samples. Accordingly, all the Pr(Os1-xRux)4Sb12 data with were fit assuming both a CEF energy level scheme and a scheme, ignoring the low-temperature upturn; the fits are shown in Fig. 7(b). Both fits are represented in the splitting between the ground state and first excited state vs plot of Fig. 8; the results from all fits are also listed in Table 1.
The electrical resistivity of Pr(Os1-xRux)4Sb12 was fit by a combination of scattering from impurities, the atomic lattice (phonons), and temperature-dependent energy level populations due to the CEF.Frederick03a The phonon contribution was represented by the measured of LaOs4Sb12, an isostructural reference compound without f-electrons, for all values of . This procedure was validated by reproducing the results of Abe et al.Abe02 with LaOs4Sb12 instead of LaRu4Sb12; as expected, the data of the two compounds appear to be nearly identical. The CEF contribution to consists of two terms, representing magnetic exchange and aspherical Coulomb scattering, which were assumed to be equally important when fitting the data.Frederick03a Just as it was possible to fit of PrOs4Sb12 with either a or a ground state, all of the Pr(Os1-xRux)4Sb12 data were indifferent to the choice of either ground state. The splitting between the ground state and the first excited state (always a triplet) was also nearly identical for fits with either ground state for a particular value of . In the interest of simplicity, for the data, only the splitting between and , , is shown in Fig. 8. The fit used to calculate for is shown in Fig. 7(b). It is evident that measurements will be required to elucidate the CEF ground state from transport measurements.Frederick03a
It is unclear what effect the CEF ground state may have on the superconductivity in Pr(Os1-xRux)4Sb12. From a physical point of view, it is reasonable that an abrupt change in the ground state would produce an equally abrupt change in the physical properties. However, it is difficult to conceive of a mechanism for this occurrence in the context of the LLW theory, since it is based on the interaction of the atomic lattice with a rare earth ion. If there is not an abrupt change in the lattice structure, one should not expect an abrupt change in the CEF ground state. It is therefore far more reasonable to consider a constant ground state, with the excited state varying as the Ru substitution changes the spacing of the atoms in the skutterudite lattice. The present data are most consistent with a constant ground state, with the exception of the and data. However, when is in the region a CEF energy level scheme is the only one which reasonably fits the data. On the other hand, the possibility cannot be ruled out that this deep in a substituted system, a CEF analysis in the tradition of LLW may be unreliable due to the distribution of the two substituents (Or and Ru) in the near neighbor environment of each Pr3+ ion. The gradual metamorphosis of the data does suggest that the CEF parameters are also changing gradually, but this may be misleading. Further experiments as well as theoretical analysis will be necessary to completely reveal the CEF ground state and its relationship to the superconductivity.
V Summary
The superconducting critical temperature and crystalline electric field (CEF) parameters of single crystals of Pr(Os1-xRux)4Sb12 have been deduced through measurements of and for . The superconductivity, which is present for all values of , exhibits a change in the sign of the slope in near . The CEF ground state may also change from a ground state to a ground state near this concentration, although more measurements are necessary to confirm this possibility. It is possible that the crossover from heavy fermion superconductivity that may be mediated by quadrupolar interactions to nearly BCS superconductivity occurs at this ‘pseudocritical’ concentration .
Acknowledgements
We would like to thank S. K. Kim and D. T. Walker for experimental assistance, and E. D. Bauer for useful discussions. This research was supported by the U.S. Department of Energy Grant No. DE-FG03-86ER-45230, the U.S. National Science Foundation Grant No. DMR-00-72125, and the NEDO International Joint Research Program.
References
- (1) E. D. Bauer, N. A. Frederick, P.-C. Ho, V. S. Zapf, and M. B. Maple, Phys. Rev. B 65, 100506(R) (2002).
- (2) M. B. Maple, P.-C. Ho, V. S. Zapf, N. A. Frederick, E. D. Bauer, W. M. Yuhasz, F. M. Woodward, and J. W. Lynn, J. Phys. Soc. Jpn. 71 Suppl., 23 (2002).
- (3) Y. Aoki, T. Namiki, S. Ohsaki, S. R. Saha, H. Sugawara, and H. Sato, J. Phys. Soc. Jpn. 71, 2098 (2002).
- (4) M. Kohgi, M. Iwasa, M. Nakajima, N. Metoki, S. Araki, N. Bernhoeft, J.-M. Mignot, A. Gukasov, H. Sato, Y. Aoki, and H. Sugawara (unpublished).
- (5) K. Takegahara, H. Harima, and A. Yanase, J. Phys. Soc. Jpn. 70, 1190 (2001).
- (6) D. E. MacLaughlin, J. E. Sonier, R. H. Heffner, O. O. Bernal, B.-L. Young, M. S. Rose, G. D. Morris, E. D. Bauer, T. D. Do, and M. B. Maple, Phys. Rev. Lett. 89, 157001 (2002).
- (7) H. Kotegawa, M. Yogi, Y. Imamura, Y. Kawasaki, G. q. Zheng, Y. Kitaoka, S. Ohsaki, H. Sugawara, Y. Aoki, and H. Sato, Phys. Rev. Lett. 90, 027001 (2003).
- (8) M. B. Maple, P.-C. Ho, N. A. Frederick, V. S. Zapf, W. M. Yuhasz, and E. D. Bauer, Acta Physica Polonica B 34, 919 (2003).
- (9) R. Vollmer, A. Fait, C. Pfleiderer, H. v. Löhneysen, E. D. Bauer, P.-C. Ho, V. S. Zapf, and M. B. Maple, Phys. Rev. Lett. 90, 057001 (2003).
- (10) N. Oeschler, P. Gegenwart, F. Steglich, N. A. Frederick, E. D. Bauer, and M. B. Maple, Acta Physica Polonica B 34, 959 (2003).
- (11) K. Izawa, Y. Nakajima, J. Goryo, Y. Matsuda, S. Osaki, H. Sugawara, H. Sato, P. Thalmeier, and K. Maki, Phys. Rev. Lett. 90, 117001 (2003).
- (12) P.-C. Ho, V. S. Zapf, E. D. Bauer, N. A. Frederick, and M. B. Maple, Int. J. Mod. Phys. B 16, 3008 (2002).
- (13) P.-C. Ho, N. A. Frederick, V. S. Zapf, E. D. Bauer, T. D. Do, M. B. Maple, A. D. Christianson, and A. H. Lacerda, Phys. Rev. B 67, 180508(R) (2003).
- (14) N. Oeschler, F. Weickert, P. Gegenwart, P. Thalmeier, F. Steglich, E. D. Bauer, and M. B. Maple, Phys. Rev. B (2003), submitted.
- (15) N. A. Frederick and M. B. Maple, J. Phys.: Condens. Matter 15, 4789 (2003).
- (16) T. Tayama, T. Sakakibara, K. Kitami, M. Yokoyama, K. Tenya, H. Amitsuka, D. Aoki, Y. Onuki, and Z. Kletowski, J. Phys. Soc. Jpn. 70, 248 (2001).
- (17) N. Takeda and M. Ishikawa, J. Phys. Soc. Jpn. 69, 868 (2000).
- (18) K. Abe, H. Sato, T. D. Matsuda, T. Namiki, H. Sugawara, and Y. Aoki, J. Phys.: Condens. Matter 14, 11757 (2002).
- (19) M. Yogi, H. Kotegawa, Y. Imamura, G. q. Zheng, Y. Kitaoka, H. Sugawara, and H. Sato, cond-mat/0303569, (2003).
- (20) D. J. Braun and W. Jeitschko, J. Less-Common Met. 72, 147 (1980).
- (21) V. S. Zapf, R. P. Dickey, E. J. Freeman, C. Sirvent, and M. B. Maple, Phys. Rev. B 65, 024437 (2001).
- (22) P. G. Pagliuso, R. Movshovich, A. D. Bianchi, M. Nicklas, N. O. Moreno, J. D. Thompson, M. F. Hundley, J. L. Sarrao, and Z. Fisk, Physica B 312-313, 129 (2002).
- (23) R. Movshovich, A. Bianchi, M. Jaime, M. F. Hundley, J. D. Thompson, N. Curro, P. C. Hammel, Z. Fisk, P. G. Pagliuso, and J. L. Sarrao, Physica B 312-313, 7 (2002).
- (24) K. R. Lea, M. J. M. Leask, and W. P. Wolf, J. Phys. Chem. Solids 23, 1381 (1962).


| RRR | Sb | |||||||||||
|---|---|---|---|---|---|---|---|---|---|---|---|---|
| ( cm) | ( cm) | ground state | (K) | g.s. | (K) | (K) | ||||||
| 0 | 155 | 1.67 | 93 | 25. | 0 | 10.1 | 0.500 | 1.99 | 5.87 | — | ||
| 0.05 | 235 | 18.7 | 13 | 15. | 1 | 12.1 | 0.484 | 1.47 | 7.08 | — | ||
| 0.1 | 259 | 46.0 | 5.6 | 21. | 3 | 15.9 | 0.462 | 1.31 | 9.54 | — | ||
| 0.15 | 215 | 27.0 | 8.0 | 15. | 6 | 14.9 | 0.452 | 1.11 | 9.43 | — | ||
| 0.2 | 510 | 54.0 | 9.4 | 27. | 3 | 16.6 | — | — | — | — | ||
| 0.3 | — | — | — | 8. | 0 | 25.5 | — | — | — | — | ||
| 0.4 | 343 | 58.2 | 5.9 | 20. | 2 | 25.2 | — | — | — | — | ||
| 0.5 | — | — | — | 4. | 9 | 34.2 | — | — | — | — | ||
| 0.6 | 305 | 67.4 | 4.5 | 6. | 6 | 40.3 | — | — | — | — | ||
| 0.7 | 166 | 34.8 | 4.8 | 10. | 1 | 40.4 | — | — | — | — | ||
| 0.75 | — | — | — | 17. | 2 | 42.8 | — | — | — | — | ||
| 0.85 | — | — | — | 6. | 3 | 46.4 | 2.70 | — | 87.4 | |||
| 0.9 | 330 | 42.4 | 7.8 | 11. | 9 | 47.7 | 3.43 | — | 78.8 | |||
| 0.95 | — | — | — | 20. | 8 | 48.8 | 5.51 | — | 88.7 | |||
| 1 | 578 | 41.8 | 14 | 7. | 4 | 50.8 | 4.95 | — | 88.1 | |||