Specific Heat Study of the Magnetic Superconductor HoNi2B2C
Abstract
The complex magnetic transitions and superconductivity of HoNi2B2C were studied via the dependence of the heat capacity on temperature and in-plane field angle. We provide an extended, comprehensive magnetic phase diagram for and based on the thermodynamic measurements. Three magnetic transitions and the superconducting transition were clearly observed. The 5.2 K transition () shows a hysteresis with temperature, indicating the first order nature of the transition at T. The 6 K transition (), namely the onset of the long-range ordering, displays a dramatic in-plane anisotropy: increases with increasing magnetic field for while it decreases with increasing field for . The anomalous anisotropy in indicates that the transition is related to the a-axis spiral structure. The 5.5 K transition () shows similar behavior to the 5.2 K transition, i.e., a small in-plane anisotropy and scaling with Ising model. This last transition is ascribed to the change from dominant phase to dominant phase.
I Introduction
An understanding of the interplay between magnetism and superconductivity has been an area of intensive research because of their seemingly antagonistic tendencies.Fischer (1990); Bulaevskii et al. (1985) The limited availability of suitable examples and the low magnetic transition temperatures of those that exist have made the studies very difficult experimentally. The recently found RNi2B2C family where R is rare-earth element offered a new venue because the magnetic transitions () occur in an easily accessible temperature range with a variation of ranging from 1.75 for Dy to 0.14 for Tm. Further, high-quality single crystals have become available. Among the magnetic members, HoNi2B2C is particularly interesting because its complex magnetic phases are observed to coexist with superconductivity. Neutron scattering revealed three types of magnetic order.Goldman et al. (1994); Grigereit et al. (1994); Kreyssig et al. (1997) A commensurate antiferromagnetic structure is formed with , i.e. (0 0 1) below 6 K in which the spins order ferromagnetically within the plane and antiferromagnetically along the axis. Two incommensurate structures coexist over a finite temperature range, i.e., 5 K K: the structure with where the ferromagnetically aligned spins are rotated by and the structure with for which the detailed structure is still unknown.
HoNi2B2C exhibits a near-reentrant superconductivity, i.e., reentrant resistive behavior in a small magnetic field, due to competition between superconductivity and exchange-coupled antiferromagnetic order.Eisaki et al. (1994) In a theoretical analysis of the interplay, the onset of the axis incommensurate state has been shown to suppress superconductivity, leading to the near-reentrant behavior.Amici and Thalmeier (1998); Amici et al. (2000) Kreyssig et al., however, found that in Y-doped quasi-quartenary compound, Ho1-xYxNi2B2C, only the incommensurate axis feature remains in the same temperature range as the near-reentrant behavior while the axis spiral structure exists over a much wider temperature range, indicating that it is the -structure connected with Fermi surface nesting that enhances the pair-breaking effect.Kreyssig et al. (1997) For a further understanding of the interplay, it is necessary to study the nature of the magnetic transitions and to establish the phase diagram of HoNi2B2C.
The magnetic phase diagram of HoNi2B2C has been studied extensively in the context of the interplay between magnetism and superconductivity, mostly below T.du Mar et al. (1996) Zero-field specific heatCanfield et al. (1994) and other surface sensitive measurementsRathnayaka et al. (1996); El-Hagary et al. (1998) indicate that there are three magnetic transitions (, , ), while other specific heat dataLin et al. (1995); Choi et al. (2001) show only two transitions (, ), where K is the Neel temperature, K is the onset of a long-range magnetic ordering, and K is ascribed to some change of the oscillatory magnetic state. It has been suggested that the low temperature physical properties of polycrystalline HoNi2B2C depend on thermal treatment as well as chemical composition while the properties of single crystals are relatively less affected.Dertinger et al. (2001); Wagner et al. (1999) Even though majority of measurements indicate the presence of at 5.5 K, thermodynamic measurements on single crystals that show the magnetic transition to be a truly bulk property are rare.
In this paper, we report specific heat measurements of single crystal HoNi2B2C as a function of temperature and magnetic field to provide an extended (up to 6 T), comprehensive magnetic phase diagram for and . Three magnetic transitions are clearly resolved, confirming that is a bulk magnetic transition. The 5.2 K transition () shows hysteresis with temperature, indicating a first order antiferromagnetic transition. The 6 K transition (), namely the onset of long-range order, displays a dramatic in-plane anisotropy: increases with increasing magnetic field for while it decreases with increasing field for . The anomalous anisotropy in indicates that the transition is related to the -axis spiral structure. The 5.5 K transition () shows a small in-plane anisotropy and was ascribed to the transition from -dominant phase to dominant phase. The specific heat jump related to the superconducting transition was observed at 8 K.
II Superconductivity
We have used two single crystals of HoNi2B2C, labeled sample A and sample B for the heat capacity measurements. Both samples were from a same batch. A high temperature flux method was used to grow the sample using Ni2B as a solvent. The details are described elsewhere.Cho et al. (1995)
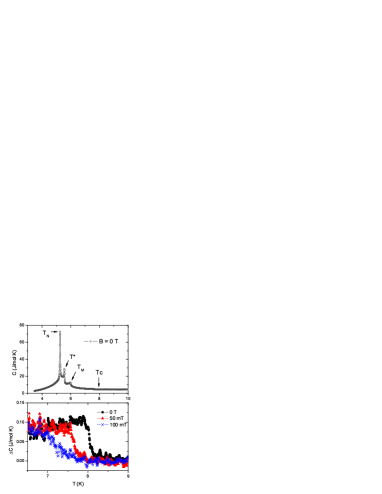
The heat capacity measured by ac calorimetry Park et al. (2002) was converted to absolute values using literature data.Lin et al. (1995) The upper panel of Fig. 1 shows the specific heat of HoNi2B2C vs. temperature at zero field. The three sharp peaks mark the magnetic transitions noted above. The first transition at 6 K is marked as , the second at 5.5 K, as , and the third at, 5.2 K as . There is also a specific heat discontinuity around 8 K related to superconducting transition but it is too small to be seen on the same scale.
The bottom panel shows the specific heat discontinuity related to the superconducting transition in the vicinity of . The circles describe the specific heat difference, , for T, the triangles for mT, and the crosses for mT, where is the specific heat in normal state. Data taken at 0.2 T were used as the normal state background between 7 K and 9 K because the magnetic contribution is unaffected at low fields and the superconductivity is suppressed in that temperature range. In zero field, the transition from normal to superconducting state occurs at 8.04 K with a narrow transition width (). The transition temperature was defined as the midpoint of the transition, which is essentially equal to that found from entropy-conserving method. As the magnetic field increases, the decreases at the rate -8.3 K/T and the transition width becomes broadened.
The specific heat jump in zero field is about 110 mJ/molK. If we use the BCS relation , we obtain mJ/mol K2, small compared to that of non-magnetic counterpart, i.e. 18 mJ/molK2 for Lu(Y)Ni2B2C, possibly indicating a lower density of states, , in HoNi2B2C.Carter et al. (1995) A spectroscopic study, however, found that the density of states hardly changes within the borocarbide series (RNi2B2C).Pellegrin et al. (1995) Recently, El-Hagary et al. found a common correlation between the specific heat jump and the transition temperature among magnetic borocarbide superconductors, i.e., ,El-Hagary et al. (2000) which indicates the importance of the magnetic pair breaking. According to Abrikosov-Gor’kov theory (AG), the exchange interaction between electrons and magnetic impurity atoms leads to nonconservation of the electron spin, affecting the formation of Cooper pairs. Assuming mJ/molK2 (same as that of Y or Lu based borocarbide)Michor et al. (1995), the ratio becomes 0.76. If we assume a 50 % suppression of from the nonmagnetic value of 16 K, the corresponding AG prediction is .
It can be speculated that the origin of the small specific heat discontinuity results from anisotropic superconductivity or a multi-band superconductivity as is the case for the two-gap superconductor MgB2.Haas and Maki (2001); Mishonov and Penev (2002); Bouquet et al. (2002); Park et al. (2002); Yang et al. (2001) Indeed, there is compelling evidence that the non-magnetic members of the borocarbides, Lu(Y)Ni2B2C, are highly anisotropic or probably nodal superconductors where there exist gap zeros on the Fermi surface.Nohara et al. (1997); Boaknin et al. (2001); Park et al. (2003) The positive curvature in the upper critical field of Lu(Y)Ni2B2C close to and the temperature dependence of were successfully explained by using an effective two-band model.Shulga et al. (1998) However, the gap anisotropy or multi-band feature is probably irrelevant to the anomalous value of in HoNi2B2C because the reported thermodynamic ratio () of LuNi2B2CNohara et al. (1997) is much larger than the weak-coupling BCS value (=1.43) as well as that of HoNi2B2C ().
III Magnetic phase transitions
III.1 Magnetic transition at 5.2 K ()
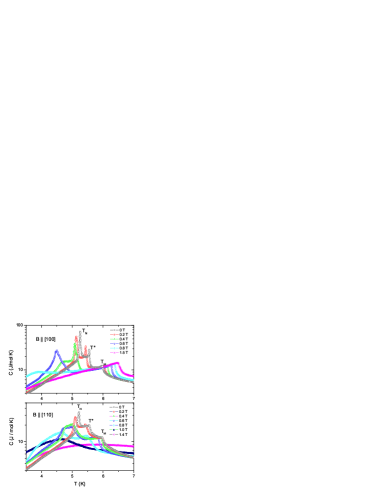
The top panel of Fig. 2 shows a semi-log plot of the specific heat of HoNi2B2C (sample A) as a function of temperature at several magnetic fields . The bottom panel of Fig. 2 describes the specific heat of sample B for . The -axis commensurate antiferromagnetic (AF) transition, labeled , is lowered with increasing field for both field directions. When field is higher than 0.4 T, the AF peak becomes severely broadened, making the data difficult to interpret. The top panel of Fig. 3 shows the phase diagram for this transition to a Néel state. The critical temperatures from vs. in constant fields (squares) and the critical fields from the isothermal vs. at constant temperatures (circles; see Figs. 4 and 5) were plotted for both field directions. There is negligible in-plane anisotropy between [100] and [110] directions. The dashed line is the least-squares fit of in the vicinity of , showing Ising-like behavior. Fisher (1960); Keen et al. (1966) Experimental data were explained well with T.
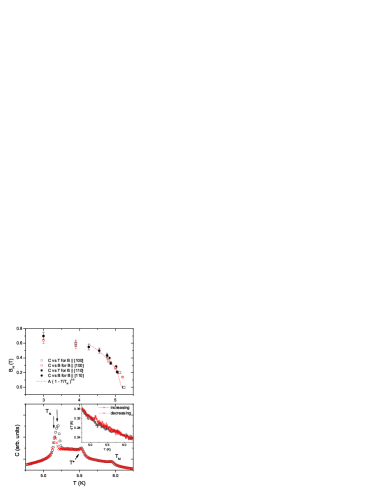
The bottom panel of Fig. 3 shows the hysteresis of the specific heat of sample B as a function of temperature. The circles describe the data with increasing temperature while the crosses, with decreasing temperature. There is no hysteresis in either the 6 K transition nor the 5.5 K transition . In the AF transition, however, there is a clear hysteresis where the AF peak was moved from 5.21 K with increasing temperature to 5.16 K with decreasing temperature. The inset of the bottom panel shows the temperature offset of the sample as a function of temperature. Depending on the direction of the temperature sweep, there occurs a sudden jump (or drop) in the dc offset at , a consequence of the latent heat associated with the transition. The rectangle-shaped hysteresis adds additional strong evidence that the transition is first order. This finding is consistent with the observation of magnetoelastic effects in HoNi2B2C, where the length of the unit cell in [110] direction is shortened by about 0.19 % compared to its length in direction below .Kreyssig et al. (1999) Despite the square-root behavior evident in Fig. 3, the first-order nature of the magnetic AF transition disagrees with the Ising model.Fisher (1960) We note that the peak intensity is smaller for the specific heat with decreasing temperature. That could be an artifact from ac calorimetry because the temperature response of the sample is not an ideal triangular shape, rather a distorted one when it goes through a phase transition with latent heat.Garnier (1972)

III.2 The 5.5 K magnetic transition ()
The 5.5 K magnetic transition () is as sharp as the AF transition, for sample A at least, indicating it could also be a first order phase transition (see Fig. 2). The magnetic field dependence of the specific heat is also similar to the counterpart, i.e. the critical temperature decreases with increasing magnetic field. Initially, the peak intensity at becomes stronger with increasing field while that of the AF transition decreases monotonically, transferring some of its entropy to the transition. Fig. 6 shows the phase diagram both for (open) and (solid), where is the critical field corresponding to the transition. The in-plane anisotropy between [100] and [110] directions is small, similar to the transition. The temperature dependence near was explored in terms of the antiferromagnetic theory by Fisher,Fisher (1960) as was done in the transition. The suppression of the critical temperature was explained reasonably well by with T (dashed line), a value similar to that of the analysis.
What could be responsible for the 5.5 K transition? Neutron scattering showed that all three magnetic structures, i.e. -axis commensurate AF magnetic structure, -axis AF helical structure, and -axis incommensurate structure, coexist between 5 K and 6 K.Lynn et al. (1997); Goldman et al. (1994) In the previous section, we argued that the 5.2 K transition is due to the magnetic transition to the -axis commensurate AF structure () and is a first order phase transition. All the similarities between the 5.5 K transition and the 5.2 K transition point toward associating with the -axis incommensurate AF structure. Then, the next question is “Is it a first order phase transition?” The specific heat at zero field did not show any noticeable hysteresis with temperature at (see Fig. 3). In the dc temperature offset (see the inset of Fig. 3), however, there may be a small hysteresis at , but the feature is well within the scattered data. Coexistence of the phases also suggests that it is 1st order. At this point, it is not clear if the 5.5 K magnetic transition is a first order phase transition or not.
III.3 The 6 K magnetic transition ()
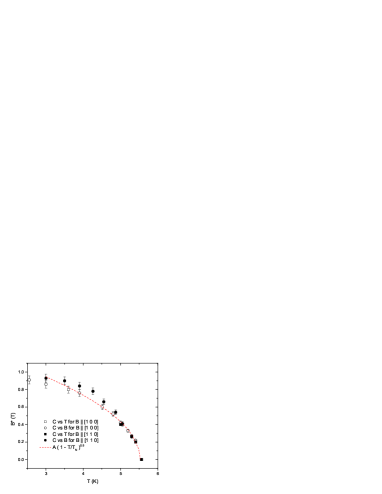
The 6 K magnetic transition () is known to be the onset of a long-range magnetic order. The precise nature of the transition is not well characterized, although recent work Detlefs et al. (2000) argues that it represents the onset of the modulated phase. In this section, we present the specific heat as a function of temperature both for and directions and confirm that the 6 K transition is due to the onset of the -axis incommensurate magnetic structure.
Fig. 2 shows a dramatic difference in the critical temperature with magnetic field directions. For , the critical temperature scarcely changes with increasing magnetic field below 0.5 T in agreement with Detlefs et al. Detlefs et al. (2000) and Du Mar, et al.du Mar et al. (1996) In higher fields, it decreases rapidly as is expected for an antiferromagnetic transition and the transition shape becomes broadened, making it hard to interpret. For , the critical temperature increases with increasing magnetic fielddu Mar et al. (1996) while keeping its transition shape. The anomalous in-plane anisotropy of strongly suggests that the origin of this transition is very different from the other two magnetic transitions (, ) and is, therefore, due to the onset of the axis incommensurate magnetic structure. Detlefs et al.Detlefs et al. (2000) recently hypothesized that the magnetic structure is related to the Fermi surface (FS) nesting along [100] direction. Since a distortion along [110] direction is more disruptive to the nesting feature than a distortion along [100] direction, it results in the absence of the phase for HoNi2B2C and DyNi2B2C at low temperature and low magnetic field where local magnetic moments are aligned along [110] directions. If the phase is the ground state for 5.5 K 6.0 K in HoNi2B2C, a magnetic field applied along [110] will disrupt the magnetic phase while the field along [100] will not. The anomalous magnetic field dependence of specific heat is consistent with this scenario. The enhancement of the phase for , however, is beyond this explanation.

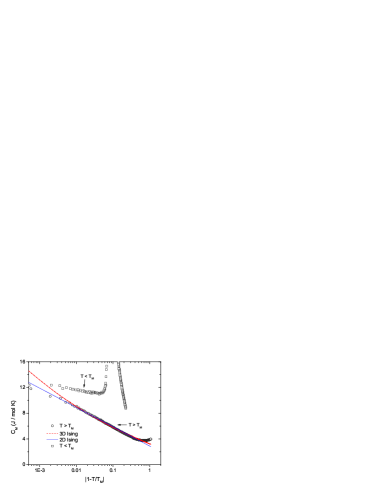
The top panel of Fig. 7 shows the specific heat data around in several constant magnetic fields from 0 T to 1.5 T for . For clarity, selective data are shown in the bottom panel, where -axis is the reduced temperature and -axis is the specific heat divided by the specific heat at , i.e. . All of them collapse onto each other, showing a scaling behavior. The specific heat near a critical point diverges logarithmically in the two-dimensional Ising model while it diverges more strongly, as a power law in the three-dimensional Ising model.Kadanoff et al. (1967) Fig. 8 describes the zero-field magnetic specific heat as a function of the reduced temperature on a semi-log scale. The magnetic specific heat was obtained by subtracting the lattice and electronic contributions: where we used and values of TmNi2B2C.Movshovich et al. (1994) The higher temperature side of was analyzed in terms of 2D and 3D Ising model. The dashed line is the best fit of 3D Ising model with a functional form of . The solid line is from 2D Ising model of . Both 2D and 3D Ising models can explain the data over two decades of temperature range, i.e. . When temperature is close enough to K, however, the specific heat data can be explained better with the logarithmic function than the power-law dependence. The logarithmic singularity may be interpreted as a manifestation of two-dimensional spin structure in HoNi2B2C where the Ho3+ local moment is confined to the Ho-C basal plane for temperatures below 100 K.Lynn et al. (1997) We note that the value of the coefficient of the logarithmic term, J/mol K, is of the order of magnitude found in the exact theory of 2D Ising antiferromagnets.Onsager (1944) The lower temperature side of is severely contaminated by the adjacent magnetic transition , rendering analysis difficult.
III.4 Magnetic phase diagram
It has long been known that there is an extreme magnetic anisotropy associated with the crystalline electric field (CEF) splitting of the Hund’s rule ground state for the magnetic members of the borocarbide family RNi2B2C (R=Er, Tb, Ho, Dy).Cho et al. (1995, 1996) The R3+ local moment is confined to the R-C basal plane for temperatures below roughly 100 K, i.e. temperatures well above the magnetic ordering temperatures. In addition, a strong in-plane anisotropy has been observed, leading to the local moments essentially being confined to either the [100] (R = Er, Tb) or [110] (R = Ho, Dy).Canfield et al. (1997) Therefore, it became necessary to study physical properties as a function of magnetic field direction.
Fig. 9 summarizes the magnetic phase diagram of HoNi2B2C both for (upper panel) and for (lower panel) directions based on specific heat as a function of temperature and magnetic field. The 5.2 K transition, , is due to the commensurate axis AF structure and found to be a first order phase transition. The critical field (triangles) shows little in-plane anisotropy. The 5.5 K transition, , is due to the -axis oscillatory magnetic structure. The in-plane anisotropy of (circles) is small and the nature of the transition is still controversial. The 6 K transition, , is ascribed to the onset of the -axis oscillatory magnetic structure. The in-plane anisotropy of (squares) is very surprising: the critical temperature decreases with increasing magnetic field for while it increases, for . The critical temperature initially increases with magnetic field at a rate of 0.48 K/T, then it starts to bend around at about 1.5 T and decreases (see the inset of the bottom panel of Fig. 9). The decrease of the critical temperature is expected for antiferromagnet.Fisher (1960) The increase, however, is difficult to understand.

The magnetic phase diagram built from specific heat data is consistent with the viewpoint of three distinct magnetic transitions between at zero field.du Mar et al. (1996); Rathnayaka et al. (1996) At low fields, the critical temperature scarcely changes with magnetic field for in agreement with Du Mar et al.du Mar et al. (1996) while the increase of for is more evident, probably due to high-quality sigle crystal used in this study. In the high-field regime, our data show a dramatic difference in between the two field directions, i.e., and as is evident in Fig. 9 while previous studies drew a conclusion of similar behavior between the two directions. For , Ref 9 shows only two transitions below 5 K, i.e., and . In contrast, our data clearly show three transitions at the same temperature range. A close examination reveals that the marked transition below 5 K in Ref 9 corresponds to in our phase diagram, indicating that the real transition is missing in that phase diagram.
There has been a speculation of a fourth magnetic phase based on resistance measurements where there occurs a slope change at 3.8 K for .Rathnayaka et al. (1996) In our bulk measurement, the additional feature was not observed, suggesting that the 3.8 K feature is an extrinsic property sensitive to the surface state. Instead, we found an additional phase line for , most readily seen as a shoulder in the 4.8 K and 5.0 K data in Fig. 5. It separates the and the lines and is merged to at 4 K (crosses in the upper panel of Fig. 9). The origin of this feature has yet to be elucidated.
IV Magnetic field-angle heat capacity
In non-magnetic borocarbides, the low temperature heat capacity directly measures the electronic density of states.Park et al. (2003) In magnetic systems, however, the magnetic specific heat dominates. For example, the electronic and lattice components of the specific heat account for less than 5% of the total below 8 K in HoNi2B2C. Consequently, in HoNi2B2C, the field-angle dependent heat capacity used to investigate the superconducting gap nature in the non-magnetic systems, here mainly explores the magnetic structure. In this section, we present the in-plane field-angle heat capacity of the Ho-based borocarbide and discuss the data based on the phase diagram built in the previous sections.
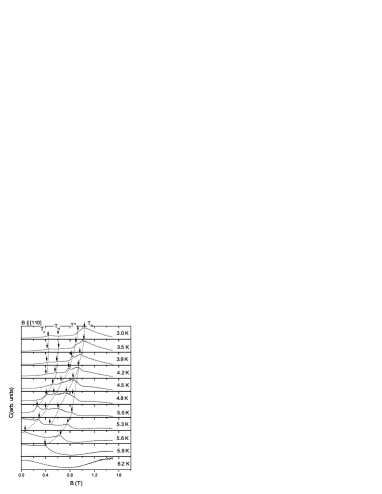
Fig. 10 shows the low-field heat capacity vs field angle measured with respect to the axis of HoNi2B2C at several different temperatures. The periodicity of the peaks is 90 degrees at all temperatures, indicating that the peak in the specific heat is simply due to the in-plane anisotropy between [100] and [110] directions. Canfield et al. observed magnetization modulation as a function of magnetic field angle at 2 K.Canfield et al. (1997) The oscillation feature was then interpreted in terms of metamagnetic states, i.e., for , for , for and for . Here the arrow is a moment along the [110] axis, is a moment along the , and is a moment along the axis. In our magnetic phase diagram (Fig. 9), corresponds to , to , and to respectively.
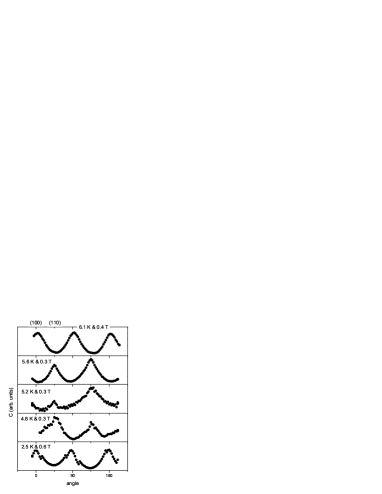
At 2.5 and 6.1 K, the low-field heat capacity has maxima for the field along directions. The area under the field-angle heat capacity is proportional to magnetic entropy change, indicating that there is more magnetic disorder for the field along than along . The field-angle entropy modulation can be explained by the fact that the net moment of Ho3+ ions is directed along directions in the commensurate antiferromagnetic phase.Lynn et al. (1997) At 4.8, 5.2, and 5.6 K where helical magnetic phases appear, the peak positions shifted by 45∘ to directions, indicating that the magnetic moments are preferably aligned along directions. The peak intensities are also asymmetric with field angle, which may be related to the oscillatory magnetic structures observedGoldman et al. (1994); Grigereit et al. (1994); Kreyssig et al. (1997) in this temperature range.
Fig. 11 shows the field-angle heat capacity at 6.1 K in 0.5, 1, 2, and 4 T. According to the magnetic phase diagram of HoNi2B2C (see Fig. 9), the heat capacity should exhibit monotonic 4-fold angular oscillation at high fields because there is no transition other than the transition nearby this temperature. The peaks along [100] at 0.5 T, however, were split into two peaks at 1 T and the minima along [110] were totally flattened out. At 2 T, the distance between the two split peaks becomes narrower and the flat minima become broad maxima. In 4 T, the split peaks merge and show a delta function like peak and the broad maxima at [110] in 2 T returns to a broad minima as was in 0.5 T. Two satellite peaks appear at of [100] peaks.
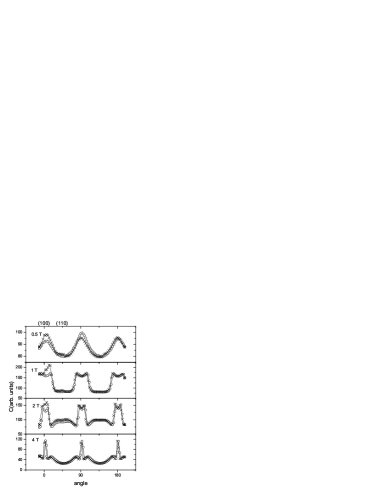
The seemingly anomalous peak splittings along [100] may be explained as following. In 1 T, moves from 3.7 K for to 6.5 K for or where is the in-plane field angle measured against the -axis. To move the through 6.1 K means a field angle of 0.4 K/0.031 Kdeg, which is consistent with the peak positions at . At 2 T, the moves from 0 K for to 6.57 K for , predicting 6.3∘ of peak splitting. Experimentally, the observed splitting was . The larger the field, the faster the peak has to move in angle. Even though the anomalous peak splitting could be accounted for in terms of a simple linear relation between and field angle , the interchange between minima and maxima at [110] and the satellite peaks in 4 T have yet to be understood, suggesting that the magnetic phase in high fields is not as simple as was originally envisaged.
In Fig. 11, the circles describe the data when the in-plane magnetic field was rotated clockwise and the crosses, when the field was rotated counterclockwise. In this measurement, the angle spacing between two data points is . At 0.5 T, the two data sets do not show hysteresis in phase, but show hysteresis in amplitude with field direction. Above 1 T, there is a systematic shift in phase by with field direction, indicating that the related transition may be a first order magnetic transition. The experimental error bar in determining the field angle is , which is less than that of the angle shift in peak positions. The hysteresis with field-angle direction may be another manifestation of the first order nature of the metamagnetic transition from to phases, which were observed in neutron-diffraction study by Campbell et al.Campbell et al. (2000)
V Summary
We have studied the magnetic superconductor HoNi2B2C via specific heat as a function of temperature, magnetic field, and magnetic field angle. The small value of the specific heat discontinuity at indicates that Ho3+ ions act as pair breakers as was predicted in Abrikosov-Gor’kov theory. The temperature hysteresis of the zero-field specific heat at provides direct evidence that the magnetic AF transition is of first order, accompanying a change from tetragonal to orthorhombic structure. The similarity of transition to the transition indicates that it is due to the spiral structure. The anomalous in-plane anisotropy of transition was explained in terms of the Fermi surface nesting feature.
This work at Urbana is supported by NSF DMR 99-72087. And the work at Pohang was supported by the Ministry of Science and Technology of Korea through the Creative Research Initiative Program. X-ray measurements were carried out in the Center for Microanalysis of Materials, University of Illinois, which is partially supported by the U.S Department of Energy under grant DEFG02-91-ER45439. T. Park acknowledges benefits from the discussion with Dr. J. D. Thompson.
References
- Fischer (1990) O. Fischer, Ferromagnetic Materials (North-Holland, Amesterdam, 1990), pp. 465–548.
- Bulaevskii et al. (1985) L. N. Bulaevskii, A. I. Buzdin, M. L. Kulic, and S. V. Panjukov, Adv. Phys. 34, 175 (1985).
- Goldman et al. (1994) A. I. Goldman, C. Stassis, P. C. Canfield, J. Zarestky, P. Dervenagas, B. K. Cho, D. C. Johnston, and B. Sternlieb, Phys. Rev. B 50, 9668 (1994).
- Grigereit et al. (1994) T. E. Grigereit, J. W. Lynn, Q. Huang, A. Santoro, R. J. Cava, J. J. Krajewski, and J. W. F. Peck, Phys. Rev. Lett. 73, 2756 (1994).
- Kreyssig et al. (1997) A. Kreyssig, M. Loewenhaupt, K. H. Muller, G. Fuchs, A. Handstein, and C. Ritter, Physica B 234, 737 (1997).
- Eisaki et al. (1994) H. Eisaki, H. Takagi, R. J. Cava, B. Batlogg, J. J. Krajewski, J. W. F. Peck, K. Mizuhashi, J. O. Lee, and S. Uchida, Phys. Rev. B 50, 647 (1994).
- Amici and Thalmeier (1998) A. Amici and P. Thalmeier, Phys. Rev. B 57, 10684 (1998).
- Amici et al. (2000) A. Amici, P. Thalmeier, and P. Fulde, Phys. Rev. Lett. 84, 1800 (2000).
- du Mar et al. (1996) A. C. du Mar, K. D. D. Rathnayaka, D. G. Naugle, P. C. Canfield, and B. K. Cho, Czech. J. Phys. 46, 843 (1996), references therein.
- Canfield et al. (1994) P. C. Canfield, B. K. Cho, D. C. Johnston, and D. K. Finnemore, Physica C 230, 397 (1994).
- Rathnayaka et al. (1996) K. D. D. Rathnayaka, D. G. Naugle, B. K. Cho, and P. C. Canfield, Phys. Rev. B 53, 5688 (1996).
- El-Hagary et al. (1998) M. El-Hagary, H. Michor, C. Jambrich, R. Hauser, M. Galli, E. Bauer, and G. Hilscher, J. Magn. Magn. Mater. 177, 551 (1998).
- Lin et al. (1995) M. S. Lin, J. H. Shieh, Y. B. You, W. Y. Guan, H. C. Ku, H. D. Yang, and J. C. Ho, Phys. Rev. B 52, 1181 (1995).
- Choi et al. (2001) J. H. Choi, H. Doh, E. M. Choi, H. J. Kim, and S. I. Lee, J. Phys. Soc. J 70, 3037 (2001).
- Dertinger et al. (2001) A. Dertinger, R. E. Dinnebier, A. Kreyssig, P. W. Stephens, S. Pagola, M. Loewenhaupt, S. van Smaalen, and H. F. Braun, Phys. Rev. B 63, 184518 (2001).
- Wagner et al. (1999) T. A. Wagner, A. Dertinger, W. Ettig, A. Krause, H. Schmidt, and H. F. Braun, Physica C 323, 71 (1999).
- Cho et al. (1995) B. K. Cho, P. C. Canfield, L. L. Miller, D. C. Johnston, W. P. Beyermann, and A. Yatskar, Phys. Rev. B 52, 3684 (1995).
- Park et al. (2002) T. Park, M. B. Salamon, C. U. Jung, M.-S. Park, K. Kim, and S.-I. Lee, Phys. Rev. B 66, 134515 (2002).
- Carter et al. (1995) S. A. Carter, B. Batlogg, R. J. Cava, J. J. Krajewski, and J. W. F. Peck, Phys. Rev. B 51, 12644 (1995).
- Pellegrin et al. (1995) E. Pellegrin, C. T. Chen, G. Meigs, R. J. Cava, J. J. Krajewski, and J. W. F. Peck, Phys. Rev. B 51, 16159 (1995).
- El-Hagary et al. (2000) M. El-Hagary, H. Michor, and G. Hilscher, Phys. Rev. B 61, 11695 (2000).
- Michor et al. (1995) H. Michor, T. Holubar, C. Dusek, and G. Hilscher, Phys. Rev. B 52, 16165 (1995).
- Haas and Maki (2001) S. Haas and K. Maki, Phys. Rev. B 65, 020502 (2001).
- Mishonov and Penev (2002) T. Mishonov and E. Penev (2002), cond-mat0206118.
- Bouquet et al. (2002) F. Bouquet, Y. Wang, I. Sheikin, T. Plackowski, A. Junod, S. Lee, and S. Tajima, Phys. Rev. Lett. 89, 257001 (2002).
- Yang et al. (2001) H. D. Yang, J.-Y. Lin, H. H. Li, F. H. Hsu, C. J. Liu, S.-C. Li, R.-C. Yu, and C.-Q. Jin, Phys. Rev. Lett. 87, 167003 (2001).
- Nohara et al. (1997) M. Nohara, M. Isshiki, H. Takagi, and R. J. Cava, J. Phys. Soc. Jpn. 66, 1888 (1997).
- Boaknin et al. (2001) E. Boaknin, R. W. Hill, C. Proust, C. Lupien, and L. Taillefer, Phys. Rev. Lett. 87, 237001 (2001).
- Park et al. (2003) T. Park, M. B. Salamon, E. M. Choi, H. J. Kim, and S.-I. Lee, Phys. Rev. Lett. 90, 177001 (2003).
- Shulga et al. (1998) S. V. Shulga, S. L. Drechsler, G. Fuchs, K. H. Muller, K. Winzer, M. Heinecke, and K.Krug, Phys. Rev. Lett. 80, 1730 (1998).
- Fisher (1960) M. E. Fisher, Proc. Roy. Soc. (London) A254, 66 (1960).
- Keen et al. (1966) B. E. Keen, D. Landau, B. Schneider, and W. P. Wolf, J. Appl. Phys. 37, 1120 (1966).
- Kreyssig et al. (1999) A. Kreyssig, M.Loewenhaupt, J. Freudenberger, K. H. Muller, and C. Ritter, J. Appl. Phys. 85, 6058 (1999).
- Garnier (1972) P. R. Garnier, Ph.D. thesis, University of Illinois at Urbana-Champaign, Illinois (1972).
- Lynn et al. (1997) J. W. Lynn, S. Skanthakumar, Q. Huang, S. K. Sinha, Z. Hossain, L. C. Gupta, R. Nagrajan, and C. Godart, Phyr. Rev. B 55, 6584 (1997).
- Detlefs et al. (2000) C. Detlefs, F. Bourdarot, P. Burlet, P. Dervenagas, S. L. Bud’ko, and P. C. Canfield, Phys. Rev. B 61, R14916 (2000).
- Kadanoff et al. (1967) L. P. Kadanoff, W. Gotze, D. Hamblen, R. Hecht, E. A. S. Lewis, V. V. Palciauskas, M. Rayl, J. Swift, D. Aspnes, and J. Kane, Rev. Mod. Phys. 39, 395 (1967).
- Movshovich et al. (1994) R. Movshovich, M. F. Hundley, J. D. Thompson, P. C. Canfield, B. K. Cho, and A. V. Chubukov, Physica C 227, 381 (1994).
- Onsager (1944) L. Onsager, Phys. Rev. 65, 117 (1944).
- Cho et al. (1996) B. K. Cho, P. C. Canfield, and D. C. Johnston, Phys. Rev. B 53, 8499 (1996).
- Canfield et al. (1997) P. C. Canfield, S. L. Bud’ko, B. K. Cho, A. Lacerda, D. Farrel, E. Johnston-Halperin, V. A. Kalatsky, and V. L. Pokrovsky, Phys. Rev. B 55, 970 (1997).
- Campbell et al. (2000) A. J. Campbell, D. M. Paul, and G. J. McIntyre, Phys. Rev. B 61, 5872 (2000).