O adsorption and incipient oxidation of the Mg(0001) surface
Abstract
First principles density functional calculations are used to study the early oxidation stages of the Mg(0001) surface for oxygen coverages monolayers. It is found that at very low coverages O is incorporated below the topmost Mg layer in tetrahedral sites. At higher oxygen-load the binding in on-surface sites is increased but at one monolayer coverage the on-surface binding is still about 60 meV weaker than for subsurface sites. The subsurface octahedral sites are found to be unfavorable compared to subsurface tetrahedral sites and to on-surface sites. At higher coverages oxygen adsorbs both under the surface and up. Our calculations predict island formation and clustering of incorporated and adsorbed oxygen in agreement with previous calculations. The calculated configurations are compared with the angle-scanned x-ray photoelectron diffraction experiment to determine the geometrical structure of the oxidized Mg(0001) surface.
pacs:
81.65.Mq, 68.43.-h, 61.14.QpI INTRODUCTION
The process of oxidation of metal surfaces is of considerable fundamental scientific interest as well of paramount technological importance.classical_oxide_ref Corrosion and passivation are just two examples of either destructive or useful processes linked directly to this phenomenon, which are well-known from everyday life. Oxidation of metal surfaces begins with dissociative chemisorption of oxygen on a clean surface and is followed by the formation of a film of metal oxide. In-between these events there are many elementary processes. The study of Al and Mg oxidation is particularly important because Al and Mg belong to the group of so-called simple metals and are considered model systems for studies of oxidation of transition metals. Both metals exhibit high reactivity with oxygen and oxidize rapidly. Aluminum oxides (alumina) form several different phases where the structure of some of them was only recently identified by combined ab initio density functional theory (DFT) and experimental studies.Yourd99 Magnesium oxide is known to eventually form crystals of the rock-salt structure,Nog but can also experience complex reconstructions at partial coverages.Else01 ; Goon02 Both Mg and Al oxides play an important role in catalyst support and find many other useful applications.
The number of experimentalGoon02 ; NamDG81 ; Ghi81 ; Hay81 ; FloMa82 ; Thi89 ; Cron89 ; MitOCS98 ; Dri99 ; Lac94 ; Esa97 studies and theoreticalElse01 ; Bung97 treatments devoted to the oxidation of magnesium is relatively limited compared to the more extensively studied oxidation of aluminum. In this paper we present a systematic study of the initial oxygen incorporation and island formation by first-principles theory calculations and we use the results to interpret high-quality x-ray photo-electron diffraction (XPD) measurements for low O2 doses.
The existing picture of the Mg(0001) surface oxidation processes dates back to the early 1980’s. Based on the extensive low-energy electron diffraction (LEED), Auger electron spectroscopy, electron energy loss spectroscopy, and work function measurements Namba et al. proposed NamDG81 a four-stage model consisting of: (1) dissociative oxygen chemisorption at random sites followed by oxygen incorporation, (2) assembly of incorporated oxygen atoms into islands and lateral growth, (3) oxide formation from surface Mg atoms and subsurface O atoms which starts at O2 exposures around 2–3 L (Langmuir) or 0.5–1 monolayer of total coverage, and (4) oxide thickening. Several other experimental studies provided arguments for a three-stage model of oxidation that was proposed at approximately the same time. In this model FloMa82 ; Thi89 atomic oxygen is directly incorporated into magnesium (below the top Mg layer) right after on-surface dissociation. In the next step there is simultaneous formation of an oxide layer and a decrease in the oxygen on the surface.Thi89 Finally, there is oxide thickening and transformation into a rocksalt structure.
This model of immediate incorporation of oxygen gained support from the x-ray photo-electron spectroscopy study of Ghijsen et al.,Ghi81 and particularly from the measured sharp decrease in the work function of the Mg(0001) surface upon initial O exposure.Hay81 The formation of an O-() subsurface layer up to monolayer coverage and its subsequent transformation into epitaxial oxide was also reported.Hay81 The positions of the subsurface oxygen atoms were deduced to be octahedrally coordinated where the oxygen has an environment similar to that in MgO.Thi89 This is in agreement with a more direct experimental evidence for oxygen incorporation in the octahedral interstitial sites of the first two interlayer spacings of Mg during the initial stages of magnesium oxidation,Cron89 and with later inelastic ion scattering experiments on a polycrystalline Mg surface.Lac94 ; Esa97 A very recent scanning tunneling microscopy (STM) study of the oxidation of Mg(0001) suggests that at low oxygen exposures (up to 2 L) the incorporated oxygen atoms form a single layer underneath the top layer of Mg.Goon02 The idea of immediately populated subsurface sites seems also to be supported by recent measurements by Mitrovic et al.,MitOCS98 however, they show that most of the oxygen (90%) remains over the surface and only a small fraction goes below the surface. Thus, the question regarding the most favored adsorption sites is still debated and requires further analysis.
On the theoretical side, the local density-functional theory (DFT) calculations of Bungaro et al.Bung97 show that oxygen is incorporated below the surface forming a subsurface lattice. A recent DFT-based lattice gas model studyElse01 of island formation in the early Mg(0001) oxidation stages has shown that at very low filling the oxygen atoms adsorb in the top-most subsurface (tetrahedral) B-sites in an ABAB… stacking of magnesium. At higher oxygen load also the deeper sites are filled, and the adsorbed oxygen atoms form dense clusters just below the surface and in further subsurface locations.Else01 ; Bung97 For larger clusters the oxygen-oxygen interaction effects drive the oxygen atoms further into the magnesium subsurface layers and bulk.
The rest of this paper is organized as follows. In Section II systematic DFT calculations in the range of coverages between 1/16 and 3 monolayers (ML) are presented and used for the study of the initial oxygen incorporation and island formation. The previous experimental and theory results are the starting base for our first-principles calculations of the very beginning of O adsorption and oxide formation at the Mg(0001) surface. In Section III we describe our high-quality XPD measurements for low O2 doses corresponding approximately to global coverages between 0.1 and 2 ML of atomic oxygen, and in Section IV our DFT results are used to interpret the experimental XPD data.
II THEORY
The first-principles calculations are carried out using the plane-wave density-functional dacapo codeDACAPO with the generalized gradient approximation (GGA) for the exchange-correlation energy functionalPer92 and with ultrasoft pseudopotentialsVan90 to represent the ionic cores. The clean Mg(0001) surface is modeled by periodic slabs consisting of six to seven magnesium layers separated by 21 Å of vacuum. The plane-wave basis set with 25 Ry energy cutoff is used. The O atoms are adsorbed on one side of the slab only and the electric field arising due to the asymmetry of the system is compensated for by a consistent dipole correction.NS92 ; Ben99 A mesh of Monkhorst-Pack special -points for the atom surface unit cell and a Fermi-surface smearing of 0.2 eV are applied to the Brillouin-zone integrations. For smaller cells the number of k-points are increased accordingly up to a mesh for the surface unit cell. The positions of atoms in the three to four topmost magnesium layers, and of all the oxygen atoms, are fully optimized until the sum of the Hellmann-Feynman forces on all unconstrained atoms converges to less than 0.05 eV/Å. The forces acting on the ions in the unit cell are derived from the converged charge densities, and the atom dynamics is determined using a preconditioned quasi-Newton method based on the Broyden-Fletcher-Goldfarb-Shanno algorithm.NumR
The study involves very low coverages of oxygen, from one O atom in a large surface cell up to coverages of three monolayers. We define the coverage as the ratio of the number of adsorbed atoms to the number of atoms in an ideal substrate layer. The binding energy per adsorbate is calculated relative to the energy of an isolated, spin-polarized O2 molecule and the clean, relaxed Mg-surface.
II.1 The clean Mg(0001) surface
Before studying the effect of oxygen chemisorption on the Mg(0001) surface, we determined the bulk and bare-metal-surface structures. The calculated lattice constants for hcp Mg is Å and , which agree very well with the experimental values Å and 1.623 (Ref. mglattconst, ) and other GGA calculations.WaKi01 The bulk modulus, ignoring lattice vibrations, is found to be 34.1 GPa,Ziam01 in good agreement with the measured value 35.5 GPa (obtained from the elastic constants of Ref. mgbulkmod, ) and with the GGA calculations of Ref. WaKi01, .
The relaxations of the surface interlayer spacing with respect to the bulk spacing show 1.5% expansion, 0.4% contraction, and 1.3% contraction of the first, second and third interlayer distance, respectively. The expansion of the first interlayer distance compares well with the experimentalDavHRP92 value of 1.7%, and with other GGA calculations.WaKi01 The small contraction of the second interlayer spacing disagrees with results of experiment and other calculations which predict a small expansion. Since the magnitude of this relaxation is very small this discrepancy should not have any significant effect on the results for O-adsorption. The calculated work function is 3.72 eV for the relaxed surface and agrees well with the experimental value 3.84 eV. Mich77
II.2 Low coverages () of oxygen
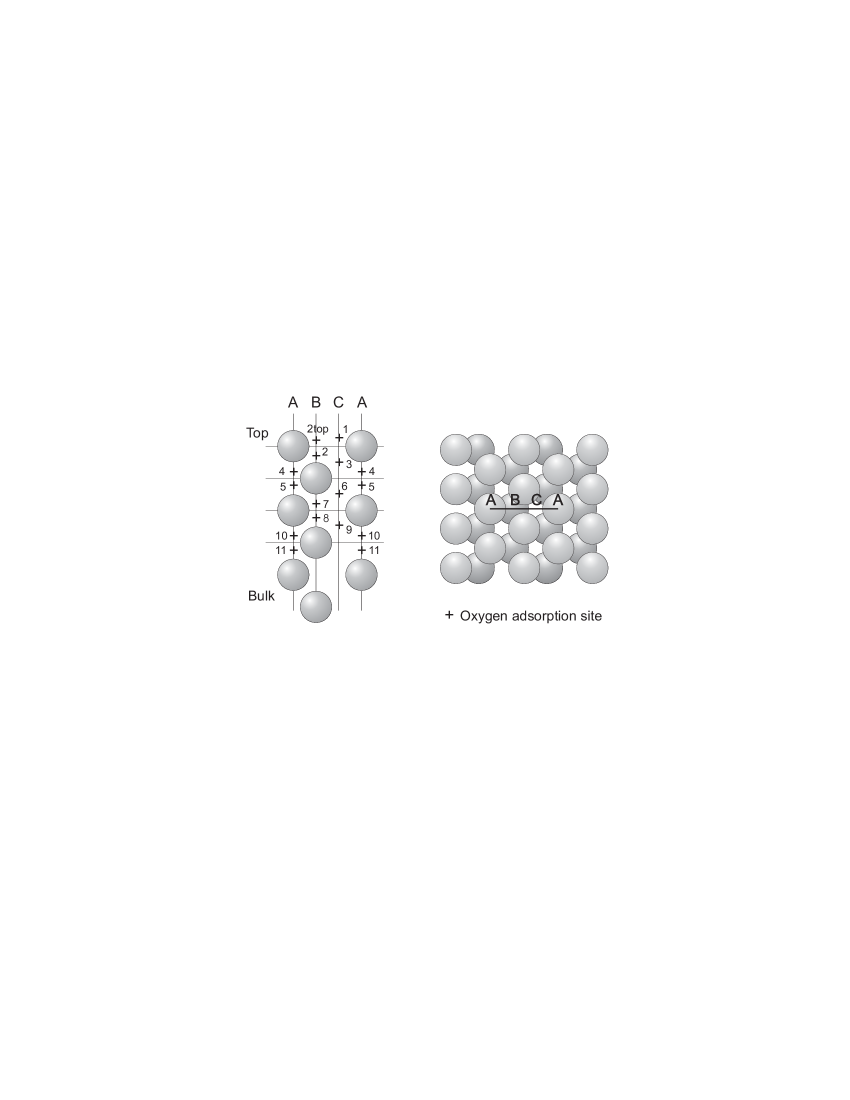
Having obtained reliable results for the clean, relaxed Mg(0001) surface we calculate the binding of oxygen in on-surface and subsurface sites. The locations of the possible adsorption sites of Mg(0001) are sketched with crosses in Fig. 1. In our calculations the results for single or nearest-neighbor pairs of O atoms adsorbed at the , , and surface cells were used as 1/16, 1/8, 1/4, and 1/2 ML coverage data.
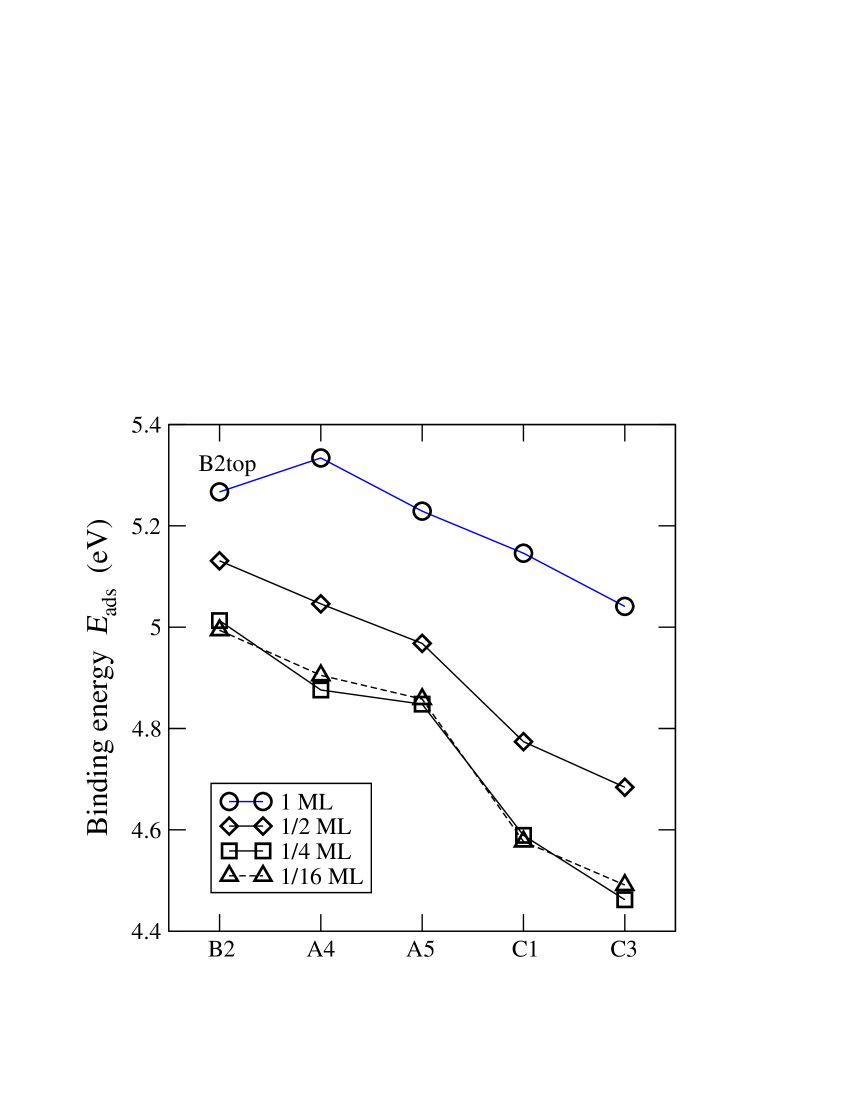
In Fig. 2 we present the calculated low-coverage binding energies with respect to the energy of an isolated O2 molecule. The adsorption of oxygen atoms on the Mg(0001) surface induces further changes to the surface structure and the electronic properties. However, the positional changes of the Mg atoms are in most cases not very large. For the supercell with a single O-atom slightly below the surface (site B2 in Fig. 1) or in first-sublayer adsorption sites (sites A4 or A5) the Mg atoms move less than 3% vertically and 0.6% laterally from their clean-surface positions. To estimate the sensitivity of the binding energy to positional relaxations of the atoms we also calculated an even distribution of four oxygen atoms in one of the tetrahedral subsurface sites (sketched as site B2 in Fig. 1) in the system, and compared the binding energy to the binding energy of one site-B2 atom in the system. The two configurations relax to slightly different atomic positions (but both converged within the force requirement) and we found the difference in binding energy per oxygen atom to be 5 meV. We therefore estimate the relaxation-imposed inaccuracy of the binding energies to be approximately 5 meV.
On-surface adsorption. It has previously been suggested that for low coverages the O atoms are preferentially adsorbed into on-surface sites,MitOCS98 as is the case for, e.g., oxygen adsorption on Al(111),KiLu01 or that on-surface adsorption sites exist although having lower binding energies than the lower-lying adsorption sites.Bung97 For the Al(111) surface an additional O is incorporated only when 1 ML of on-surface O is complete.KiLu01 A similar situation is found for a transition metal, the Ru(0001) surface.Reuter For this reason on-surface adsorption was closely studied. In summary, however, we find the initial oxygen adsorption to be a subsurface process.
Of the on-surface adsorption sites the natural candidates are the C1 and B2top hollows (Fig. 1). However, our calculated low-coverage binding energies, plotted in Figure 2, show that for single atom adsorption at coverages (corresponding to a single O atom in the , , and surface unit cells) the only stable on-surface adsorption site is the one denoted as C1, and the binding energy of this site is significantly less than that of any of the subsurface sites. We find no single-adsorbant energy minimum near the position where we would expect the on-surface B2top-site. Instead, when relaxing dilute systems with O in the B2top sites the surrounding Mg atoms move laterally by a small amount, enough to let the O-atoms sink into the subsurface B2 (tetrahedral) site. Only if a pair of O atoms are adsorbed as nearest neighbors, or at increased O loading (), can one of the O atoms be stabilized on the surface in the B2top site, albeit at smaller binding energy than in the slightly lower-lying B2-site. Thus, for low coverages our DFT results point to the C1 site as the only possible, but energetically unfavorable, on-surface adsorption site.
These results are in agreement with the theory results of Bungaro et al.Bung97 as to subsurface adsorption sites being more favorable than on-surface ones, but contradict their prediction of a stable on-surface B2top-site for low coverages. It should be noted, however, that for coverages Bungaro et al.Bung97 relaxed only the O atoms but not the Mg-lattice, and that their -point sampling was limited to the point only. Thus our results underline the importance of relaxing the substrate.
The subsurface adsorption. By extensive searches for subsurface adsorption sites we find that within the two top Mg-layers the tetrahedral sites (sites B2, A4, and A5) have higher binding energies than the on-surface C1 and the subsurface octahedral C3-site for all coverages (compare Fig. 2 and Table 1). Thus, the first O atom adsorbed in the oxidation process binds in a subsurface site of type B2, its binding energy being only 0.09 eV and 0.15 eV higher (Fig. 2) than that of O in subsurface site A4 and A5, respectively. The preference for the B2 site agrees with the results of Ref. Bung97, , but we find a binding energy about 0.6 eV larger. In addition, they find that the on-surface B2top site is much more favored than the subsurface A4 site, in clear disagreement with our results. These difference are likely due to the lack of Mg-atoms relaxation and the inferior -points sampling used in that study.
| Sites | [eV] | Sites | [eV] |
|---|---|---|---|
| 1/8 ML coverage | 1/2 ML coverage | ||
| B2 & B2 | 5.07 | B2 & B2 | 5.13 |
| B2 & C3 | 4.77 | B2mix & C3 | 4.74 |
| B2 & A4 | 5.03 | B2mix & A4 | 4.99 |
| B2 & A5 | 5.03 | B2 & A5 | 5.00 |
| B2top & B2 | 5.00 | ||
In order to check the possibility of formation of ionic complexes (which would represent a seed for further oxide formation) consisting of the Mg atoms of the topmost layer and subsurface and on-surface oxygen, we calculated the most preferred sites for an additional O atom in the presence of an already adsorbed one. In studying possible combinations of the oxygen adsorption sites we concentrated on the ones including the B2 sites. As is evident from Table 1, even at low coverages with one O-atom isolated from other O-atoms the addition of another O atom leads to an increased O-population in the B2 sites. The two (neighboring) atoms in the B2 sites are by 0.03–0.04 eV more favored than one atom in the B2 site and another one in either the A4 or A5 site.
II.3 Higher oxygen coverage ( ML)
For 1 ML coverage with occupation in only one kind of site the energetic ordering of the most stable sites is different than for lower coverages (Fig. 2 and Table 2). The B2-type sites become less favorable than the A4 site and the actual B2 site is shifted to the B2top position. However, allowing for simultaneous occupancy of the B2 and B2top sites at 1 ML in the unit cell (Table 2) we find that this combined B-site structure is by 0.06 eV more favored than the single A4 occupancy shown in Fig. 2.
| Sites | ||||
| [eV] | [eV] | (1.4 L) | (9.7 L) | |
| 1 ML, nearest neighbors | ||||
| B2 & A5 | 5.25 | -0.64 | 0.41 | 0.30 |
| B2mix & A4 | 5.21 | -0.62 | 0.34 | 0.37 |
| B2top & C3 | 5.03 | -0.49 | 0.51 | 0.43 |
| 1 ML, one atom per unit cell | ||||
| B2top & B2 | 5.39 | -0.46 | 0.46 | 0.46 |
| A4 | 5.33 | 0.00 | 0.42 | 0.48 |
| B2top | 5.27 | -0.99 | 0.44 | 0.46 |
| A5 | 5.23 | 0.11 | 0.53 | 0.42 |
| C1 | 5.15 | -0.12 | 0.44 | 0.46 |
| C3 | 5.04 | 0.62 | 0.56 | 0.51 |
| 2 ML | ||||
| A4 + B7 | 5.61 | -0.07 | 0.41 | 0.50 |
| A5 + B8 | 5.55 | 0.27 | 0.56 | 0.45 |
| B2 + A5 | 5.54 | -0.03 | 0.44 | 0.33 |
| Rocksalt 2ML | 5.45 | 0.72 | 0.54 | 0.45 |
| Flat 2ML | 5.42 | -1.14 | 0.29 | 0.36 |
| 3 ML | ||||
| A4 + B7 + A10 | 5.70 | 0.04 | 0.45 | 0.50 |
| A5 + B8 + A11 | 5.67 | 0.09 | 0.53 | 0.43 |
| B2 + A5 + B8 | 5.66 | 0.04 | 0.46 | 0.35 |
| Rocksalt 3ML | 5.61 | 0.78 | 0.55 | 0.50 |
| Flat 3ML | 5.47 | -1.14 | 0.30 | 0.37 |
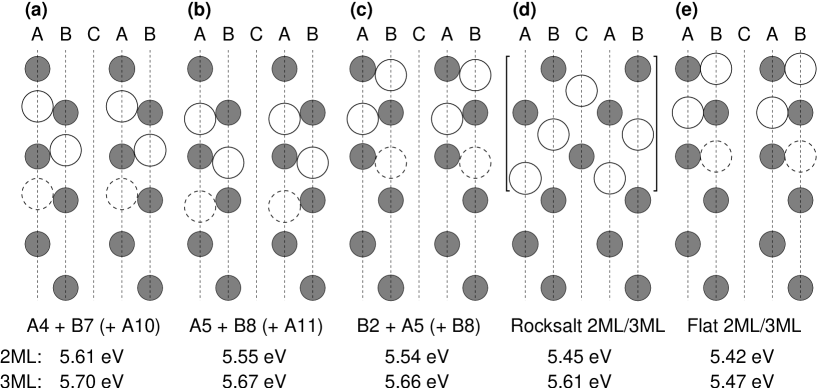
As more oxygen is adsorbed into the Mg surface the possible adsorbate configurations grow in number, partly due to simple combinatorics, and partly because new adsorption sites appear within an increasingly distorted Mg background lattice. This is already apparent for nearest-neighbor adsorption in the low-coverage region (Table 1) where a slight vertical distortion of the top Mg-layer in some cases leads to adsorption in the B2top site and in a ‘mixed’ B2-B2top position. In Table 2 we name the 1 ML configurations by the adsorbate position, but for higher coverages the notation is merely an approximate description of the structure, and we refer the reader to Fig. 3 for a sketch of the multitude of similar but not identical configurations at coverages 2–3 MLs.
The stable structures found in the 2 and 3 ML coverage region fall in two general classes: layered structures with oxygen and magnesium in buckled or flat layers having a hexagonal structure [Fig. 3 (a)–(c), and (e)], and rock-salt structures [Fig. 3 (d)] on top of clean magnesium, strained with respect to the clean-surface lattice constant. The buckled structures are labeled according to the approximate positions of the oxygen atoms (comparing to the low-coverage adsorption sites of Fig. 1). The buckled structures involve subsurface oxygen only. The vertical separation of O and Mg within a buckled layer is approximately 0.6 Å, and the layers can exist both on top of the clean Mg(0001) [Fig. 3(c)] and as subsurface layers [Fig. 3(a) and (b)], and at 2 or 3 ML coverage. Thus one can discriminate the structures buckled up and down, depending on the oxygen atoms staggering over or below the Mg layer, respectively. The flat structures [Fig. 3(e)] have vertical O-Mg separation 0.01–0.06 Å, and exist for both 2 and 3 ML coverage, but do not exist as subsurface layers. In the flat structures the top-most oxygen atom sits slightly above the top Mg layer, corresponding approximately to the position of site B2top in Fig. 1. The binding energies of the 1–3 ML structures are given in Table 2. Note that for several other configurations with 2 ML or 3 ML coverage of the tetrahedral adsorption sites no energy minimum is found. This includes any subsurface flat phase, phases of mixed flat and buckled layers, and mixed buckle-up and buckle-down layers. Further, we tested structures that include an octahedral (C3, C6, C9) site in the 2 ML and 3 ML coverage and found binding energies per atom at least 0.3–0.4 eV smaller than the energetically best structures at the same coverage, similar to the results of the low coverage results (Fig. 2).
The preference for subsurface adsorption at the Mg(0001) surface was originally suggested by a sharp work function decrease upon oxidation.Hay81 Previous local-density-approximation DFT calculationsBung97 have shown that only oxygen incorporation into B2 sites lowers the work function and for one monolayer load this lowering was found to be 0.3 eV, which is much smaller than measured experimentally. We do not find 1 ML adsorption in the B2 sites, but for the neighboring B2top sites our results presented in Table 2 confirm the lowering of the work function. However, this lowering is three times larger than that reported in Ref. Bung97, and we note that our B2top sites are slightly above and nearly coplanar with the topmost Mg layer. This larger decrease of the work function upon oxygen adsorption agrees with recent measurements.MitOCS98
It is generally expected that an adlayer of negative O ions will increase the metal-surface dipole layer and the work function. For example, this is clearly the case for oxygen on the Al(111) surface. KiLu01 Our results suggest that 1 ML of on-surface (B2top) oxygen on the Mg(0001) surface leads to a decrease in the work function. This decrease for on-surface O is consistent with experimental observations.MitOCS98 On the other hand, for 1 ML coverage the B2top sites are not the energetically most favorable. We conjecture that the following scenario takes place. At low coverage the only on-surface sites are the fcc hollows (C1), but also the lower-lying subsurface B2 sites are exposed to O atoms arriving at the surface. Thus an O-atom that arrives to the surface will find the B2 site having a higher adsorption energy than the C1 site and will immediately diffuse to the former. The B2-sites are most favorable up to 0.5 ML coverage (Fig. 2). With growing O-coverage the energetic situation changes and the deeper tetrahedral sites become more favorable. However, there is an energy barrier to overcome in order to get into these lower-lying A4 and A5 sites so for 1 ML coverage, instead of moving further into the surface, the oxygen atoms stay in the neighborhood of the B2 sites, now shifted into the B2top position. The B2top site is energetically slightly less favored than the tetrahedral subsurface sites (by about 0.06 eV) but requires no crossing of significant energy barriers. With an increased oxygen load (around 2 ML) the energy barrier is lowered and some of the oxygen atoms can move into the A5 sites. Again, the occupation of the B2top and A5 sites (the “Flat 2ML” structure) is not the most favorable energetically (Table 2) but presumably this metastable state is most easily available for the O atoms. The work function change for this configuration is similar to for the energetically favorable A4+B7 subsurface structure. With a further increase of O load (3 ML) the energy barriers that separate the lower lying sites are lowered and oxygen populates the B8 sites. It seems that this scenario is supported by our XPD experiments presented in Sec. III.
Island formation. In a previous theory study based on a lattice-gas-modelElse01 it was shown that oxygen atoms that are adsorbed in the Mg(0001) surface form dense clusters in tetragonal subsurface sites. For example, at a dosing corresponding to a global coverage of 1 ML, the oxygen atoms were found to be distributed, on average, with 55% in site B7, 30% in site A4, and 15% in site A10 and with local coverages of 2–3 MLs within the clusters.
In the present, more detailed investigation we find that past the adsorption of the first, isolated O-atoms in the oxidation process the O-atoms show a tendency for island formation by pairing up and showing higher binding energies in combinations with subsurface sites. An inspection of the binding energies presented in Fig. 2 and in Table 1 shows that the higher the coverage, the larger the binding energy of the lower-lying sites (sites A4 and A5). Our results show that in general the binding energy is higher in more close-packed systems, thus showing that clusters or islands of O atoms are preferred to isolated or pairs of O atoms. In fact, for 1 ML coverage, having all O atoms in site A4 is preferred by a small amount to all other subsurface sites and to the on-surface B2top site. This agrees well with the previous lattice-gas-model study.Else01 With coverage increasing above 0.5 ML, the O-atoms from the B2 sites are pushed up into the surface B2top sites. Thus they end up, at 1 ML load, in the B2top-sites located almost coplanarly with the Mg atoms of the topmost layer, with the binding energy comparable to that of O in sites A4 and A5.
The preference for the formation of subsurface islands in tetrahedral A4 sites or lower agrees both with the lattice-gas model simulations and with the results of Bungaro et al. Bung97 but disagrees with the results of Thiry et al. Thi89 who found adsorption in octahedral sites. A new feature that was not observed by Bungaro et al., and which is probably connected with a more careful treatment of the lattice relaxation effect in our work, is the appearance of the on-surface O-islands for 1 ML coverage, with binding energy slightly lower than in subsurface islands of A4-type. Also worth noting are the relatively small binding energy differences for oxygen in different sites for .
The tendency to form islands continues with further increase of coverage, showing some quenching in the adsorption energy at 3 ML coverage. A similar behavior was found in the lattice-gas model simulations. Else01
Layered structures. As the coverage is increased beyond a single monolayer the layered structures of Fig. 3(a)–(c) and (e) appear, along with a rocksalt surface structure, Fig. 3(d). The layered structures can be described as a Mg(0001) surface with slightly changed atomic positions to accommodate O atoms within the top layers of the Mg surface, thereby creating a layered structure. Each of the layers has a honeycomb structure with O at every second vertex and Mg at the remaining vertices. The layers are stacked in an AA′ stacking sequence, with O on top of Mg atoms and vice versa at a layer separation of approximately 2.3–2.7 Å.
Again, we find (Fig. 3) that subsurface layered structures are preferred. Comparing the adsorption binding energies listed in Fig. 3 it is evident that with increased O coverage, the difference in binding energies for the subsurface layered and rocksalt structures is diminishing, indicating that eventually, for still higher coverage, the rocksalt structure may become the most favorable one.
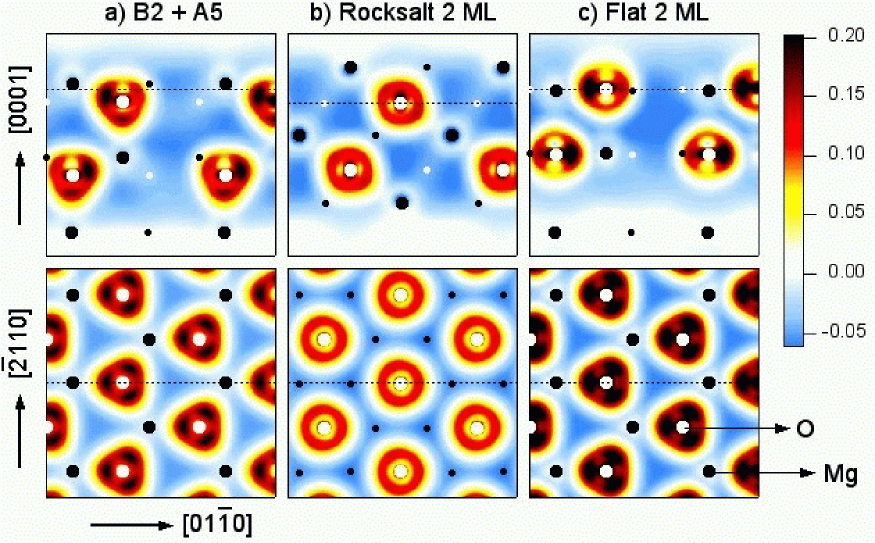
Directional bonding. Figure 4 displays the electron charge redistribution for three of the 2 ML structures. Whereas the rocksalt structure (Fig. 4(b)) has an almost isotropic charge redistribution around each atom, as is typical for ionic binding, the two layered structures show more complicated, anisotropic charge redistributions. The flat layered structure (Fig. 4(c)) shows most clearly the anisotropy, with more charge redistribution along the in-plane nearest-neighbor Mg-O lines than in other directions.
III EXPERIMENTS
To supplement the DFT calculations and to provide a reference ground we have also carried out XPD measurements of the clean Mg(0001) surface and after low dosing of oxygen.
III.1 Method
XPD has been chosen because of its chemical sensitivity and its sensitivity to local real space order. It is a powerful technique for surface structural investigations,Fadley and it has been shown that full-hemispherical XPD patterns provide very direct information about the near-surface structure. At photoelectron kinetic energies above about 500 eV, the strongly anisotropic scattering by the ion cores leads to a forward focusing of the electron flux along the emitter-scatterer axis. The photoelectron angular distribution, therefore, is to a first approximation a forward-projected image of the atomic structure around the photoemitters. Analysis of the symmetry and positions of forward-focusing maxima thus permits a very straightforward structural interpretation of XPD data. Furthermore, detailed structural parameters can be determined by comparing the experimental XPD patterns to calculated ones. The relatively simple and efficient single-scattering cluster (SSC) formalismFadley has proven adequate in most cases. The agreement between SSC calculations and experimental XPD pattern can be quantified using a reliability factor such as the R-factor defined previously.RMPref ; RMPexplain
The experiments have been performed in the University of Fribourg’s VG ESCALAB Mk II spectrometer modified for motorized sequential angle-scanning data acquisition. Clean Mg(0001) surfaces have been prepared by cycles of sputtering (500 eV Ar+) and annealing (130 ∘C). Before O2 exposure, the surface displayed a sharp LEED pattern with little background. After O2 exposure with the sample held at room temperature, the coverage was determined from the relative intensities of the O 1s and Mg 2p photoelectron peaks. Experimental O XPD patterns were obtained after exposure of the Mg(0001) surface to 0.15, 0.7, 1.4 and 9.7 L of O2, corresponding to global O coverages of 0.1, 0.4, 1 and 1.7 ML, respectively.
III.2 Oxygen adsorbed at Mg(0001)
The Mg(0001) surface with various coverages of oxygen atoms was studied with LEED and XPD. Experimental XPD patterns for O2 doses of 0.15 and 9.7 L are shown in Fig. 5. The most prominent feature of the 0.15 L pattern is a strong intensity maximum at normal emission. This observation is a clear and direct evidence for O adsorption below the topmost Mg layer: Only an atom located directly above the oxygen photoelectron emitter can give rise to a forward-focusing maximum at normal emission, i.e., in the center of the plot. A further conclusion can immediately be drawn from the evolution of the XPD pattern with O2 exposure. Apart from differences due to counting statistics, the experimental XPD patterns are strikingly similar, not only regarding the intensity maximum at normal emission but regarding all the prominent diffraction features. It must therefore be concluded that the local atomic geometry is the same over the entire exposure range.
The same conclusion is obtained from the evolution of the LEED pattern with increasing O2 exposure: The LEED pattern stays (), and only the background rises slightly, which indicates an increasing amount of disorder with increasing coverage. Since no superstructures are observed, the presence of any other islands than islands of () periodicity that are larger than about 50–100 Å can therefore be excluded.
In other words, both the LEED and XPD measurements indicate that locally the geometry is the same irrespective of the global coverage (at least below 1.7 ML). Already at 0.1 ML global coverage this local structure thus contains at least 1 ML oxygen, and with increasing coverage it will grow in domain size without significant changes in geometrical structure. Therefore, determining the local geometrical structure at 1ML local coverage will determine the geometries even at the lowest global coverages accessible to the experiments.
In the further analysis we compare simulated SSC diffraction pattern to experimental XPD images of the Mg(0001) surface both with dosing 1.4 L (approx. 1 ML global coverage) and 9.7 L (approx. 1.7 ML global coverage).
IV Comparison between experiment and theory
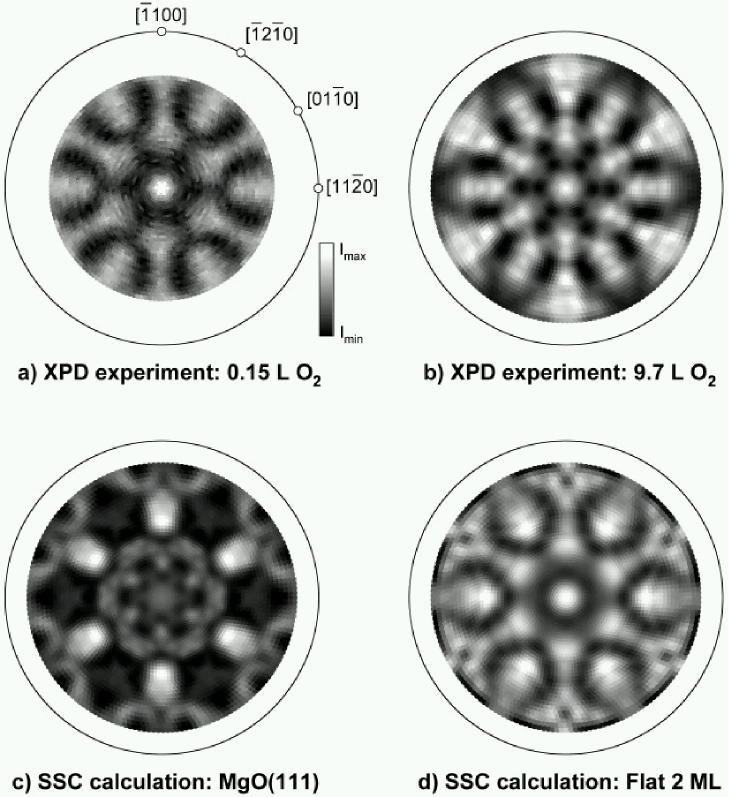
That the O/Mg(0001) system does not simply form a MgO(111) rocksalt structure is clearly seen by comparing a simulated diffraction pattern for MgO(111) [Fig. 5(c)] to the experimental 9.7 L XPD pattern shown in Fig. 5(b): The simulation does not reproduce any of the diffraction features satisfactorily. Therefore, the most relevant atomic structures, as determined by the DFT calculations, were used to simulate XPD patterns by means of SSC calculations. The resulting SSC calculations were compared to the experimental 1.4 L and 9.7 L XPD patterns, the latter of which is shown in Fig. 5(b).
None of the SSC calculations for an oxygen atom in an isolated site gave satisfactory agreement with experiment. The calculations, however, confirm the conclusion drawn from the experimental patterns that one oxygen atom is adsorbed directly below a Mg atom: Only the simulations for oxygen in the A4 and A5 sites exhibit the characteristic intensity maximum at normal emission that is seen in experiment [Fig. 5(a),(b)]. The fact that the experimental XPD patterns do not agree with simulated diffraction patterns of disperse, low local coverages even for low overall coverage in the experiment is consistent with the LEED measurements discussed above, indicating again that the oxygen will form island with a local coverage of 1 ML or more. Accordingly, further SSC calculations concentrated on the atomic positions obtained from DFT calculations using a surface cell.
Among the simulated diffraction patterns for 1 ML local coverage only the site A4 and the site A5 SSC calculations exhibit a central maximum. In contrast, the SSC calculations for each of the C3, B2top, and C1 sites (leaving all other sites empty) do not show such maximum. This means that the comparison between SSC calculations and experimental XPD patterns thus disqualifies the site B2top-only occupation at 1 ML local coverage, in agreement with the theoretical binding energy being smaller for B2top than for A4 at 1 ML coverage. Along with the binding energy obtained from the DFT calculations the comparison to the XPD patterns also rules out octahedral subsurface (site C3) occupation, in disagreement with the results of Thiry et al. Thi89
Consequently, SSC calculations were also performed for the atomic positions obtained from DFT calculations considering 2 and 3 ML coverage. In Table 2 we summarize the 1 ML, 2 ML and 3 ML local coverage SSC simulations [one to three O atoms per cell] by listing their reliability factors with respect to the 1.4 L and 9.7 L exposure XPD data. Best agreements between experiment and SSC calculations (lowest reliability factors) are found for the layered structures “B2mix & A4” and “B2 & A5” at 1 ML local coverage, “Flat 2ML” [Fig. 5(d)] and “B2 + A5” at 2 ML local coverage, and “Flat 3ML” and “B2 + A5 + B8” for 3 ML local coverage. These results are consistent with the work function changes discussed above.
The general trend is that the rocksalt structures (2 ML and 3 ML) do not agree very well with the experimental XPD patterns (high values of ), whereas some of the layered structures agree better. In particular we notice that among the 2 ML structures the flat structure (“Flat 2ML”) has the best agreement with the 1.4 L experiment, whereas one of the buckled layer structures (“B2 + A5”) fits best to the 9.7 L experiment. This indicates that as the global coverage is increased by higher O2 dosing, more of the surface becomes covered with buckled Mg and O layers and less with the flat surface.
For the 1.4 L dosing experiment the flat surface is favored, in disagreement with the DFT results. 1.4 L dosing corresponds to 1 ML of global coverage, but since the distribution of oxygen is nonuniform due to the tendency of the atoms to form islands the experimentally observed surface is patched. For small surface oxide patches of 2 MLs (or more) local oxygen coverage the strain can get released over most of the island and thus, experimentally, mostly the flat structure is seen at low dosing. This gives a low -value for the flat structure, but still keeps the order of the buckled and rocksalt structure found in DFT calculations: buckled is also at 1.4 L more favored experimentally than rocksalt. Thus, the relevant dosing (among the measured ones) to use for comparing DFT and the XPD experimental structures is 9.7 L. This structure probably does not fully cover the surface (if clusters are at least 2 ML dense), but certainly does so to a larger extent than for dosing 1.4 L. At dosing 9.7 L the DFT calculations and the XPD experiment agree on the buckled surface.
Based on both the calculated and experimental structures discussed above we conclude that at relatively low dosage (corresponding to 2–3 ML coverage) O/Mg(0001) forms the layered oxide structure. The rocksalt structure typical of MgO starts to grow only at higher O dosing.
V Summary and CONCLUSIONS
We have performed extended first principles calculations of oxygen adsorption and of the initial stages of Mg(0001) oxidation. A variety of configurations and a wide range of coverages were considered in order to determine the most stable structures. These were compared with x-ray photoelectron diffraction experiment and simulations. At low coverages ( ML) both our DFT calculations and experiment show that oxygen adsorbs in subsurface sites. Our DFT calculations show that the first O atom chemisorbed in the oxidation process binds in a subsurface tetrahedral site of the B2 type. The importance of substrate lattice relaxation in accurate determination of the most stable sites is demonstrated. At higher coverage O adsorbed in subsurface tetrahedral sites shows a tendency to form subsurface islands which results in an increased binding energy. For the 2 ML (3 ML) coverages we find some rather unanticipated surface oxide structures, consisting of two (three) mixed oxygen-magnesium layers on top of an almost undistorted Mg(0001) surface. These layered oxide structures have hexagonal symmetry and can be flat or buckled. For 2–3 ML coverage the rocksalt structure is found to be unfavorable compared to the buckled layer structures. However, our DFT results show that the rocksalt structure may become energetically competitive at an increased coverage.
Acknowledgements.
This work was supported in part by the Swedish Foundation for Strategic Research (SSF), the Swedish Research Council (VR), The Swedish Foundation for International Cooperation in Research and Higher Education (STINT), the Carl Tryggers Foundation, and the Polish State Committee for Scientific Research (KBN), project 5 P03B 066 21. R.F. would like to thank P. Aebi for continuous support and help with the XPD experiments. The allocation of computer time at the UNICC facility at Chalmers and Göteborg University is gratefully acknowledged.References
- (1) The Surface Science of Metal Oxides, edited by V. E. Henrich and P. A. Cox (Cambridge University Press, Cambridge, 1994).
- (2) Y. Yourdshahyan et al., J. Am. Ceram. Soc. 82, 1365 (1999).
- (3) C. Noguera, J. Phys.: Condens. Matter 12, R367 (2000).
- (4) E. Schröder, Comput. Mater. Sci. 24 105 (2002).
- (5) A. U. Goonewardene, J. Karunamuni, R. L. Kurtz, and R. L. Stockbauer, Surf. Sci. 501, 102 (2002).
- (6) H. Namba, J. Darville, and J. M. Gilles, Surf. Sci. 108, 446 (1981).
- (7) J. Ghijsen, H. Namba, P. A. Thiry, J. J. Pireaux, and P. Caudano, Appl. Surf. Sci. 8, 397 (1981).
- (8) B. E. Hayden, E. Schweizer, R. Kötz, and A. M. Bradshaw, Surf. Sci. 111, 26 (1981).
- (9) S. A. Flodström and C. W. B. Martinsson, Surf. Sci. 118, 513 (1982).
- (10) P. A. Thiry, J. Ghijsen, R. Sporken, J. J. Pireaux, R. L. Johnson, and R. Caudano, Phys. Rev. B 39, 3620 (1989).
- (11) H. Cronacher, K. Heinz, K. Müller, M.-L. Xu, and M.A. van Hove, Surf. Sci. 209, 387 (1989).
- (12) B. C. Mitrovic, D. J. O’Connor, and Y. Shen, Surf. Rev. Lett. 5, 599 (1998).
- (13) S. M. Driver, J. Lüdecke, G. J. Jackson, and D. P. Woodruff, J. Electron Spectrosc. Rel. Phen. 98-99, 235 (1999).
- (14) S. Lacombe, L. Guillemot, and V. A. Esaulov, Surf. Sci. 304, L431 (1994).
- (15) V. A. Esaulov, O. Grizzi, L. Guillemot, M. Maazouz, S. Ustaze, and R. Verucchi, Surf. Sci. 380, L521 (1997).
- (16) C. Bungaro, C. Noguera, P. Ballone, and W. Kress, Phys. Rev. Lett. 79, 4433 (1997).
- (17) Computer code dacapo version 1.30, http://www.fysik.dtu.dk/CAMPOS/
- (18) J. P. Perdew, J. A. Chevary, S. H. Vosko, K. A. Jackson, M. R. Pederson, D. J. Singh, and C. Fiolhais, Phys. Rev. B 46, 6671 (1992); 48, 4978(E) (1993).
- (19) D. Vanderbilt, Phys. Rev. B 41, 7892 (1990).
- (20) J. Neugebauer and M. Scheffler, Phys. Rev. B 46, 16067 (1992).
- (21) L. Bengtsson, Phys. Rev. B 59, 12301 (1999).
- (22) W. H. Press, B. P. Flannery, S. A. Teukolsky, and W. T. Vetterling, Numerical Recipes (Cambridge University Press, 1986).
- (23) D. Hardie and R. N. Parkins, Phil. Mag. 4, 815 (1959).
- (24) E. Wachowicz and A. Kiejna, J. Phys.: Condens. Matter 13, 10767 (2001).
- (25) E. Ziambaras and E. Schröder, Theory for structure and bulk-modulus determination, cond-mat/0304075 .
- (26) A. R. Wazzan and L. B. Robinson, Phys. Rev. 155, 586 (1967).
- (27) H. L. Davis, J. B. Hannon, K. B. Ray, and E. W. Plummer, Phys. Rev. Lett. 68, 2632 (1992).
- (28) H. B. Michaelson, J. Appl. Phys. 48, 4719 (1977).
- (29) A. Kiejna and B. I. Lundqvist, Phys. Rev. B 63, 085405 (2001); 64, 049901(E) (2001).
- (30) K. Reuter, C. Stampfl, M. V. Ganduglia-Pirovano, and M. Scheffler, Chem. Phys. Lett. 352, 311 (2002).
- (31) C. S. Fadley, in Synchrotron Radiation Research: Advances in Surface Science, edited by R. Z. Bachrach (Plenum, New York, 1990), Vol. 1.
- (32) R. Fasel, P. Aebi, J. Osterwalder, L. Schlapbach, R. G. Agostino, and G. Chiarello, Phys. Rev. B 50, 14516 (1994).
- (33) Note that the multipole R-factor is not a normalized quantity, therefore its absolute value depends on many parameters and only relative differences are significant for structural analysis. So far, no rigorous theory for error estimation has been developed for . It is our experience, however, that R-factor differences of 10 % are significant and allow to safely rule out structures with higher values.