A possible demonstration of cooperative dynamical Jahn-Teller
effect in Raman scattering spectrum of rhombohedral
Abstract
The Raman scattering (RS) spectra of rhombohedral is considered. It is shown that broad high intensity RS line at 640 Abrashev et al. (1999) could be explained in the framework of cooperative dynamical Jahn-Teller effect. This hypothesis is illustrated through the lattice dynamics calculations explicitly allowing for the electron-phonon term both in crystal energy and in dynamical matrix. The averaging scheme for the one mode cooperative dynamical effect is proposed
pacs:
63.20.-e, 63.20.Dj, 78.30.Hv, 71.70.EjI Introduction
The colossal magnetoresistance (CMR) is the main feature of lanthanum manganites Urushibara et al. (1995). Because of metal to insulator transition, the doped rhombohedral manganites are of grate interest. The nature of ground state in manganites is still under the question. There are strong coupling between orbital (electronic) and lattice degrees of freedom in manganites due to Jahn-Teller (JT) effect on ions. Such coupling gives rise to the formation of vibronic ground state Bersuker and Polinger (1989). The vibronic ground state fundamentally transforms magnetic and transport properties of manganites Millis et al. (1995); Satpathy (1998); Zhou and Goodenough (1998).
The pure is the model compound for investigating cooperative JT effect. Undoped crystallizes in two phases: orthorhombic and rhombohedral Norby et al. (1995); Huang et al. (1997). The orthorhombic one features by the static cooperative JT effect. The static cooperative JT effect and space symmetry of rhombohedral phase are incompatible because the JT distortions break this symmetry. The only way to conserve the space symmetry in rhombohedral phase is dynamical JT effect. The possibility of dynamical JT effect in manganites is widely discussed Millis et al. (1995); Goodenough et al. (1961); Zhou and Goodenough (1998). The dynamical JT effect manifests in two basic forms: uncorrelated local dynamical JT distortions of complexes and cooperative dynamical JT distortions, which can be called cooperative dynamical JT effect Sobolewski (1997). The most powerful tool that could determine presence of low symmetry structure is Raman scattering (RS). We suppose that rhombohedral exhibits cooperative dynamical JT effect. We show that anomalous intensity of RS lines observed in rhombohedral Abrashev et al. (1999); Martín-Carrón et al. (2002) could be explained in terms of cooperative dynamical JT effect. For the lattice dynamics calculation the interionic pair potential shell model approximation with electron-phonon (JT) term, which explicitly allows for the dynamical effect, is used Nikiforov and Shashkin (1997); Nikiforov and Popov (2001).
II Symmetry and Qualitative Analysis of rhombohedral
As was mentioned by Iliev and coworkers Abrashev et al. (1999); Iliev and Abrashev (2001) the Raman spectra of rhombohedral differs strongly from RS of non JT
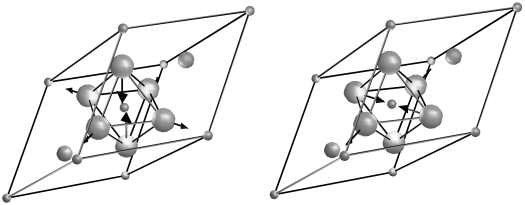
From the symmetry analysis we know that in the space group only five modes are active in RS (). The experiment on Abrashev et al. (1999) clearly shows 4 Raman active mode and one, that has very low frequency of was also observed Scott (1969). Comparing the RS of rhombohedral one should note strong distinction to RS of . The main difference is appearance of new intensive high-frequency line near and relative increase of intensities of high frequency lines. The appearance of new RS line is clear evidence for lowering symmetry, i.e. that the real space symmetry of rhombohedral is lower than . The symmetry lowering could be due to cooperative JT effect. The only JT active mode in point of Brillouin zone (BZ) of space group is double degenerate mode, which corresponds to the mode of ideal perovskite (in Kovalev notation Kovalev (1986)) or (in BSW notation). Two components of mode could be indexed as and (Fig. 1). The symmetry group of new phase depends on the ratio of to . This ratio is convenient to describe by an angle, defined as and . If the structure will be with space symmetry. In other case space symmetry will be .
The JT distortions in space group differs strongly from that in orthorhombic phase with space group: in orthorhombic phase the distortions correspond to the point of ideal perovskite BZ ( in Kovalev notation Kovalev (1986)). On other hand, in experimentally observed monoclinic phase structure Huang et al. (1997) JT distortions correspond to the mode of ideal perovskite.
and groups both have all 12 gerade modes active in RS. These modes correspond to the following vibrations: split four double degenerate mode; one mode, and three modes. The symmetry breaking would give rise to the appearance of a new line. It corresponds to the vibration. The intensities calculation revealed the remaining two modes to be low RS active. For the investigation of such phase transition we use lattice structure and dynamics calculations.
III Lattice Structure and Dynamics Calculations
III.1 Energy calculation model
In lattice structure calculation the crystal lattice parameters are obtained by the optimization of crystal energy with respect to displacements of ions that do not change crystal lattice symmetry. The crystal energy is calculated in the framework of ionic pair potential shell model explicitly allowing for the JT term, which is simulated as the sum of lower branches of adiabatic potentials of single complexes Nikiforov and Shashkin (1997); Nikiforov and Popov (2001)
| (1) |
In the pairwise-potential approximation and the shell model, the lattice energy can be written as
| (2) |
where describes Coulomb interaction in crystal and the index specifies ions in the primitive cell, the index enumerates all ions of the crystal. The term describes the interaction energy between the core of the ith ion and its shell shifted relative to the core by an amount of . Short range potential is represented by the Born-Mayer, screening and Van-der-Waals terms
| (3) | |||
The screening term describes the screening of Coulomb potential due to overlap of electronic densities of ion. Parameters of pair potential model are listed in table 1. The many-particle JT contribution to the crystal energy is approximated by the sum of expressions for the lower branches of adiabatic potentials of the clusters
| (4) |
where is the linear JT interaction constant ( Nikiforov and Popov (2001)), and , are projection of displacements of oxygen ions onto local JT distortions. Actually, these local distortions are projection of positions of all ions onto cluster local normal JT active modes. The operation of projection can be performed using Van-Fleck coefficients
| (5) | |||
where - indexes JT clusters, - is the projection of displacements caused by crystal vibration with wave vector and number onto local distortion.
III.2 Raman scattering spectrum calculation model
To calculate the phonon frequencies, one should diagonalize the dynamic matrix of the crystal.
| (6) |
where ; and are the matrices of the second derivatives of the crystal energy (without the JT contribution) with respect to the displacements of the cores and shells of ions, respectively; and are the matrices of the mixed derivatives of the crystal energy (without the JT contribution) with respect to the displacements of the cores and shells of ions; and is the matrix of the second derivatives of the JT contribution in Eq. 4 with respect to the ion core displacements.
The ions shells simulate the polarizability of ions, which arises due to transitions to the excited states with different parity. The RS process involves virtual transitions to these states. That is why the RS intensities could be estimated in shell model. Hence, the intensity can be approximated concerning the crystal like classical media.
| (7) |
where is the intensity of mode , is the high frequency polarizability. The derivative is taken with respect to the amplitude of vibration . In the shell model approximation the derivative could be calculated as follows:
| (8) | |||
where is the volume of primitive cell, is the matrix which diagonalizes dynamical matrix of the crystal (Eq. 6), - indexes vibrational modes, and index Cartesian coordinates, and index ions in the primitive cell, - is the charge of the shell with number , is the mass of the ion with number . is the matrix of third derivatives taken with respect to the shell () and core () displacements.
Using the same approximation for calculation of frequencies and RS lines intensities we can perform the assignment of RS peaks to the calculated phonons. Moreover, this approximation allows investigating the RS lines intensities dependence on the values model parameters like pair potentials or JT term parameters as well as crystal lattice distortions.
III.3 Results and discussion
If the JT contribution from lattice energy (Eq. 1) will be removed ( in Eq. (4)), the structure, obtained via minimization of energy, would have space group (tabl. 2). Adding JT term to the crystal energy we will get monoclinic phase with symmetry. Structural phase transition from to structure in rhombohedral was observed Huang et al. (1997). We suppose that in the high temperature rhombohedral phase JT effect remains, but it is of cooperative dynamical type. We performed the calculation of energy dependence on the values of vibrational mode components and . For each fixed values of these parameters the crystal energy was optimized with respect to the all lattice parameters which do not breaks new, , symmetry. Because of fixed values of and parameters there was some constrains on the optimization parameters: a) the projection of ions coordinates onto , displacements were constant; b) the lattice constants were constrained to be like in lattice, i.e. the lattice was allowed only to change its volume and elongate along cubic [111] direction (such constrains do not allow for the uniform JT distortion)
The calculated dependence could be described well with following relationship (energy per primitive cell)
| (9) |
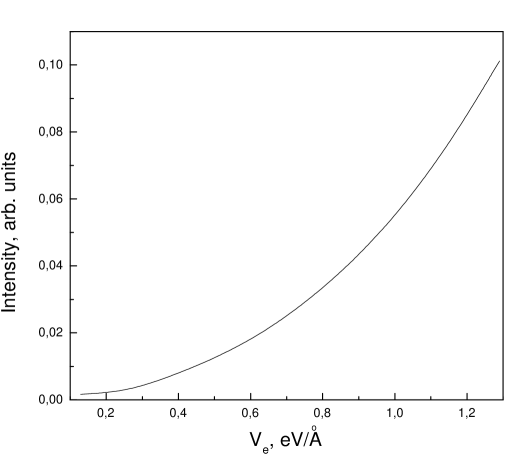
Where , and Because of small value of system will perform ”slow rotation” at the bottom of adiabatical potential. The trajectory of motion will be approximately described by the equation . The value of is much more grater then the oxygen ions vibrational motions amplitude. We suppose that the frequency of motion at the bottom of adiabatic potential is slower then frequencies of optical phonons. We have to average over the trajectory of ”motion” in the , space to get observable physical values. The RS process is ”fast” process, but the total time of observation is much grater than process itself. That is why RS process ”feels” each low symmetry structure that corresponds to different values of , but the total picture is averaged on the whole trajectory of motion. In such case we have to average phonon frequencies and their RS intensities over the different values. The dynamic matrix is calculated and diagonalized for each value of . As the result the averaged phonon frequencies can be got by the averaging over the dependence (table 3). The dynamic breaking of symmetry could give rise to the appearance of new RS lines. For verification of such assumption we calculated the dependence of intensity of highest vibration (the symmetry in structure) on the value of . For each value of we calculated the which corresponds to the energy minimum (the bottom of adiabatic potential). For this value of the phonon frequencies and RS lines intensities were averaged over all values of (Fig. 2).
Because of low symmetry at each point of trajectory of averaging the phonon frequencies of symmetry are split (Tab. 3). However, the value of gap is rather small to see distinct lines and to give rise for observed in experiment Abrashev et al. (1999); Iliev and Abrashev (2001); Martín-Carrón et al. (2002) broadening. The broadening of lines could have the vibronic origin, which is integral feature of systems with dynamical JT effect Bersuker and Polinger (1989).
Acknowledgements.
This study was supported in part by the grant of RFBR R2002 U02-02-96412 and CRDF Grant REC 005.References
- Abrashev et al. (1999) M. V. Abrashev, A. P. Litvinchuk, M. N. Iliev, R. L. Meng, V. N. Popov, V. G. Ivanov, R. A. Chakalov, and C. Thomsen, Phys. Rev. B59, 4146 (1999).
- Urushibara et al. (1995) A. Urushibara, Y. Morimoto, T. Arima, A. Asamitsu, G. Kido, and Y. Tokura, Phys. Rev. B51, 14103 (1995).
- Bersuker and Polinger (1989) I. B. Bersuker and V. Z. Polinger, Vibronic interactions in molecules and crystals, Springer Series in Chemical Physics (Springer, Berlin, 1989).
- Millis et al. (1995) A. J. Millis, P. B. Littlewood, and B. I. Shraiman, Phys. Rev. Lett. 74, 5144 (1995).
- Satpathy (1998) S. Satpathy, J. Phys.: Condens. Matter 10, L501 (1998).
- Zhou and Goodenough (1998) J.-S. Zhou and J. B. Goodenough, Phys. Rev. Lett. 80, 12 (1998).
- Norby et al. (1995) P. Norby, I. G. K. Andersen, E. K. Andersen, and N. H. Andersen, J. Solid State Chem. 119, 191 (1995).
- Huang et al. (1997) Q. Huang, A. Santoro, J. W. Lynn, R. W. Erwin, J. A. Borchers, J. L. Peng, and R. L. Greene, Phys. Rev. B55, 14987 (1997).
- Goodenough et al. (1961) J. B. Goodenough, A. Wold, R. J. Arnott, and N. Menyuk, Phys. Rev. 124, 373 (1961).
- Sobolewski (1997) A. L. Sobolewski, Chem. Phys. Lett. 267, 452 (1997).
- Martín-Carrón et al. (2002) L. Martín-Carrón, A. de Andrés, M. J. Martínez-Lope, M. T. Casais, and J. A. Alonso, Phys. Rev. B66, 174303 (2002).
- Nikiforov and Shashkin (1997) A. E. Nikiforov and S. Y. Shashkin, Phys. Solid State 38, 3446 (1997).
- Nikiforov and Popov (2001) A. E. Nikiforov and S. E. Popov, Phys. Solid State 43, 1132 (2001).
- Iliev and Abrashev (2001) M. N. Iliev and M. V. Abrashev, J. Raman Spectrosc. 32, 805 (2001).
- Scott (1969) J. F. Scott, Phys. Rev. 183, 823 (1969).
- Kovalev (1986) O. V. Kovalev, Irreducible and induced representation and corepresentation of Fedorov groups (Nauka, Moscow, 1986).
| A | 85.623 | 32.689 | 44.862 | X | 9 | 8.265 | 4.245 |
| B | 1.276 | 1.671 | 1.0592 | Y | -6 | -6 | -6 |
| C | 250.0 | 43.56 | 21.729 | k | 40.0 | 50.76 | 3.99 |
| D | 1.650 | 1.575 | 1.320 | ||||
| 0 | 0 | 4.513 |
| x | y | z | |||
|---|---|---|---|---|---|
| Calc.111The crystal lattice parameters were calculated via energy optimization having | 5.809 | 13.894 | 0.455 | 0 | 1/4 |
| Aver. Calc222The crystal lattice parameters were obtained via averaging of optimized structure having | 5.837 | 13.911 | 0.451 | 0 | 1/4 |
| Exp. Ref. Huang et al.,1997 | 5.529 | 13.335 | 0.447 | 0 | 1/4 |
| Mode | 111The experimental values are taken from Ref. Abrashev et al., 1999. An assignment is carried out according to our intensities calculations. | 222The calculated frequencies without JT term in crystal energy and dynamical matrix ( space group) | 111The experimental values are taken from Ref. Abrashev et al., 1999. An assignment is carried out according to our intensities calculations. | 333The experimental values are taken from Ref. Iliev and Abrashev, 2001 | 444An averaged on the AP bottom RS frequencies |
|---|---|---|---|---|---|
| 33 | 39 | - | - | 61 | |
| 74 | |||||
| - | 144 | - | - | 142 | |
| 180 | 172 | 179 | - | 168 | |
| - | 177 | ||||
| 123 | 223 | 236 | 217 | 235 | |
| - | 261 | - | - | 261 | |
| 152 | 312 | 329 | 323 | 314 | |
| 322 | |||||
| 487 | 468 | 515 | 427 | -555This mode corresponds to the motion along the bottom of adiabatical potential and to get frequency of it will require separate consideration | |
| 497 | 478 | ||||
| - | 580 | 640 | 618 | 584 |