Effects of missing data in social networks ††thanks: The author thanks Peter Dodds, Nobuyuki Hanaki, Alexander Peterhansl, Duncan Watts and Harrison White for careful reading of the manuscript and many useful comments, and Mark Newman for kindly providing the Los Alamos E-print Archive collaboration data.
Abstract
We perform sensitivity analyses to assess the impact of missing data
on the structural properties of social networks. The social network
is conceived of as being generated by a bipartite graph, in which
actors are linked together via multiple interaction contexts or
affiliations. We discuss three principal missing data mechanisms:
network boundary specification (non-inclusion of actors or
affiliations), survey non-response, and censoring by vertex degree
(fixed choice design), examining their impact on the scientific
collaboration network from the Los Alamos E-print Archive as well as
random bipartite graphs. The results show that network boundary
specification and fixed choice designs can dramatically alter
estimates of network-level statistics. The observed clustering and
assortativity coefficients are overestimated via omission of
interaction contexts (affiliations) or fixed choice of affiliations,
and underestimated via actor non-response, which results in inflated
measurement error. We also find that social networks with multiple
interaction contexts have certain surprising properties due to the
presence of overlapping cliques. In particular, assortativity by
degree does not necessarily improve network robustness to random
omission of nodes as predicted by current theory.
Keywords: Missing data; Sensitivity analysis; Graph theory; Collaboration networks; Bipartite graphs.
JEL Classification: C34 (Truncated and Censored Models); C52 (Model Evaluation and Testing).
1 Introduction
Social network data is often incomplete, which means that some actors or links are missing from the dataset. In a normal social setting, much of the incompleteness arises from the following main sources: the so-called Boundary Specification Problem Laumann et al. (1983); respondent inaccuracy Bernard et al. (1984); non-response in network surveys Rumsey (1993); or may be inadvertently introduced via study design. Although missing data is abundant in empirical studies, little research has been conducted on the possible effect of missing links or nodes on the measurable properties of networks at large. In particular, a revision of the original work done primarily in the 1970-80s Holland and Leinhard (1973); Laumann et al. (1983); Bernard et al. (1984) seems necessary in the light of recent advances that have brought new classes of networks to the attention of the interdisciplinary research community Amaral et al. (2000); Barabási and Albert (1999); Newman et al. (2001); Strogatz (2001); Watts and Strogatz (1998); Watts (1999).
Let us start with a few examples from the literature to illustrate different incarnations of missing data in network research. The boundary specification problem Laumann et al. (1983) refers to the task of specifying inclusion rules for actors or relations in a network study. Researchers who study intraorganizational networks typically ignore numerous ties that lead outside an organization, reasoning that these ties are irrelevant to the tasks and operations that the organization performs. A classical account is the Bank Wiring Room study Roethlisberger and Dickson (1939), which focused on 14 men in the switchboard production section of an electric plant. The sociometric data obtained in that study have been analyzed extensively Homans (1950); White et al. (1976) but the effect of interactions outside the wiring room on the workers’ behavior and performance at work is unknown and hardly feasible to estimate.
In a recent study of romantic relationships in a large urban high school Bearman et al. (2002), more than one half of relationships reported in the period of 18 months were with persons who did not attend the school. The network appears to have a large connected component linking together about one half of romantically involved pupils. The authors proposed an elegant explanation for the observed structure in terms of a micro-social norm governing the pair-formation process. However, by focusing solely on the in-school network, the authors implicitly assumed that the remaining 60% of relationships had little effect on social dynamics within the school community. Such a large fraction of outside nominations makes one wonder if homogeneity of dating norms within the school may be affected by student liaisons with the larger community in which the school is embedded.
The boundary specification problem may be avoided to a certain extent if the community is isolated from the rest of the world as e.g. in Sampson’s monastery Sampson (1969). By and large, however, network closure is an artifact of research design, i.e. the result of arbitrary definition of network boundaries. When choosing inclusion rules for a network study, a researcher is effectively drawing a non-probability sample from all possible networks of its kind Laumann et al. (1983). As a result, it is almost impossible to estimate the error introduced into network data via study design. Dynamic changes in the network (waxing and waning relationships or activation of latent ties) only exacerbate the problem.
The problem of informant inaccuracy has enjoyed more close attention in the last decades Bernard et al. (1984); Marsden (1990) and basically represents the case where respondents take their perception of a social relation for the relation itself. As a consequence, network data collected by interviewing or administering a network instrument may reflect the cognitive network rather than the actual interaction pattern. In particular, it has been found that the discrepancy between cognitive and real network in recall data depends on time in a curiously non-linear fashion Bernard et al. (1984). Some ways of alleviating this problem have been proposed, and good network instruments help minimize this kind of bias. At times, however, the cognitive network might be exactly what the researcher is looking for (e.g., in marketing applications, etc.). On the other hand, many social transactions such as electronic mail may be registered directly and data thus obtained does not contain a significant idiosyncratic component. In this paper we do not explicitly model the effect of informant inaccuracy, assuming that either it is consistent with the research framework, or that the network in question was reconstructed from reliable electronic, historical or survey data.
An important problem in network survey research is that of survey non-response. In a standard sampling situation such as drawing a representative sample from some population, special techniques are available to correct parameter estimates for imperfect response rates Little and Rubin (2002). Unfortunately, no such definitive treatment is available for social network analysis, although effects of non-response on some network properties have been described previously Stork and Richards (1992); Rumsey (1993). We generally follow this exploratory line of research in that we discuss how network structure is affected by different non-response scenarios and propose some ways to ameliorate the problem.
Compound missing data mechanisms may be encountered as well; a good example is forensic network research. Besides fuzzy boundaries, criminal networks are characterized by presence of unknown actors, actors with false identities, and hidden or dormant ties Sparrow (1991). Network analysis practitioners have noticed that minor changes in graph structure (addition or deletion of vertices or links) can have a dramatic effect on network properties as a whole, especially on individual-level indices Krebs (2002). The extent of the distortion depends on the nature of group structure itself as well as on data collection and analysis procedures Holland and Leinhard (1973). However, the sensitivity of many graph-theoretic measures to missing data, especially of those introduced recently, has not been assessed numerically. Not all graph-theoretic indices are applicable to criminal network research from an epistemological point of view,111Sparrow (1991) notes that “fuzzy boundaries render precise global measures (such as radius, diameter, even density) almost meaningless” and suggests that betweenness centrality is probably the most useful measure for criminal networks. and yet fewer may be reliable enough with respect to missing data.
Social network data may as well be biased as a result of study design. In this paper we analyze the so-called fixed choice effect Holland and Leinhard (1973). Consider a friendship network in which actors have anywhere between 1 and 10 friends each. Often network researchers ask respondents to make nominations only up to some fixed number. Suppose that we asked our participants to write down up to three best friends of theirs. How is the network constructed in that particular way different from the “true” friendship network? Does the effect depend on structural properties of the friendship graph? These are some of the questions that we aim to answer.
This paper aims to fill the methodological vacuum around the problem of missing data in social network analysis. One approach to deal with it is to develop analytic techniques that capture global statistical tendencies and do not depend on individual interactions Rapoport and Horvath (1961). A complmentary strategy is to develop remedial techniques that minimize the effect of missing data Holland and Leinhard (1973). Although we do not offer a definitive statistical treatment in this paper, we conduct exploratory analyses and advocate the importance of further work in this direction.222After this manuscript was completed we became aware of another study with a similar approach that focused exclusively on different network centrality measures Costenbader and Valente (2003). To explore the problem and outline possible solutions we use the method of statistical simulation. The general outline of our approach is as follows: (1) take a real (large enough) social network or an ensemble of random graphs and assume that network data is complete; (2) remove a fraction of entities to simulate different sources of error; and (3) measure network properties and compare to the “true” values (from the “complete” network). We quantify the uncertainty caused by missing network data and assess sensitivity of graph-level metrics such as average vertex degree, clustering coefficient Newman et al. (2001), degree correlation coefficient Newman (2002a), size and mean path length in the largest connected component.
We illustrate the problem using the scientific collaboration graph containing authors and papers from the Condensed Matter section of the Los Alamos E-print Archive from 1995 through 1999 Newman (2001) and use this example to develop a statistical argument for the general case of social networks with multiple interaction contexts. Owing to the sheer size of the dataset, the numerical estimates have very narrow confidence intervals. The results are compared to the case of random bipartite graphs.
The paper is organized as follows. Section 2 focuses on the sources of missing or false data in social network research. We generalize the Boundary Specification Problem (BSP) for social networks with multiple interaction contexts modeled as bipartite graphs, in which actors are linked via multiple affiliations or collaborations. We discuss the issues of non-response and non-reciprocation in social network studies as well as the degree cutoff bias often introduced by questionnaire design. Section 3 describes relevant network statistics, datasets and simulation algorithms that are used to investigate effects of missing data on network properties. Section 4 presents the results, while Section 6 summarizes the findings and discusses a number of potential applications.
2 Sources of missing data in social networks
2.1 The Boundary Specification Problem
Network boundary specification which consists of defining rules for inclusion of actors (and relations) in the network under investigation, is a major epistemological problem in social network research. It was first addressed by Laumann et al. (1983) who identified three basic strategies in dealing with the problem. Of course multiple inclusion strategies are possible, as a logical combination of those discussed here.
According to the nominalist approach, actors are included in the network based on the formal definition of group membership (recall examples in the beginning of the paper). Detailed specifications can factor in actors’ attributes (all non-white first year students of a college), relations (all respondents who reported being involved in a romantic relationship), events (all individuals who attended a college party), etc., whereby a conceptual framework is imposed by the analyst and the network boundary becomes devoid of ontologically independent status Laumann et al. (1983). The last example (event attendance) is particularly error-prone and is best described as convenience sampling, with non-generalizable results and all sorts of biases operating including self-selection (e.g. people who attend an event may be quite gregarious and therefore different from those who do not attend).
One particular instance of the nominalist approach is positional specification, most commonly defined as occupancy of a ranked position in a formally constituted group. Examples include a country’s 100 best known politicians, or 500 top business firms (e.g. Davis and Mizruchi, 1999). This approach involves setting an arbitrarily limiting scope in order to facilitate analysis or due to data availability. It is important to know whether network data thus obtained is susceptible to data-specific and subjective bias.
The realist approach (in the Marxist sense) lets actors themselves define network boundaries. “The network is treated as a social fact only in that it is consciously experienced as such by the actors composing it” Laumann et al. (1983). A particular example would be recognized common membership status (students, etc.). This approach emphasizes the cognitive dimension over social interactions per se; hence it may be more susceptible to informant inaccuracy effects. Actors may disagree in their perception of social structure; they may be attributing different weights to certain other actors, relationships or types of relationships. The correspondence between analytically drawn boundaries and the “collectively shared subjective awareness” of these boundaries by the actors should be treated as an empirical question rather than an assumption Laumann et al. (1983).
Finally, an empiricist approach aims to go beyond cognitive experience of either the researcher or social actors and instead focuses on measurable interactions. The network boundary is defined by recording who is interacting with whom in a certain context. This approach has not been feasible for large networks until recently, when data on large-scale social interactions become readily available from the records of email communication or virtual communities Ebel et al. (2002); Guimera et al. (2002); Holme et al. (2002); Newman et al. (2002). The empiricist approach requires an operational specification of the interaction setting or context, and then including all actors who interact within this context. The missing data mechanism associated with this approach is the boundary specification problem for relations.
2.2 The boundary specification problem for relations
Since social networks are constructed from actors and relations between actors, the boundary specification problem has two faces to it. In addition to defining a network boundary over the set of actors, researchers make arbitrary decisions on which relations to consider. Often it is determined by the task at hand, e.g. a study of the spread of HIV would perhaps include only two relations (sexual contacts and needle sharing) without any loss of validity. For other interesting topics, such as collective movements or social contagion processes, relevant network relations are not so easy to define.
Consequently, a researcher of social networks faces the question of what types of links to include. This problem is conceptually close to the task commonly faced in the traditional social research focused on individual attributes, that is, which variables should be analyzed. Usually the research is informed by theory and aided by exploratory numerical techniques (as in econometrics and finance). Yet there is no consistent theory of social interactions to guide network research White (1992), which leaves us face-to-face with a non-trivial epistemological problem. Laumann et al. propose that key ties may be omitted “due to oversight or use of data that are merely convenient. Such an error, because it distorts the overall configuration of actors in a system, may render an entire analysis meaningless” Laumann et al. (1983).
We develop here a multicontextual approach based on actors’ participation in groups, events or activities. The key idea is to break down social ties to identifiable, discrete interactions. As we have illustrated, social actors belong to multiple affiliations, attend various events, participate in different interaction contexts, and every interaction may be important for the dynamics of the social network in which actors are embedded Breiger (1974); White (1992).
The idea that people participate in multiple relations with one another is certainly quite old (cf. Simmel, 1908), so it seems surprising that only a few studies have made use of multiple interaction contexts in mathematical models of social networks. White et al. (1976) demonstrated in 1976 that it is possible to efficiently extract an image of social structure underlying multiple relations defined for the same set of actors. Watts et al. (2002), based on the results of Travers and Milgram (1969) as well as their own recent electronic experiment Dodds et al. (2003), proposed that people use multiple relations in order to solve the small world problem, i.e. to deliver a message to an unknown target using only connections from within their egocentric network. In both studies, however, the number of actors is much greater than the number of relations in which actors participate. Perhaps this might be an artifact of study design when researchers combine several relations in one group to prevent possible misunderstanding on part of human subjects. On the other hand, this might be an indication that actors themselves group similar relations into broader and therefore more robust classes of relations. There may be several reasons for doing this: (1) relations may be correlated, e.g. when one relation almost always implies another; (2) people may (mis-)perceive and assign varying importance to relations in an idiosyncratic fashion; (3) people may manipulate relations, e.g. using personal ties to gain power in an organization. In general, it seems hardly possible to disentangle the manifold of social interactions (group and dyadic, etc.) that make up social fabric. It is the joint network, made by juxtaposition of all relevant kinds of ties between actors, that matters in dynamics of processes based on social influence White (1992); White et al. (1976).
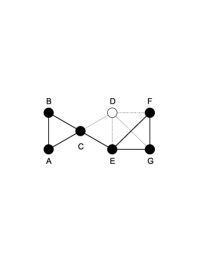
Consider attendance at social events, e.g. Davis’s Southern Women Davis et al. (1941); Wasserman and Faust (1994), or multiple affiliations, e.g. interlocking boards of directors in American companies Davis and Greve (1997), or different interaction contexts (high school students attending classes together vs going to the movies vs playing sports, and so forth). Each event, affiliation or context serves as an opportunity to create, maintain, or exercise (manipulate) group and interpersonal ties. The above examples can be represented by a bipartite graph Wilson (1982), in which one class of vertices represents events, and the second class is actors.333 Given the conceptual similarity of affiliation networks, social event attendance and multiple interaction contexts, in the discussion that follows we will take the liberty of using the terms “events”, “contexts” or “affiliations” interchangeably, unless specifically mentioned otherwise. If an actor participates in an event, there is an edge drawn between the respective vertices. To focus on the class of actors, we perform an operation that is called unipartite projection, i.e. transformation of a two-mode “affiliation” graph into a one-mode network that captures multiple social relations between the actors (Fig. 2). One-mode projections necessarily consist of many overlapping cliques.444 Note that a dyad is a clique of size two. Every such clique refers to one or several affiliations or interaction contexts. In the bipartite framework an affiliation tie is added to the network if an actor has participated in the given context. However, correlated contexts are somewhat redundant, in the sense that they contain much the same information about social structure. For example, take a group of coworkers spending a weekend at a picnic organized by their firm together with their spouses and children. The relationships at work and at the picnic may well be different but daily experience leads us to expect that people who are good colleagues in the work setting will be likely to socialize with each other in a semi-formal setting as well.555 This phenomenon involves a set of interesting hypotheses which are outside the scope of this paper but well deserve to be a focus of a separate research project. Do people tend to bring their acquaintances from one interaction context to another? If so, then under what circumstances does this happen? In particular, how does the probability of triadic closure, that is, probability that two friends, A and B, of some person C, will become friends themselves, depend on the number and intensity of shared social contexts with C?
The network approach has traditionally sought to separate different relational contexts for the sake of analytical tractability. A textbook definition of a social network Wasserman and Faust (1994) assumes a discrete set of actors linked together by a discrete set of relations. At the interpersonal level, social actors are almost always discrete, but difficulties arise when we try to disentangle interpersonal relations such as friendship, help, advice-giving, authority, esteem, influence, and so on. It is difficult to devise a classification scheme that is exhaustive, describes mutually exclusive relations and has identical meaning to every participating actor. Multiple relations are often correlated (e.g. Sampson’s data in White et al., 1976), that is, people tend to be friends with people that they like, esteem and can ask for advice, etc.; however, as we have pointed out, a micro-social mechanism that leads to this correlation is an open research problem.
Despite the complex structure of interpersonal relations or maybe as a consequence of it, the resulting pattern of connections is often perceived as a one-mode network: an overlap of multiple relations, which perhaps guarantees some protection against misinterpretation of questionnaire items by respondents or missing important interaction contexts by researchers, and which is certainly easier to represent and analyze. One-mode networks have been studied extensively in the recent years with a number of important analytic results obtained Albert et al. (2000); Barabási and Albert (1999); Callaway et al. (2000); Cohen et al. (2000, 2001); Newman et al. (2001); Watts and Strogatz (1998). However, this line of research has focused on simple models for the network (e.g. randomly mixed with respect to vertex degree), which are unlikely to hold in most real situations where both structural and attribute-based processes are important Girvan and Newman (2002); Watts et al. (2002); White (1992). We therefore propose that the multicontextual model of a social network (generated by a bipartite graph) has certain advantages over the models based on simple random graphs. Formulated in a suitable manner, it is analytically tractable Newman et al. (2001); Watts et al. (2002) and by definition takes care of certain properties observed in empirical social networks that are not easily reproducible with simple random graphs (such as high clustering).666 Some interesting questions that are related to networks with multiple affiliations or multiple interaction contexts are the following. How do network properties change if new interaction contexts emerge spontaneously? How should imputation strategies depend on whether actors create new affiliations in a competitive or cooperative environment? Having defined a social network with several interaction contexts, what is the minimal number of contexts (the core subset) such that structural characteristics are robust? These and related questions will be explored in future research by analyzing empirical network data and building simulation models.
2.3 An example: forensic data
While data collection quality in analysis of conventional social relationships (such as ‘friendship’ or ‘advice’ networks) may be improved by appropriate research design and cooperation on part of the participants, the situation in criminal investigation is exacerbated by the unfortunate fact that criminals seldom cooperate with law–enforcement agencies. Not infrequently, they engage in conspiracy in order to conceal their identities and the structure of criminal organization.
Since investigators typically proceed by expanding ego-networks of several main suspects, the key actors may be omitted due to ignored or unknown interaction contexts. Actors with false or multiple identities also introduce errors into the structural representation of the criminal group. A plausible conjecture is that links may be easier to uncover once we know the primary suspects (via surveillance). However, since we expand the circle of suspects by traversing interactions in certain contexts, missing links are of great importance, too.
As the result of conspiracy, some meetings, telephone conversations or email exchanges may not be recorded. The consequences are two-fold: first, investigators may be missing certain connections between actors in the main pool of suspects; second, since those connections lead to other potential suspects, truncated ties effectively hinder the course of investigation.777 It is a single connected component that investigators seek to obtain. If the unipartite projection of a criminal network consists of several disconnected components it probably means that available evidence is not sufficient to conclude that all actors belong to one criminal group. We interpret this type of missing data as the result of incriminating interaction contexts left outside the scope of analysis.
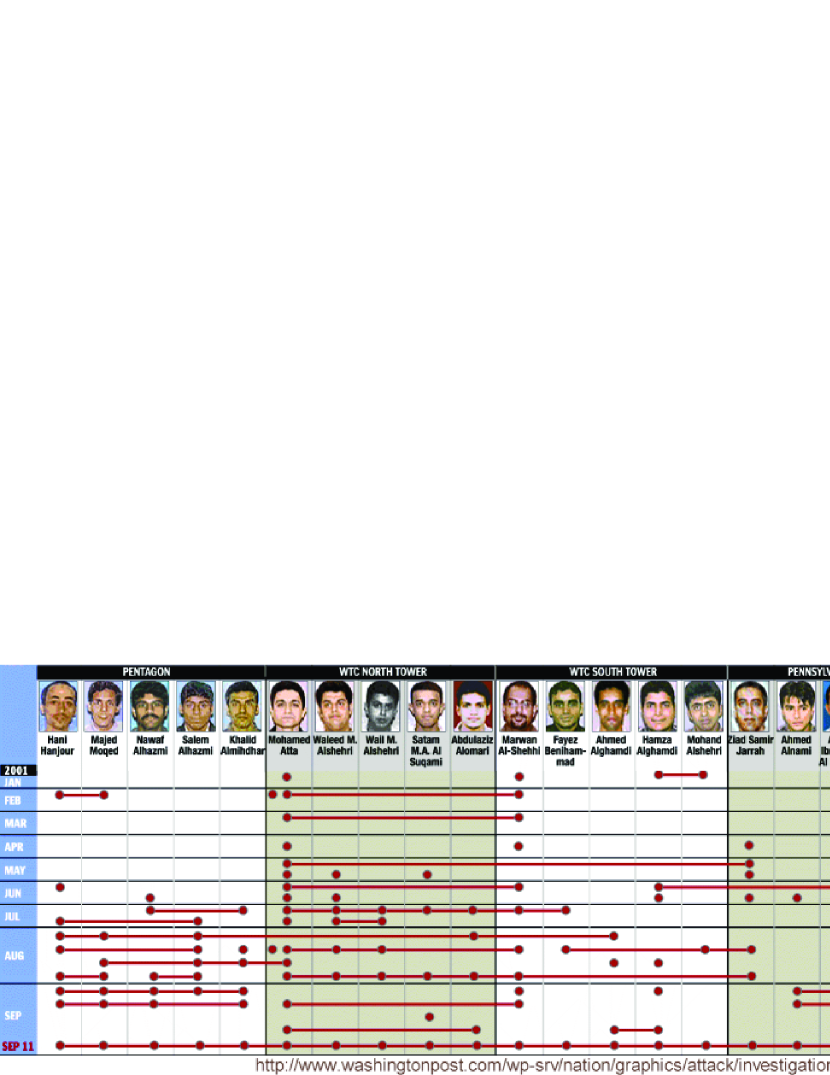
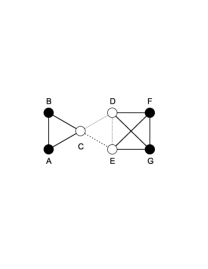
We suggest that it is natural to represent intelligence data as a bipartite graph, where suspects are linked to each other through participation in common actions that we call incriminating interaction contexts (Fig. 3). A single-mode actors network is in fact a unipartite projection of the intelligence database onto the set of suspects. A unipartite projection by definition implies multiple overlapping cliques.888 Actions performed by individual actors are important pieces of evidence that draw attention to these individuals (call them principal suspects). Once principal suspects are known, investigators may proceed with mapping the structure of criminal network by monitoring actors involved in certain contexts with the principal suspects (contextual ego-network expansion – snowballing on the bipartite graph). Every clique in a network of criminal organization refers to one incriminating context. It therefore follows from the bipartite framework that missing links usually do not occur alone: they are missing groups of links corresponding to missed interaction contexts.
Having emphasized the primacy of boundary specification problem in social network analysis, we now turn to more specific manifestations of missing data, namely non-response and design effects.999 The causes of non-response are outside the scope of this paper.
2.4 Non-response effects
The non-response effect in networks with multiple interaction contexts (modeled as bipartite graphs) is quite different from the same effect in single-mode (unipartite) networks. In a survey of an affiliation network, actors are asked to report groups to which they belong. Suppose that we have no other sources of information about affiliations. If any one actor fails to respond, all his affiliations are lost and the resulting missing data pattern becomes equivalent to the Boundary Specification Problem for actors which we model as stochastic omission of some fraction of actors from the network.
If however the survey asks actors to name peers with whom they interact (that is, ignoring the multiplexity of ties), then the non-response effect can be balanced out by reciprocal nominations Stork and Richards (1992). Suppose actor A did not fill in the network questionnaire. Yet those of A’s interactants who participated in the survey must have reported their interactions with A. Intuitively, one would expect that if the number of non-respondents is small relative to the size of the network, and the researcher does not require all nominations to be reciprocated (as a crude validity check), then the amount of missing data caused by non-response should be small if not negligible.101010 Consider a single-mode social network and retain links that are reported by a) at least one actor; b) both actors only (the reciprocated subset of nominations). In this paper we assume the first mechanism and treat the simplest case of actors not responding at random, but it would be interesting to consider situations with a) actors not responding with probability proportional to actor’s degree (call it “the load effect”); or b) actors not responding with probability inversely proportional to degree (“the periphery effect”).
2.5 Fixed choice designs
Another bugbear of network statistics is right-censoring by vertex degree (also known as “fixed choice effect” Holland and Leinhard (1973)). This missing data mechanism is often present in network surveys. Suppose that actor A belongs to groups whereby he is connected to other actors (Fig. 5a). In the unipartite case, the actor is requested to nominate up to persons from his list of interactants, e.g. “ best friends” (Fig. 5b). If the cutoff is greater than or equal to the actual number of friends (), we assume that all links between A and his friends are included in the dataset. If , actor A must omit links, but some of those might still be reported by A’s friends who are requested to make their nominations likewise. Thus some ties from the original network will be reported by both interactants (reciprocated nominations), some by only one partner (non-reciprocated nominations), and yet some will not be reported (censored links). It is left to the discretion of the researcher whether to include non-reciprocated links which may be qualitatively different from reciprocated ones (e.g., good friends vs casual acquaintances). Fixed choice nominations can easily lead to a non-random missing data pattern. For instance, certain actors may possess some great personal qualities and hence would be present on the “best friends” lists of many other actors. That is, popular individuals who have more contacts may be more likely to be nominated by their contacts Feld (1991); Newman (2003). What effect will this have on the structural properties of the truncated graph?
Generally speaking, selecting randomly from one’s list of friends does not generate a random sample of edges in the graph. The effect may be different depending on whether the network is mixed disassortatively or assortatively by degree Newman (2002a, b); Vázquez and Moreno (2003): in the first case, vertices with high degrees tend to be matched with vertices with less connections and therefore more censored connections are likely to be restored using reciprocal nominations. This is an example of how the network structure may interact with missing data mechanisms.
We simulate the fixed choice effect in the following two situations. First, we consider the bipartite case, i.e. networks with multiple interaction contexts or affiliations. We assume that actors are requested to report up to groups to which they belong. We perform sensitivity analyses for a number of properties of the unipartite projection as we vary the affiliation cutoff .
Secondly, we simulate a network survey in which actors nominate each other directly. To do this we analyze single-mode networks (i.e. unipartite projections of affiliation graphs) and keep links that are reported by a) at least one actor; b) both actors only. For the sake of simplicity we make the assumption that actors report peers randomly from their interactant lists.
3 Data and statistics of interest
3.1 Network-level statistics
As we wish to investigate how topological properties of the network are affected by the presence of missing vertices or edges, we measure the following graph-level properties of the unipartite projection onto actors: mean vertex degree (average number of interactants per actor), which characterizes network connectivity; clustering , that is, the probability that any two vertices with a mutual neighbor are themselves connected111111 There are several ways to measure clustering Watts (1999); Newman et al. (2001); Maslov et al. (2002). We adopt the following definition of clustering coefficient: , where is the number of triangles on the graph and is the number of connected triples of vertices. This definition is more representative of average clustering in cases when vertex degree distribution is skewed Newman et al. (2001).; assortativity , which is simply the Pearson correlation coefficient of the degrees at endpoints of an edge Newman (2002a, b); fractional size of the largest connected component ; and average path length in the largest component . We accept that the effect of missing data on parameter is tolerable if the relative error , where is an estimate from a model with missing data and is the respective “true” value calculated from all available data.
3.2 Data
We follow previous work in treating collaboration and affiliation graphs as proxies of multicontextual social networks Davis and Mizruchi (1999); Mizruchi (1996); Newman (2001). We illustrate the problem of missing data in networks using the example of the scientific collaboration graph containing authors and papers from the Condensed Matter section (“cond-mat”) of the Los Alamos E-print Archive from 1995 through 1999 Newman (2001) as well as random bipartite graphs. The properties of the dataset are summarized in Table 1.
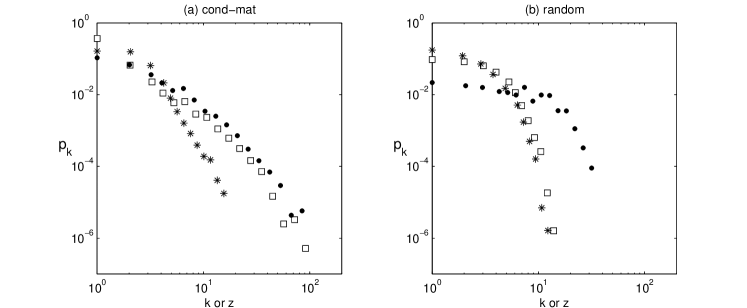
We compare the collaboration graph to an ensemble of 100 random bipartite graphs with the same number of vertices and edges, i.e. fixing the number of actors , number of groups , mean degree for actors and for groups121212 Actually, we need to fix only three parameters since . (Fig. 6b). The degree sequences are not fixed and so they have a Poisson distribution Bollobás (2001); Newman et al. (2001). In the Condensed Matter collaboration network, both the distribution of the number of authors per paper and the distribution of papers per author are considerably skewed to the left relative to the random model (Fig. 6a). The distribution of vertex degree in the one-mode coauthor network (i.e. the number of co-authors) resembles a power-law with exponential cutoff near (Fig 6a, dots) while the same distribution in a random graph exhibits the characteristic bimodal shape Newman et al. (2001) with a clear cutoff in the tail (Fig. 6b). In the unipartite projection of a random bipartite graph there are many vertices with a medium connectivity while very few vertices with a very large number of coauthors. The values of mean degree in the one-mode projection are for the cond-mat graph and for its random counterpart, which indicates a strongly non-random allocation of authors over papers in the Condensed Matter collaboration network. In both cases , which guarantees the existence of the giant connected component Bollobás (2001).
| Quantity | notation | cond-mat | random a |
|---|---|---|---|
| Number of authors | 16726 | 16726 | |
| Number of papers | 22016 | 22016 | |
| Mean papers per author | 3.50 | 3.50 | |
| Mean authors per paper | 2.66 | 2.66 | |
| Assortativity (degree correlation) | -0.18 | -0.054(4) | |
| Unipartite projection (collaborators): | |||
| Mean degree | 5.69 | 9.31(3) | |
| Degree variance | 41.2 | 33.9(6) | |
| Clustering | 0.36 | 0.223(1) | |
| Assortativity | 0.18 | 0.071(5) | |
| Number of components | 1188 | 652(18) | |
| Size of largest component | 13861 | 16064(18) | |
| Mean path in largest component | 6.63 | 4.728(8) |
-
a
A random bipartite graph of the same size and mean degree as the original network. Numbers in parentheses are standard deviations on the least significant figures calculated in an ensemble of 100 such graphs.
As seen from Table 1 the bipartite form of the Condensed Matter collaboration graph is disassortative () whereas its one-mode projection is assortative (). This implies that authors who work in smaller collaborations publish more papers on average; also, physicists with many collaborators tend to work with those of the same ilk; and similarly, physicists with a few coauthors who are, incidentally, most prolific ones, tend to collaborate with each other. 131313Additional simulations (not shown here) indicate that the presence of heavy-tailed group size distribution in a bipartite graph may cause assortativity in its one-mode projection onto actors. This lead us to suggest that assortativity of the one-mode Physics collaboration graph might be to some extent an artifact of the skewed distribution of collaboration sizes. In addition to providing curious insights into the mode of scientific production in Condensed Matter Physics, assortativity has important implications for network robustness Boguñá et al. (2003); Newman (2002a, b); Vázquez and Moreno (2003). A characteristic feature of assortatively mixed () networks is the so-called core group consisting of interconnected high-degree vertices. The core group provides exponentially many distinct pathways to connect vertices of smaller degrees. From an epidemiology point of view, the core forms a reservoir that is capable of sustaining a disease outbreak even though the overall network density is too low for an epidemic to occur. The good news, however, is that an outbreak in assortatively mixed networks is likely to be confined to a smaller subset of the vertices. Disassortative networks are particularly susceptible to targeted attacks on high-degree vertices due to the fact that the latter provide much of the global network connectivity Newman (2003).
Although a random graph is technically neutral (i.e. has zero assortativity), it may acquire some disassortativity as a finite-size effect, e.g. from the constraint forbidding multiple edges between two vertices Maslov et al. (2002); Newman (2003). In a similar fashion, random bipartite graphs exhibit disassortative mixing if the number of groups differs from the number of actors. This follows from the definition of a bipartite graph (no edges connect vertices of the same class) and the requirement that no actor belongs to the same group twice. The ensemble of random bipartite graphs simulated here exhibit small but significant disassortativity () while the corresponding one-mode networks are assortatively mixed by degree ().
It is important to keep in mind that clustering, assortativity (or generally, the mixing pattern) and degree distribution are not independent. In particular, disassortative mixing in simple graphs may cause a decrease in clustering by suppressing connections between high degree vertices in favor of vertices of lower degree, thus reducing the number of triads in the network Maslov et al. (2002); Newman (2003).
3.3 Algorithms
The outline of the simulation algorithm is as follows: (1) take a real social network or a corresponding ensemble of random graphs; assume that network data is complete; (2) remove a fraction of entities to simulate different sources of error; and (3) measure network properties and compare to the “true” values (from the complete network). As has been described, we model several missing data mechanisms. Table 2 summarizes our simulation models.
| Label | Problem | Model a |
|---|---|---|
| BSPC | Boundary Specification Problem for Contexts | Remove a fraction of contexts at random |
| BSPA | Boundary Specification Problem for Actors | Remove a fraction of actors at random |
| NRE | Non-response Effect | Remove links within subgraph induced by a specified fraction of actors |
| FCC | Fixed choice (contexts) | Apply censoring by degree to actors |
| FCA | Fixed choice (actors) | Create unipartite projection; apply censoring by degree; keep non-reciprocated links |
| FCR | Fixed choice (actors), reciprocated nominations only | Create unipartite projection; apply censoring by degree; keep only reciprocated links |
-
a
We measure properties of the unipartite projection in all models.
4 Results and discussion
4.1 Comparison of Boundary Specification and Non-Response Effects
The results of the simulations for the Condensed Matter collaboration graph and for comparable random bipartite networks are plotted on Figs. 7, 9–12. The proportion of missing data increases from left to right and at the leftmost point we assume that all information about the network is available. We model the Boundary Specification Problem for Contexts (BSPC) by randomly removing vertices of the corresponding class (“papers”) from the network. The Boundary Specification Problem for Actors (BSPA) is modeled as random deletion of vertices corresponding to “authors” in the case of collaboration network. Survey non-response is different from BSPA in that in the former vertices are not removed from the network but all edges between randomly assigned “non-respondents” are deleted.
Mean vertex degree. For a random bipartite graph, the mean degree in the unipartite projection onto actors decreases linearly with random removal of actors or groups: , where is a relative number of missing actors or groups, respectively141414 Here we have made use of the fact that the mean vertex degree in the unipartite projection of random bipartite graph, which is symmetrical with respect to changes in either or Newman et al. (2001). (observe overlapping curves in Fig. 7b). However, in the one-mode collaboration network average degree decreases slower in the simulation of BSPC (Fig. 7a, dots) than in BSPA (squares). This behavior implies non-random allocation of actors (authors) to groups (papers) and leads us to introduce the notion of “redundancy” in group affiliation.
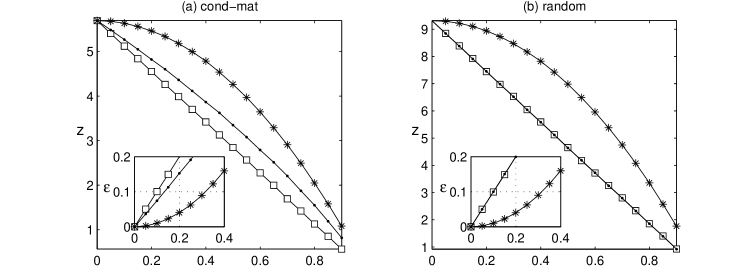
One way to capture the average importance of an interaction context is to measure what we call the redundancy of a bipartite graph. We define redundancy as , where is average number of groups per actor, is average size of the group, and is actual (observed) mean actor degree in the unipartite projection onto the set of actors. In a complete bipartite graph all affiliations but one are redundant in the sense that they connect actors who are already connected (Fig. 8a), consequently as (M is the number of affiliations). At the other extreme are acyclic bipartite graphs (Fig. 8b), in which if any two actors belong to the same affiliation it is the only affiliation they share, therefore and . Consider a bipartite graph such that every connected pair of actors have attended exactly three events together. The mean degree in the actors one-mode network will be , and redundancy therefore is . Redundancy of a random bipartite graph is expected to be close to zero since , which becomes exact as the graph size increases Newman et al. (2001). In general, high redundancy implies that as new interaction contexts emerge, they will likely link already connected actors. Redundancy of the Condensed Matter collaboration graph is , which means that if the collaboration sizes were sharply peaked around the mean, then about forty percent of collaborations could be omitted without any significant change in the structure of unipartite projection. However, this is not exactly the case here (Fig. 7a) because the group size distribution is quite skewed (Fig. 6a). There are certain important collaborations that serve as “hubs” that stitch together local groups of coauthors, which may increase the sensitivity of this network to BSPC. Also recall that the degree correlation coefficient in the original bipartite network is , implying that on average authors who work in smaller collaborations tend to be more productive (this fact may reflect the nature of the dataset and its limited time frame; see Newman, 2001).
As could be expected, due to counting in non-reciprocated nominations, the non-response effect is somewhat less severe than BSP and may be tolerated for response rates of 70% and better where the relative error is less than 10% (Fig. 7, insets).
Clustering. Random omission of actors (Fig. 9, squares) appears to have no effect on clustering in the unipartite projection. This result could be expected since all clustering is engendered via joint membership in groups, whose pattern is unaffected by random deletion of actors. It is intuitively plausible that interaction contexts are responsible for the resulting clustering and mixing pattern in the bipartite model of a social network. Fig. 9 (dots) implies that omission of contexts (BSPC) results in increased clustering. As has been mentioned above, each interaction context or group in a bipartite graph corresponds to a clique in the one-mode network of actors. If redundancy of the bipartite graph is sufficiently high, these cliques tend to overlap. As more interaction contexts are removed, cliques in the one-mode network disconnect from each other thus effectively reducing the number of connected triples of vertices while keeping the number of triads high. This causes the clustering coefficient to grow.
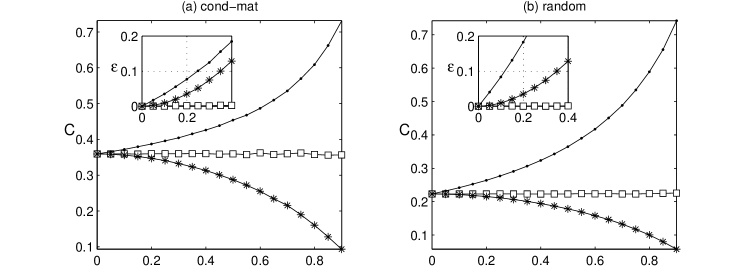
On the contrary, non-response (Fig. 9, stars) results in lower clustering. Since missing links under non-response are the ones that connect non-responding nodes and otherwise network connectivity is not affected, this mechanism opens up triples faster than producing dyads or isolates, and therefore the clustering coefficient is decreasing.
The relative deterioration rate (Fig. 9b, inset) depends on the “true” value of clustering. For one-mode networks generated from random graphs with Poisson degree distributions, clustering coefficient changes as in the case of BSPC, and is fairly close to under non-response, where denotes the fraction of missing groups or non-responding vertices, respectively. The first result follows trivially from the formula , derived by Newman et al. (2001); the second is our conjecture based on simulations.
It seems plausible that BSPC and non-response may compensate each other under some fortunate circumstances, yet separately they drastically affect the estimate of clustering coefficient and inflate the measurement error. Ironically, eliminating one source of error but not the other could severely impair the estimate of clustering in the network!
Assortativity. The simulation results plotted on Fig. 10 show that, as in the case of clustering, BSPC increases degree-to-degree correlation in the unipartite projection while non-response causes it to diminish, and ultimately leads to a disassortative mixing pattern. We should emphasize these facts as they increase the uncertainty about the estimates of clustering and assortativity in networks with unknown missing data patterns.
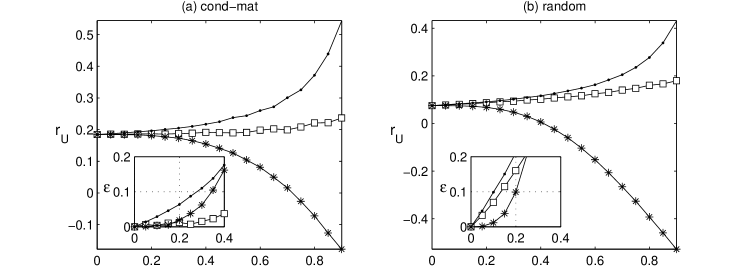
It has been shown that unipartite networks that are assortatively mixed by degree are more robust to removal of vertices than disassortative or neutral networks Newman (2002b). Several social networks, including the one-mode collaboration graph analyzed in this paper have been found to be assortatively mixed. In such networks, the assortative core can form a reservoir that will sustain the disease even in the absence of epidemic in the network at large (Section 3.2). As an application to epidemics control, these findings suggest a rather grim conclusion that social networks would sustain epidemic outbreaks whereas disease prevention strategies based on vaccination of high-contact individuals are doomed to fail.
Observe, however, that one tends to overestimate the mixing coefficient in networks with multiple interaction contexts as a consequence of the Boundary Specification Problem for Contexts (Fig. 10, dots) and, to a lesser extent, BSP for Actors. Therefore complete social networks may actually possess less assortativity than they appear to have, provided that researchers take measures to minimize non-response. This finding may turn out to be an important factor in cost-benefit analyses of disease prevention strategies that are based on empirical network data.
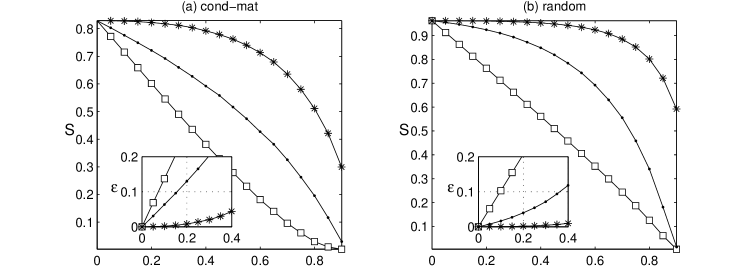
Size of the largest connected component. As can be seen from Fig. 11, the collaboration network is quite robust to survey non-response (stars): good estimates can be obtained with response rates of 70% and better (50% for random graphs with similar parameters). On the other hand, omission of actors (squares) leads to immediate and severe deterioration of the network connectivity. The effect of missing interaction contexts (dots) is somewhere in-between. From the modeling point of view, non-inclusion of actors (as well as actor non-response with required reciprocation, for that matter) is equivalent to the so-called “node failures” analyzed in several recent studies of computer networks Albert et al. (2000); Callaway et al. (2000); Cohen et al. (2000, 2001); Vázquez and Moreno (2003). This line of literature has focused on the effects that random failures or intentional attacks on Internet routers might have on the global connectivity properties of the Internet, such as the size of the largest connected component. In particular, it has been shown that for random breakdowns, networks whose degree distribution is approximated by a power-law remain essentially connected even for very large breakdown rates Cohen et al. (2000). It has been also demonstrated under quite general assumptions that disassortativity increases network fragility as it works against the process of formation of the giant component; on the other hand, assortative correlations make graph robust to random damage Vázquez and Moreno (2003). However, our simulation results do not fully agree with these notions. The one-mode coauthorship network is assortatively mixed and has a heavy-tailed degree distribution, while the projection of a random bipartite graph has near zero assortativity and quickly decaying degree distribution (Fig. 6 a and b respectively, dots). Yet under BSPA the size of the largest component decreases faster in the one-mode collaboration network (compare Fig. 11a and Fig. 11b, squares).
To separate possible effects of mixing pattern and degree distribution, we have run simulations with bipartite networks obtained by randomly rewiring the collaboration graph. These networks have the same degree sequences as the original bipartite graph but zero assortativity coefficient. The rewired networks behave very similarly to random graphs with Poisson degree distribution. An important difference, however, is that random removal of actors initially leads to a faster decrease in the size of the giant component , but for large removal rates approaches zero size continuously in a rewired network (not shown here), while both random graph and the original collaboration network exhibit a discontinuity (easily seen in the plot of average path length, Fig. 12). We conclude that a rewired version of the collaboration graph is more resilient to BSPA than the original, despite its lack of assortativity. Hence, assortativity alone does not necessarily imply network robustness, contrary to previous assertions, and may have substantially different implications for networks engendered via joint membership in groups or interaction contexts. The compound effect of the mixing pattern and degree sequences in such networks therefore deserves a further investigation.
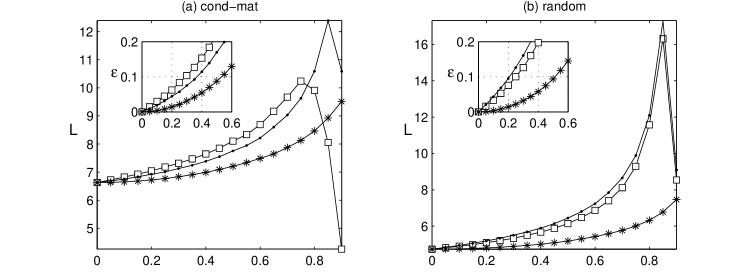
Mean path length in the largest connected component. As may be seen from Fig. 12, BSPA and BSPC have a similar effect on the average path length. Path length diverges when mean vertex degree becomes less than unity. Due to the skewed degree distribution of the Condensed Matter collaboration network BSPA has a stronger impact on mean degree than BSPC, and consequently, the phase transition (breakdown of the largest component into many small ones) occurs at for BSPA and for BSPC. The effects of missing data mechanisms on the mean path length may be tolerated (i.e. relative error not exceeding 10%) for amounts of missing data up to 20% in case of BSPA or BSPC, and for response rates of 50% and better in case of actor non-response.
4.2 Degree censoring (fixed choice effect)
We consider the impact of fixed-choice questionnaire design (right-censoring by vertex degree) on network properties in the following three cases: (1) we record up to interaction contexts out of average for every actor; (2) each actor nominates up to out of average interaction partners; the link is present if either one or both members of a dyad report it; (3) same as previous, but every dyadic link must be reported by both partners. Varying the cutoff values and , we have explored how these missing data mechanisms affect the unipartite social network under assumption of random nominations. Sensitivity curves for the mean vertex degree are shown on Fig. 13. The results for other statistics discussed in the previous sections are qualitatively similar to the corresponding BSP/non-response effects up to the direction of error (see Tables 3 and 4 for details).
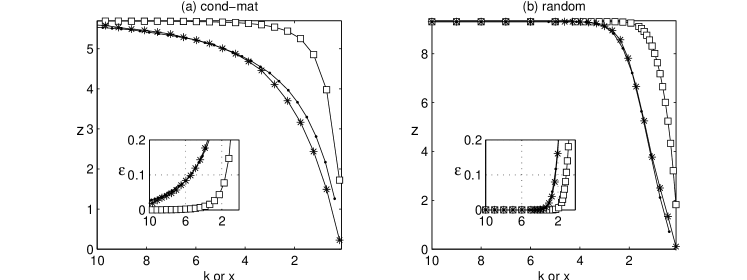
It appears that degree censoring has a much more severe effect on the Condensed Matter collaboration graph (left plot) than on a random bipartite network with the same parameters , and (right plot). In a random graph, a fixed choice of interaction contexts (collaborations) or reciprocated nomination of partners practically does not affect mean degree as long as relative cutoffs or . In the collaboration graph, however, mean degree departs from its true value as soon as the relative cutoff or becomes less than . As a consequence, this impairs estimates of such network properties as the number of components, size of the largest component and geodesics length (not shown). The effects of degree censoring on network properties are quantified in Table 4, where we report approximate minimal cutoff values such that parameter estimates are within around their respective true values. It is noteworthy that fixed choice errors are virtually non-existent in random graphs for relative cutoff values or . On the contrary, the real collaboration network appears to be very sensitive to degree bound effects.
While there may be a number of different mechanisms at work, it is likely that this difference in behavior is a joint effect of the non-random mixing and skewed degree distributions observed in the Condensed Matter collaboration graph. Censoring by degree has little effect on the random graph because its degree variance is quite small, i.e. it is rather sharply peaked around the mean. Therefore, when we cut edges in excess to, say, or in a random graph, the number of actually removed links is negligible. On the other hand, the distribution of papers by authors and the distribution of the number of collaborators in the one-mode network both have a heavy tail (Fig. 6), i.e. there is a considerable fraction of vertices with degrees greater than twice the average value. If the one-mode network is mixed assortatively by degree as in the case of the Condensed Matter graph, then degree censoring will likely eliminate most connections within the network core and quickly break down the giant component. Additional computer experiments (not shown) with a randomly rewired version of the cond-mat network, which has the same degree distribution but zero mixing, support this explanation. Whereas skewed actor degree distribution alone may have a limited impact on the robustness of network statistics with respect to the fixed choice effects, when present together with assortative mixing, it makes the network increasingly more sensitive. We would like to stress that one-mode projections of bipartite graphs, assortativity may arise as a structural artifact of a skewed group size distribution (see footnote 13), rather than being a substantive property of some network process. Hence it is important when doing empirical research that possible fixed choice effects be carefully examined if there are reasons to think that the network under study has been engendered by a multicontextual affiliation graph.
| Property of one-mode network | Symbol | BSPC c | BSPA d | NRE e |
|---|---|---|---|---|
| Mean degree | 0.14 (0.1)f | 0.1 (0.1) | 0.3 (0.3) | |
| Clustering | 0.25 (0.1) | n.a.g | 0.35 (0.35) | |
| Degree correlation | 0.3 (0.1) | n.a. (0.15) | 0.35 (0.2) | |
| Size of largest component | 0.15 (0.35) | 0.08 (0.1) | n.a. | |
| Mean path in largest component | 0.4 (0.2) | 0.3 (0.25) | 0.5 |
-
a
Missing data is tolerable if it causes relative error not exceeding 10%, i.e. , where is an estimate from a model with missing data and is the value calculated from complete data.
-
b
We use or to indicate the direction of departure of the estimate from the true value (up or down, respectively) for a small amount of missing data such that the network is kept above the percolation threshold, i.e. mean vertex degree .
-
c
Boundary specification for interaction contexts or affiliations
-
d
Boundary specification for Actors (missing actors)
-
e
Non-response, reciprocated nominations are not required
-
f
Numbers in parentheses are results for an ensemble of 100 random bipartite graphs with the same number of vertices and edges.
-
g
Very slow change: less than 10% error for 50% of missing data.
| Property (projection) | Symbol | FCC c | FCA d | FCR e |
|---|---|---|---|---|
| Mean degree | (2.5)f | (1) | (2.5) | |
| Clustering | (2.5) | (1) | (1.6) | |
| Degree correlation | (3.5) | (2.5) | (2.5) | |
| Size of largest component | (1.2) | (0.2) | (0.7) | |
| Mean path in largest component | (2) | (0.9) | (2) |
-
a
The degree cutoff is tolerable if the relative error caused by censoring , where is an estimate from a model with missing data and is the value calculated from complete data.
-
b
We use or , where applicable, to indicate the direction of departure of the estimate from the true value (up or down, respectively) for a small amount of missing data such that the network is kept above the percolation threshold, i.e. mean vertex degree .
-
c
Fixed choice of interaction contexts
-
d
Fixed choice of actors, reciprocation not required
-
e
Fixed choice of actors, only reciprocated nominations
-
f
Numbers in parentheses are results for an ensemble of 100 random bipartite graphs with the same number of vertices and edges.
5 Some implications for empirical analysis
In practice it might be difficult to estimate the effects of missing data and to identify and separate its sources. Therefore one should take measures against multiple possible missing data effects. The findings reported in this paper are based on a case study and statistical simulations of random graphs and therefore may not apply to all social networks. However, some of the results are quite general and enable us to offer some guidelines for researchers who have collected or plan to collect empirical network data, to help them be aware of potential pitfalls.
Our simulations indicate that three most severe missing data problems are: (1) boundary specification for interaction contexts (BSPC); (2) boundary specification for actors (BSPA); (3) fixed choice designs (usually FCA, i.e. actors nominating up to a certain number of partners). Boundary specification can dramatically alter estimates of network-level statistics, in particular, the assortativity coefficient and mean degree, even if context redundancy is large. In a fixed choice survey design, the errors introduced by missing data are relatively small up to certain degree cutoff values, which depend on the vertex degree distribution and mixing pattern; the worst case being networks with highly skewed degree distributions, which may produce unreliable statistics, especially in the presence of assortative mixing.
These results have the following implications. In studies which employ a fixed choice design (e.g. Bearman et al., 2002), if there are reasons to expect a heavy tail distribution, it is crucial to choose a relatively high degree cutoff to minimize the impact of missing data on network statistics. Furthermore, if the network is expected to be assortatively mixed, the fixed choice design might not be appropriate at all, and it would be better to use an open list questionnaire, i.e. allowing respondents to nominate as many partners as they deem relevant. Alternatively, one may want to first obtain rough estimates of the mean degree and its standard deviation using a small sample Granovetter (1976) and simply asking with how many actors from within the network a respondent has interacted during the specified period of time. If then at the step of collecting full network data one should employ an open list design or set the cutoff as high as possible.
A similar double-stage strategy might be appropriate, if not always feasible, for designs based on formal group affiliation to help minimize the amount of missing data due to the boundary specification problem. After the sociometric data is collected inside an organization, one should calculate the network diameter . At the second step, traverse via other relevant interaction contexts for removes outside the organization (since the longest possible cycle in the network is long). If the connectivity properties of the network (i.e. the number of components and average geodesic length) as well as clustering and assortativity coefficients do not change significantly, that implies that the organizational network in question is robust with respect to boundary specification. In the example of adolescent sexual network in a high school Bearman et al. (2002), if the above procedure indicated robustness then persons with outside partners could be modeled as having higher infection probabilities with the network model otherwise intact.
Finally, for forensic research it seems most important that the network of suspects is well-connected so that investigators can start from a few principal actors and “snowball” to the rest of suspects. As we have found that the size of the largest connected component is very sensitive to the omission of actors, an obvious recommendation would be to expand surveillance at the early stages in the investigation.
6 Conclusions
In this paper, we have set out to compare different missing data mechanisms in social networks with multiple interaction contexts. Social interactions are modeled as a bipartite graph, consisting of the set of actors and the set of interaction contexts or affiliations. The conventional single-mode network of actors is a unipartite projection of the bipartite graph onto the set of actors. We have measured structural properties of this projection while varying the amount of missing data in the generating bipartite graph by omitting actors, interaction contexts, or individual interactions. This paper has covered several missing data mechanisms; in particular, boundary specification and fixed choice survey design. As a proxy of a multicontextual social network we analyzed the Los Alamos Condensed Matter collaboration network and an ensemble of random bipartite graphs with similar parameters.
Since we have analyzed a specific empirical case and the corresponding ensemble of random networks, the findings reported herein may not be generalizable. With all due limitations, several results of particular significance follow from our studies. First, we found that assortativity coefficient is overestimated via omission of interaction contexts (affiliations) or fixed choice of affiliations. On the other hand, actor non-response or fixed choice of collaborators leads to an underestimated mixing coefficient and may even cause an assortatively mixed network to appear as disassortative. For example, this may explain why the adolescent romantic network Bearman et al. (2002) that was constructed using fixed choice nominations was found to be neutrally mixed by degree, in a stark contrast to the majority of known social networks Newman (2002b).
In a similar fashion, the observed clustering coefficient increases via omission of interaction contexts or fixed choice thereof, and decreases with actor non-response. The clustering coefficient is unaffected by random omission of actors since all clustering in the bipartite model of social networks is engendered via interaction contexts (group affiliation). The divergent effect of the two missing data mechanisms obviously results in inflated the measurement error. It is ironic that by eliminating one source of error (e.g., non-response) but not the other (boundary specification effect) one might actually end up with worse estimates of clustering or assortativity.
Finally, the confounding effect of mixing pattern and degree distribution on network robustness under random omission of actors is found to be different from what is assumed in the current literature. We have found that under certain circumstances a network assortatively mixed by vertex degree is less robust to random deletion of vertices than a comparable neutral network. As a tentative explanation, we attribute this peculiar behavior to the detailed structural composition of the networks that we have focused on; namely, the presence of multiple overlapping cliques in the one-mode network as a result of unipartite projection. Consequently, we would like to emphasize the importance of further research to better understand the roles and properties of multiple interaction contexts in the emergence, evolution, and study of social networks.
The results reported in this paper have been obtained using the method of numerical simulation. While this approach is frequently employed in statistics, it appears underrepresented in network research. However, we find that it is particularly well-suited for exploratory analysis of large-scale networks. Thanks to its power and flexibility, the method of statistical simulation shows promise as a useful addition to existing network analysis toolkits. We hope that the classification scheme and the systematic exploratory approach that we have presented will prove useful for further research in the field.
References
- Albert et al. (2000) Albert, R., Jeong, H., Barabási, A. L., 2000. Error and attack tolerance of complex networks. Nature 406, 378–382.
- Amaral et al. (2000) Amaral, L. A. N., Scala, A., Barthelemy, M., Stanley, H. E., 2000. Classes of small-world networks. Proceedings of the National Academy of Sciences of the USA 97, 11149–11152.
- Barabási and Albert (1999) Barabási, A. L., Albert, R., 1999. Emergence of scaling in random networks. Science 286, 509–512.
- Bearman et al. (2002) Bearman, P. S., Moody, J., Stovel, K., 2002. Chains of affection: The structure of adolescent romantic and sexual networks, ISERP Working Paper, Columbia University.
- Bernard et al. (1984) Bernard, H. R., Killworth, P., Kronenfeld, D., Sailer, L., 1984. The problem of informant accuracy: the validity of retrospective data. Annual Review of Anthropology 13, 495–517.
-
Boguñá et al. (2003)
Boguñá, M., Pastor-Satorras, R., Vespignani, A., 2003. Epidemic spreading
in complex networks with degree correlations.
URL http://arxiv.org/abs/cond-mat/0301149 - Bollobás (2001) Bollobás, B., 2001. Random Graphs, 2nd Edition. Cambridge University Press, Cambridge and New York.
- Breiger (1974) Breiger, R. L., 1974. Duality of persons and groups. Social Forces 53, 181–190.
- Callaway et al. (2000) Callaway, D. S., Newman, M. E. J., Strogatz, S. H., Watts, D. J., 2000. Network robustness and fragility: Percolation on random graphs. Physical Review Letters 85, 5468–5471.
- Cohen et al. (2000) Cohen, R., Erez, K., ben Avraham, D., Havlin, S., 2000. Resilience of the internet to random breakdowns. Physical Review Letters 85, 4626–4628.
- Cohen et al. (2001) Cohen, R., Erez, K., ben Avraham, D., Havlin, S., 2001. Breakdown of the internet under intentional attack. Physical Review Letters 86, 3682–3685.
- Costenbader and Valente (2003) Costenbader, E., Valente, T. W., 2003. The stability of centrality measures when networks are sampled. Social Networks (in press).
- Davis et al. (1941) Davis, A., Gardner, B., Gardner, M. R., 1941. Deep South. University of Chicago Press, Chicago, IL.
- Davis and Greve (1997) Davis, G. F., Greve, H. R., 1997. Corporate elite networks and governance changes in the 1980s. American Journal of Sociology 103, 1–37.
- Davis and Mizruchi (1999) Davis, G. F., Mizruchi, M. S., 1999. The money center cannot hold: Commercial banks in the us system of corporate governance. Administrative Science Quarterly 44, 215–239.
- Dodds et al. (2003) Dodds, P. S., Muhamad, R., Watts, D. J., 2003. An experimental study of search in global social networks, submitted to Science.
- Ebel et al. (2002) Ebel, H., Mielsch, L. I., Bornholdt, S., 2002. Scale-free topology of e-mail networks. Physical Review E 66, 035103.
- Feld (1991) Feld, S. L., 1991. Why your friends have more friends than you do. American Journal of Sociology 96, 1464–1477.
- Girvan and Newman (2002) Girvan, M., Newman, M. E. J., 2002. Community structure in social and biological networks. Proceedings of the National Academy of Sciences of the USA 99, 7821–7826.
- Granovetter (1976) Granovetter, M., 1976. Network sampling: Some first steps. American Journal of Sociology 81, 1287–1303.
-
Guimera et al. (2002)
Guimera, R., Danon, L., Diaz-Guilera, A., Giralt, F., Arenas, A., 2002.
Self-similar community structure in organisations.
URL http://arxiv.org/abs/cond-mat/0211498 - Holland and Leinhard (1973) Holland, P. W., Leinhard, S., 1973. Structural implications of measurement error in sociometry. Journal of Mathematical Sociology 3, 85–111.
-
Holme et al. (2002)
Holme, P., Edling, C. R., Liljeros, F., 2002. Structure and time-evolution of
the Internet community pussokram.com.
URL http://arxiv.org/abs/cond-mat/0210514 - Homans (1950) Homans, G. C., 1950. The Human Group. Harcourt, Brace & World, New York.
- Krebs (2002) Krebs, V. E., 2002. Mapping networks of terrorist cells. Connections 24 (3), 43–52.
- Laumann et al. (1983) Laumann, E. O., Marsden, P. V., Prensky, D., 1983. The boundary specification problem in network analysis. In: Burt, R. S., Minor, M. J. (Eds.), Applied Network Analysis. Sage Publications, London, pp. 18–34.
- Little and Rubin (2002) Little, R. J. A., Rubin, D. B., 2002. Statistical Analysis with Missing Data, 2nd Edition. Wiley-Interscience, Hoboken, NJ.
- Marsden (1990) Marsden, P. V., 1990. Network data and measurement. Annual Review of Sociology 16, 435–463.
-
Maslov et al. (2002)
Maslov, S., Sneppen, K., Zaliznyak, A., 2002. Detection of topological
properties in complex networks: Correlation profile of the Internet.
URL http://arxiv.org/abs/cond-mat/0205379 - Mizruchi (1996) Mizruchi, M. S., 1996. What do interlocks do? An analysis, critique, and assessment of research on interlocking directorates. Annual Review of Sociology 22, 271–298.
- Newman (2001) Newman, M. E. J., 2001. The structure of scientific collaboration networks. Proceedings of the National Academy of Sciences of the USA 98, 404–409.
- Newman (2002a) Newman, M. E. J., 2002a. Assortative mixing in networks. Physical Review Letters 89, 208701.
-
Newman (2002b)
Newman, M. E. J., 2002b. Mixing patterns in networks.
URL http://arxiv.org/abs/cond-mat/0209450 - Newman (2003) Newman, M. E. J., 2003. Ego-centered networks and the ripple effect. Social Networks 25, 83–95.
- Newman et al. (2002) Newman, M. E. J., Forrest, S., Balthrop, J., 2002. Email networks and the spread of computer viruses. Physical Review E 66, 035101.
- Newman et al. (2001) Newman, M. E. J., Strogatz, S. H., Watts, D. J., 2001. Random graphs with arbitrary degree distributions and their applications. Physical Review E 6402, 026118.
- Rapoport and Horvath (1961) Rapoport, A., Horvath, W. J., 1961. A study of a large sociogram. Behavioral Science 6, 279–291.
- Roethlisberger and Dickson (1939) Roethlisberger, F. J., Dickson, W. J., 1939. Management and the Worker. Harvard University Press, Cambridge, MA.
- Rumsey (1993) Rumsey, D. J., 1993. Nonresponse models for social network stochastic processes (Markov chains). Ph.D. thesis, The Ohio State University.
- Sampson (1969) Sampson, S., 1969. Crisis in a cloister. Ph.D. thesis, Cornell University.
- Simmel (1908) Simmel, G., 1908. Conflict; The Web of Group-Affiliations. Free Press, New York, 1964.
- Sparrow (1991) Sparrow, M. K., 1991. The application of network analysis to criminal intelligence: An assessment of the prospects. Social Networks 13, 251–274.
- Stork and Richards (1992) Stork, D., Richards, W. D., 1992. Nonrespondents in communication network studies: Problems and possibilities. Group & Organization Management 17 (2), 193–209.
- Strogatz (2001) Strogatz, S. H., 2001. Exploring complex networks. Nature 410, 268–276.
- Travers and Milgram (1969) Travers, J., Milgram, S., 1969. Experimental study of small world problem. Sociometry 32, 425–443.
- Vázquez and Moreno (2003) Vázquez, A., Moreno, Y., 2003. Resilience to damage of graphs with degree correlations. Physical Review E 67, 015101.
-
Washington Post Online (2001)
Washington Post Online, 2001. Retrieved 24 May 2003.
URL http://www.washingtonpost.com/wp-srv/nation/graphics/at%tack/investigation_24.html - Wasserman and Faust (1994) Wasserman, S., Faust, K., 1994. Social Network Analysis: Methods and Applications. Cambridge University Press, Cambridge and New York.
- Watts (1999) Watts, D. J., 1999. Small Worlds: The Dynamics of Networks Between Order and Randomness. Princeton University Press, Princeton, NJ.
- Watts et al. (2002) Watts, D. J., Dodds, P. S., Newman, M. E. J., 2002. Identity and search in social networks. Science 296, 1302–1305.
- Watts and Strogatz (1998) Watts, D. J., Strogatz, S. H., 1998. Collective dynamics of ‘small-world’ networks. Nature 393, 440–442.
- White (1992) White, H. C., 1992. Identity and Control: A Structural Theory of Social Action. Princeton University Press, Princeton, NJ.
- White et al. (1976) White, H. C., Boorman, S. A., Breiger, R. L., 1976. Social structure from multiple networks. I. Blockmodels of roles and positions. American Journal of Sociology 81, 730–780.
- Wilson (1982) Wilson, T. P., 1982. Relational networks: An extension of sociometric concepts. Social Networks 4, 105–116.