Local mean-field study of capillary condensation in silica aerogels
Abstract
We apply local mean-field (i.e. density functional) theory to a lattice model of a fluid in contact with a dilute, disordered gel network. The gel structure is described by a diffusion-limited cluster aggregation model. We focus on the influence of porosity on both the hysteretic and the equilibrium behavior of the fluid as one varies the chemical potential at low temperature. We show that the shape of the hysteresis loop changes from smooth to rectangular as the porosity increases and that this change is associated to disorder-induced out-of-equilibrium phase transitions that differ on adsorption and on desorption. Our results provide insight in the behavior of 4He in silica aerogels.
pacs:
64.60.-i,68.45.Da,75.60.EjI Introduction
The influence of quenched disorder on phase transitions and critical phenomena continues to be the focus of intensive experimental and theoretical research activity. Major effects are expected and actually observed when the disorder couples linearly to the order parameter of the system, a situation that is realized when a fluid or a fluid mixture is confined within a porous glass or is in contact with the interconnected strands of a gel. A dilute rigid network is a particularly interesting medium from a theoretical perspective because exclusion (i.e., confinement) effects do not play a dominant role, so that the random-field Ising model (RFIM) may be a useful framework to interpret the experimental observationsBG1983 .
A striking example of the influence of a gel network on fluid phase behavior is provided by the thermodynamic studies of Chan and co-workers on 4He in silica aerogels of varying porosity. Silica aerogels are highly porous, fractal-like solids made of a tenuous network of SiO2 strands interconnected at random sites. In a porosity aerogel, specific heat and adsorption (vapor-pressure isotherm) measurementsWC1990 performed in the vicinity of the critical temperature of the pure fluid (=5.195K) show evidence of a phase separation between a low-density “vapor” phase (presumably composed of 4He vapor plus a liquid film around the silica strandsLMPMMC2000 ) and a high-density “liquid” phase filling the whole pore space. The first-order transition appears to terminate at a sharply defined critical point that is only 31mK below , which suggests that the system is in a weak random-field regime. The coexistence boundary in the presence of aerogel is, however, much narrower than in the pure system. Subsequently, similar results were obtained with N2 in the same aerogel, using light scattering and vapor-pressure isothermsWKGC1993 . Since out-of-equilibrium and hysteretic effects due to domain formation are generally observed in random-field systems below the critical temperature of the pure system (as illustrated by the behavior of binary mixtures in aerogelsBFC1997 and diluted antiferromagnets in a magnetic fieldB1998 ), it is noteworthy that no hysteresis is present in the measurements performed in Refs.WC1990 ; WKGC1993 . The gel-fluid system has thus reached equilibrium within the time scale of the experiments, which is indeed found much longer than the characteristic time of activated dynamicsWKGC1993 . The situation changes, however, at lower temperatures and the adsorption of 4He in a porosity aerogel is clearly hysteretic at 3.60K and 2.34KC1996 ; TYC1999 . Both adsorption and desorption isotherms display a vertical step at well-defined pressures, but draining occurs at a lower pressure than fillingnote2 . The shape of the hysteresis loop, moreover, depends on the porosity of the aerogel: in an aerogel of 87% porosity, 4He adsorbs and desorbs gradually at 2.42K and there is no signature of a “liquid-vapor” phase coexistence (see Fig. 4(c) in Ref.TYC1999 ). Such hysteretic behavior is reminiscent of capillary condensation in a low-porosity solid like Vycor glass where one observes a rapid increase of the adsorbed quantity at a pressure below the bulk saturated vapor pressure, but no sharp vertical step in the adsorption isothermsE1967 . The mechanism for hysteresis in porous substrates has prompted much discussion in the literature and various explanations have been proposed, focusing either on single-pore metastability à la van der Waals or on network pore-blocking effectsBE1989 . Since both models seem completely inadequate to describe light aerogels, the 4He experiments raise several questions: what is the scenario for the change in the shape of the hysteresis loopsnote3 ? Do filling and draining obey different mechanisms? What is the true equilibrium behavior when hysteresis is present?
These questions are addressed in the present work where we build on our earlier studies of capillary condensation in disordered porous solidsK2001 ; K2002 ; R2003 , but focusing on aerogels. We are mainly interested in the influence of the porosity on the hysteretic behavior of sorption isotherms. This is partly motivated by theoretical studies of the zero-temperature RFIM which predict the existence of a disorder-induced out-of-equilibrium phase transition in the hysteresis loopS1993 . The first experimental observations of this phase transition have been recently reported in the literatureB2000 , and we argue that the change in the 4He adsorption isotherm from sharp to smooth can be interpreted within the same framework. We propose a different scenario for draining and we relate the observed behavior to an out-of-equilibrium phase transition associated to the depinning of the liquid-vapor interface. The approach we develop is similar to that used previously for calculating the irreversible behavior of spin glasses, random-field ferromagnets and diluted antiferromagnetsSLG1983 ; it consists in studying the evolution of the free-energy surface (more precisely, the grand-potential surface ) as the external driving field (here, the pressure of the external vapor or, equivalently, the chemical potential ) is changed. is a functional of the local fluid density and is treated in the mean-field approximation. At low temperatures this multidimensional free-energy landscape is characterized by a large number of local minima in which the system may be trapped. The main physical assumption underlying our description is that thermally activated processes play a negligible role on the time scale of the experiments (in other words, the dynamics is similar to that at ). The evolution of the system then proceeds either continuously by the deformation of the local minimum in which the system is trapped or when this latter becomes unstable by a jump to another minimum (avalanche); the response to the driving field is then discontinuous and irreversible. Since it is impossible to perform such a study for a continuous model because of computational limitations (especially when finite-size scaling analysis is required near phase transitions), we adopt a lattice-gas description that incorporates at a coarse-grained level the geometric and energetic disorder of the gel-fluid mixtureKKRT2001 . Previous work has shown that many of the phenomena observed in experiments on fluids in disordered porous solids can be reproduced qualitatively by such simple lattice modelsK2001 ; K2002 ; R2003 ; WSM2001 . As in other studies of phase transitions in aerogelUHR1995 ; STC1999 , we model the solid by a fractal structure obtained by diffusion-limited cluster-cluster aggregation.
The paper is organized as follows. In Sec. II, we introduce the lattice model and discuss some important features of the aerogel structure. In Sec. III, we present the local mean-field theory and describe the numerical procedure. The results for the adsorption, desorption, and equilibrium isotherms in and porosity aerogels at are given in Sec. IV. The final section presents a summary and conclusions.
II Lattice model and aerogel structure
The lattice model used in this work describes the solid as a collection of fixed impurities that exert a random yet correlated (by the connectivity of the strands) external field on the atoms of the fluid. The Hamiltonian is given byPRST1995 ; KRTP1998
| (1) | |||||
where is the usual fluid occupation variable () and is a quenched random variable that characterizes the presence of gel particles on the lattice (when , site is occupied by the gel); and denote, respectively, the fluid-fluid and solid-fluid attractive interactions, is the fluid chemical potential, and the double summations run over all distinct pairs of nearest-neighbor (n.n.) sites. One can thus vary the gel porosity, , by changing the number of solid sites or modify the “wettability” of the solid surface by changing the ratio . For , the model reduces to a site diluted Ising model, as can be seen by transforming the fluid occupation variable to an Ising spin variable, KRTP1998 : preferential adsorption of the liquid phase onto the gel is thus modeled by . Random fields are generated in the system when , and the fluctuating part of the field acting on spin is proportional to the number of solid particles that occupy the nearest neighbors of site KRTP1998 . This a discrete random variable that can take the values , where is the coordination number of the lattice, and whose probability distribution is strongly porosity-dependent.
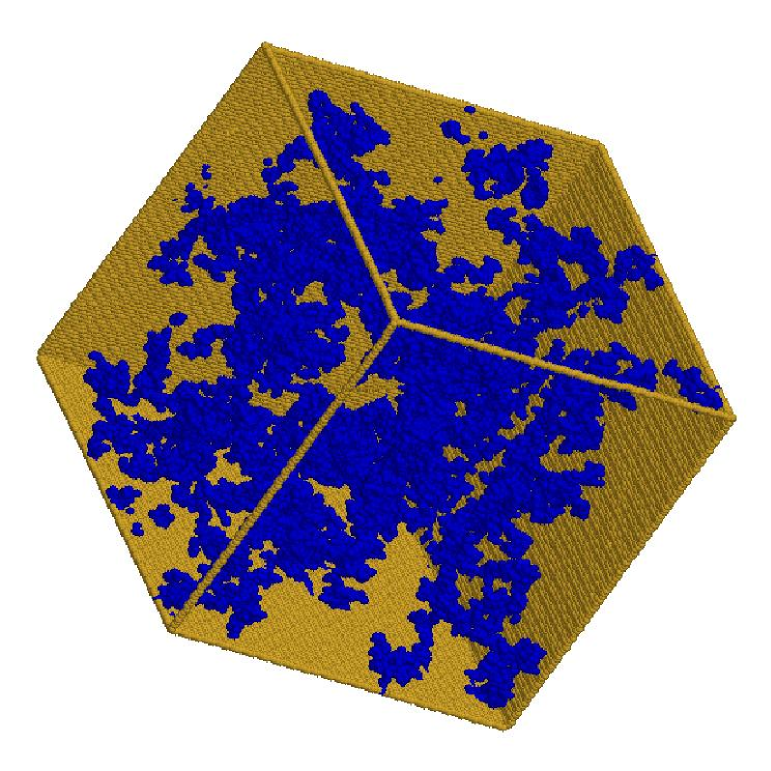
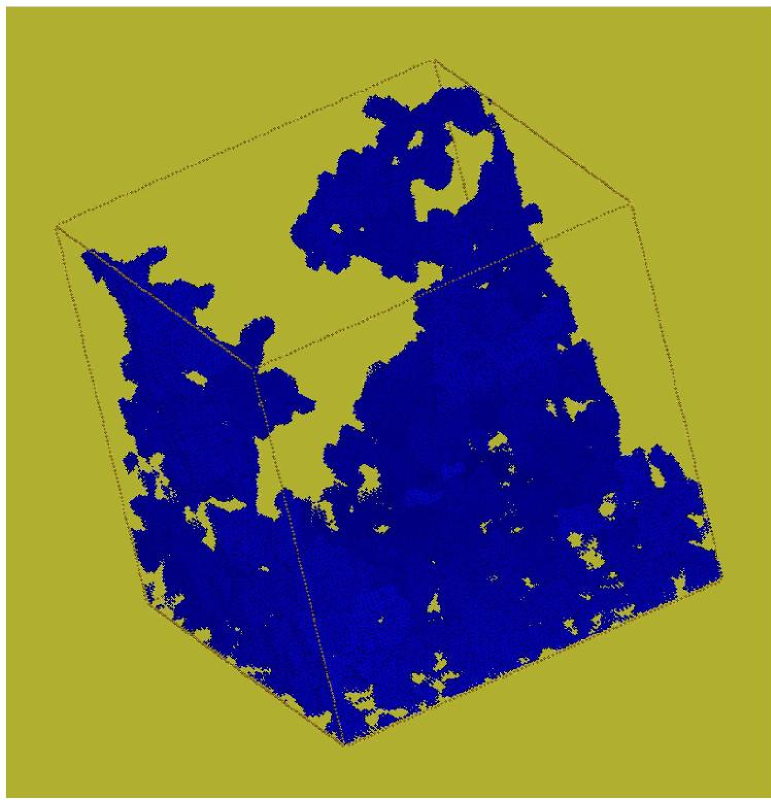
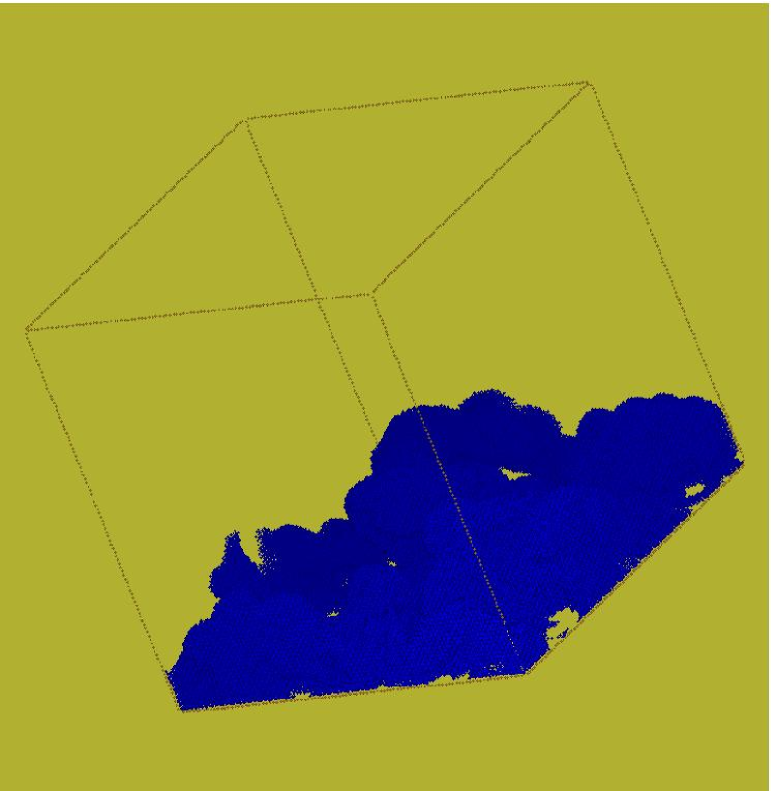
Gel configurations (i.e., sets ) are generated by a standard on-lattice diffusion-limited cluster-cluster aggregation (DLCA) algorithmM1983 adapted to a body-centered cubic (bcc) lattice with periodic boundary conditions. The choice of the bcc lattice will be motivated in Sec. IV.B. The DLCA algorithm mimics the growth process of base catalyzed aerogels used in helium experiments, and it has been shown to reproduce the main structural features of these aerogels measured from scattering experimentsH1994 . A typical exemple of a porosity DLCA aerogel on a lattice of linear size is shown in Fig. 1 (from now on, we take the lattice constant as the unit length; the total number of sites in the lattice is thus ). One can clearly see the fractal-like character of the gel network that results from the aggregation mechanism.
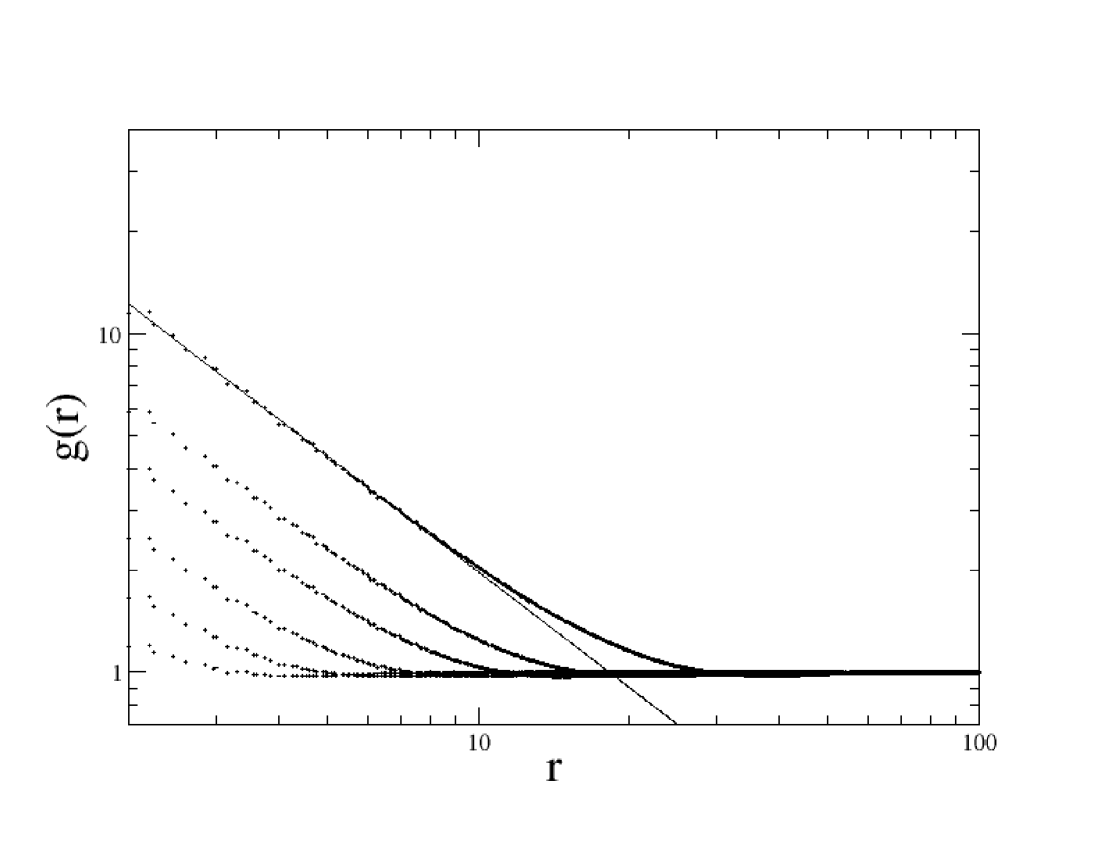
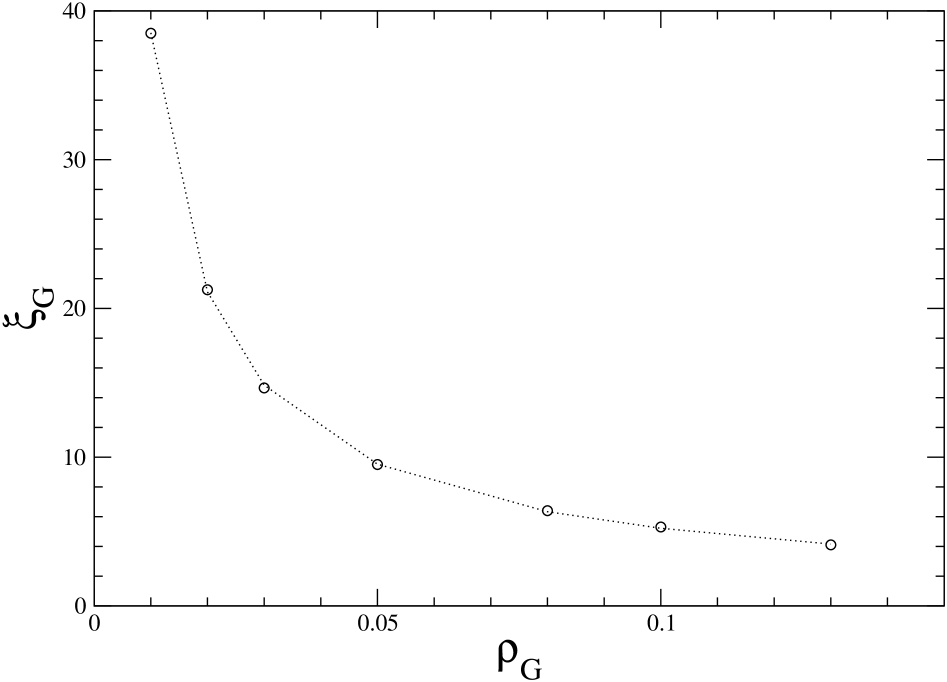
More quantitative information on the structural properties of the gel can be extracted from the two-point correlation function . Each curve shown in Fig. 2 corresponds to a different porosity and results from an average over several simulations in a box of size (for ) or (for ). Only the most dilute samples exhibit a true intermediate regime described by the power-law behavior revealing the fractal character of the intra-cluster density-density correlationsnote4 . For , one finds , a value that lies in the range expected for DLCA in three dimensions. Note, however, that the fractal dimension decreases with increasing porosityL1998 , so that the asymptotic value must be somewhat smaller. Another estimation of can be obtained from the average cluster size by assuming that varies as , where is the gel concentration. As suggested in Ref.H1994 , can be estimated from the location of the first minimum of (which is hardly visible on the scale of Fig. 2). The plot of versus shown in Fig. 3 yields . Since the correlation length is in the range for a base-catalyzed aerogelLMPMMC2000 ; LKMP2000 and in the simulation, one can estimate that the lattice constant corresponds to about . This is consistent with the coarse-grained picture of a gel site representing a Si02 particle with a diameter of about .
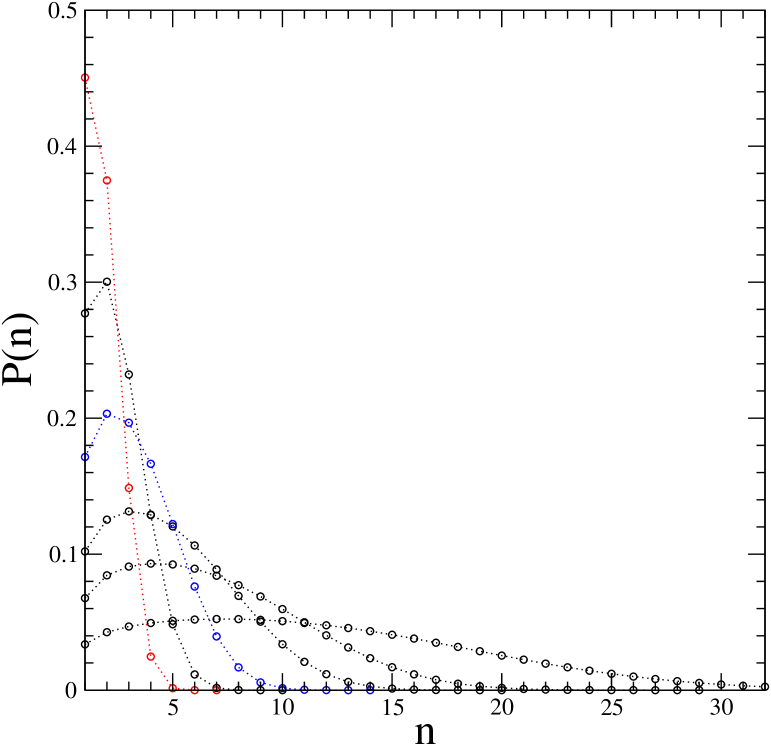
Another relevant length scale is the size of the largest cavity in the aerogelPP1999 . Fig. 4 shows the distribution of nearest distances from an empty site to the aerogel as a function of porosity (the integer “distance” is defined here as the length of the shortest path on the lattice from an empty site to a gel site; means that the empty site is n.n. of a gel site). The plot is the normalized histogram of these distances and gives the probability of being closer than to the aerogel. One can see that the size of the largest cavity is for a aerogel and decreases to for a aerogel and to for a aerogel. It is noticeable that the distribution changes significantly when decreasing the porosity from to . In the former case, has its maximum at and there is a significant proportion of empty sites that are not in the immediate vicinity of the gel. In the latter case, is monotonic and strongly peaked at , which indicates that most of the empty sites are very close to the gel. We shall see in section IV.A that these differences have important implications for the behavior of the fluid during adsorption.
It is clear from Fig. 3 that the minimum system size necessary to describe correctly collective effects occuring inside the aerogel on long length scales (like a sharp condensation event in the whole pore space) depends strongly on the porosity. For instance, a box of linear size is not large enough to represent the whole pore space of a aerogel because it does not contain a sufficient number of connected fractal aggregates (a problem that cannot be cured by merely increasing the number of realizations). Within the framework of local mean-field theory, it is however impossible to simulate much larger lattices because the computational time and the memory storage requirement become prohibitive (at finite temperature, the local fluid densities are continuous variables, which forbids the use of bits algorithms). In the present work, we consider and aerogels for which we can investigate the statistics of collective events while working with lattices of reasonable size (between and ).
Since it has been shown previously that the interface between the porous solid and the bulk gas may have a dramatic effect on the desorption processR2003 , two different setups are considered. In the first one, the system is periodically replicated in all directions so that no interfacial effects are taken into account. In the second setup an interface is created by placing a slab of vapor of width (the gas “reservoir”) in contact with one of the faces of the simulation box. Periodic boundary conditions are then imposed in the and directions and reflective boundary conditions in the direction (obtained by reflecting the lattice at the boundaries).
In order to completely specify the model, one must also fix the value of the interaction parameter . As shown previouslyR2003 , the shape of the hysteresis loops changes with . Since it is meaningless in a coarse-grained picture to compute from the actual values of the fluid-fluid and solid-fluid van der Waals interactions, we have chosen its value so as to reproduce approximately the height of the hysteresis loop in the aerogel at low temperature. Specifically, the results presented in this work are calculated with , a value for which the filling of the aerogel at the lower closure point of the hysteresis loop is roughly the same as in the experiment at K (i.e., at ). This corresponds to about of the filling reached at the plateau just before saturation, as can be seen in Fig. 4(c) of Ref.TYC1999 (see also Fig. 5(a) below). All calculations are done at this single reduced temperature (recall that in the mean-field approximation).
III Local mean-field theory (LMFT) and numerical procedure
For the present model, the LMFT consists in solving the self-consistent equations for the thermally averaged fluid densities obtained from minimizing the mean-field grand-potential functionalK2001
| (2) | |||||
The variational procedure gives a set of coupled non-linear equations
| (3) |
where and the sum runs over the nearest neighbors of site . At low temperature, these equations may have several solutions, and the grand potential corresponding to solution is given byK2002
| (4) |
By using an iterative method to solve Eqs. (3), one only finds solutions that are only local minima of the grand-potential surface, i.e., metastable statesSLG1983 .
For a given realization of the aerogel, the sorption isotherms (i.e., the curves ) are obtained by increasing or decreasing the chemical potential in small steps . At each subsequent , the converged solution at (on adsorption) or at (on desorption) is used to start the iterations. The isotherms are then averaged over a number of gel realizations depending on the system size. In order to determine the equilibrium isotherms, we have also searched for additional solutions of Eqs. (3) inside the hysteresis loop by performing scanning trajectories, as explained below in section IV.C.
To accelerate the convergence of the numerical procedure, the iterations have been updated (i.e., the new value of is substituted into the r.h.s. of Eqs. (3) before waiting for the rotation through the indices to be complete) and the evolution of each site density has been monitored in the following way. Fluid sites are divided into two categories, active and passive. At the beginning of the calculation, all sites are active and the procedure stops when all sites are passive. At each iteration only active sites are considered and their new density is calculated using Eqs. (3). If , where denotes the th iteration, the site becomes passive; otherwise its remains active and its nearest-neighors become (or remain) active (some sites can thus be passive during a few iterations and become active again).
The advantage of this algorithm is that the number of active sites may quickly become a small fraction of the total number of sites, which of course significantly reduces the overall computation time. For instance, the number of active sites is only when a planar liquid-vapor interface propagates through the system. The algorithm is useful in dilute aerogels because of the presence of large cavities. We have checked that the numerical results are not different (to the precision of the calculations) from those obtained without updating or with using a more standard convergence criterion, like in our previous studies of fluid adsorption in random matricesK2001 ; K2002 ; R2003 . Convergence (to an accurracy of ) typically requires between to iterations, and several CPU hours on a GHz workstation are needed to calculate a single adsorption isotherm in a system of linear size (using a step or to increment the chemical potential). The search for equilibrium isotherms is much more time consuming (see below in Sec. IV.C) and has been made possible by using parallel computation on a Beowulf cluster of processors.
IV Results and discussion
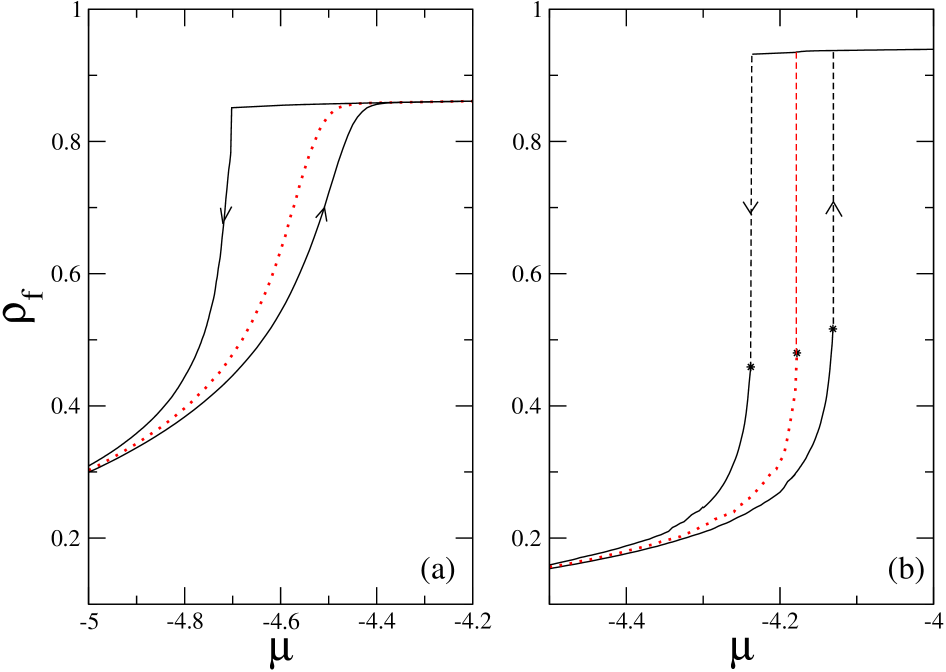
The results of the present study are summarized in Fig. 5 that shows the adsorption, desorption, and equilibrium isotherms calculated for the and model aerogels for and (from now on, is in units of , the fluid-fluid interaction parameter). These curves result from the detailed numerical analysis described in the following and correspond to the thermodynamic limit. The most striking feature is the change in the shape of the hysteresis loop from smooth to rectangular as the porosity increases. This change is similar to that observed experimentally by Chan and co-workers (see Figs. 4(b) and 4(c) in Ref.TYC1999 ). As is explained below, we predict that the three isotherms (adsorption, desorption, and equilibrium) are discontinuous in the aerogel (at least within mean-field theory where thermal fluctuations are neglected). The underlying physical mechanisms are, however, quite different.
IV.1 Adsorption
We first examine the adsorption process. Calculations performed in the presence and in the absence of a gel/reservoir interface yield isotherms that are almost indistinguishable (except for the smallest system sizes), confirming the conclusion reached in our previous workR2003 that adsorption does not depend on the existence of a free surface. This is also in line with the results of previous calculations done in single slit-like or cylindrical poresMVS1989 .
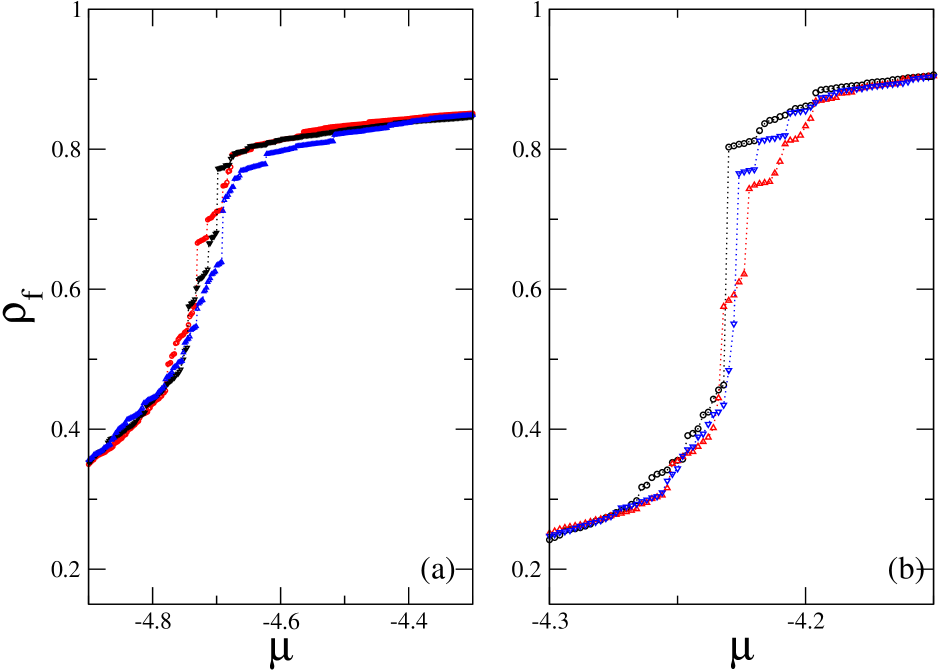
In Figs. 6(a) and 6(b) are shown some adsorption isotherms calculated in and porosity samples of linear size and , respectively (this corresponds to roughly the same ratio ). In both cases, we focus on the region where the adsorption is the steepest (see Fig. 5). At lower coverages, the isotherms look gradual and smooth in the two systems, but as increases, they consist of little steps of varying sizes. In the aerogel, the size of these “avalanches” remains small all the way up to the slowly increasing plateau that extends to saturation. On the other hand, in the aerogel, the size of the jumps tends to increase with and in most of the samples there is a large final avalanche after which the filling is almost complete (there are however some rare realizations where the last jump is not much larger that the preceeding ones, as illustrated by one of the isotherms in Fig. 6(b)).
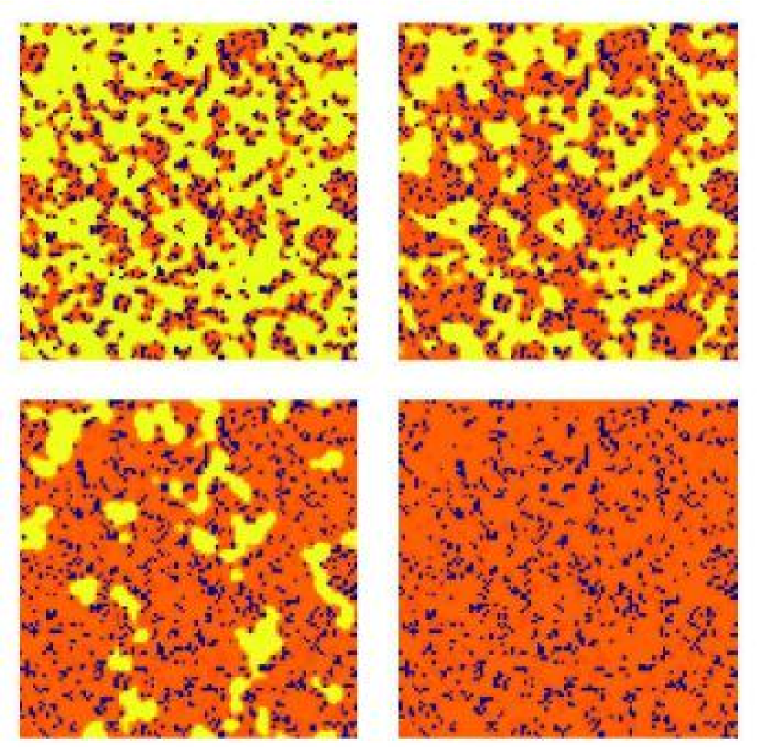
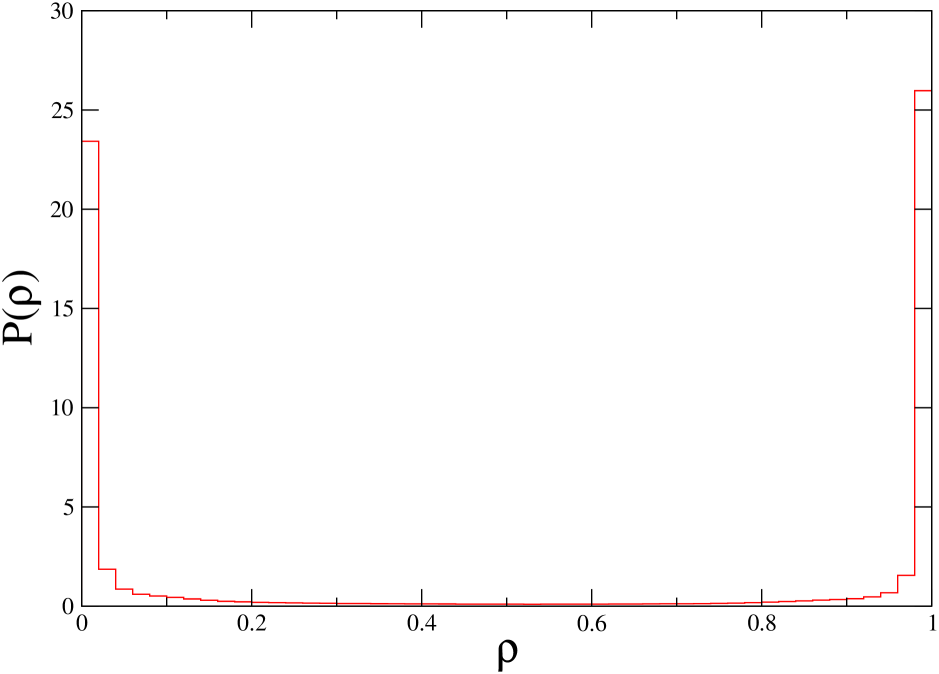
In order to better visualize the underlying microscopic mechanism, we show in Figs. 7 and 8 some cross-sections of typical and porosity samples for different values of the chemical potential along the isotherms (here, the size of both systems is ). One can see that in both aerogels the first stage of the adsorption process is the formation of a liquid layer that coats the aerogel strands. Then, as increases, the film thickens and condensation occurs in the smallest crevices defined by neighboring gel strands. In the aerogel, it is difficult to discriminate between these two filling processes because the available empty space is small, as illustrated by Fig. 4. For the same reason, the vapor bubbles that remain in the system at are isolated, and, as they shrink in size, the adsorption continues gradually until the solid is completely filled with liquid. This is precisely the scenario described in Ref.TYC1999 from the experimental observations with 4He. This is also similar to what happens in a low-porosity glass like VycorPLAHDW1995 . On the contrary, in the sample, one clearly distinguishes the small capillary condensation events that occur in some regions of the aerogels (compare the figures for and ) and the major final event that corresponds to the filling of a large void space spanning the whole sample (as is increased from to ). Note that the local “liquid-vapor” interfaces inside the gel are very sharp at this low temperature, which explains why one can only distinguishes two different regions in Figs. 7 and 8. Indeed, as illustrated in Fig. 9 for the lighter aerogel, it is found that the distribution of the ’s is bimodal, with most of the fluid sites having a density lower than or larger than (the distribution is similar in the porosity aerogel with just a little more intermediate densities).
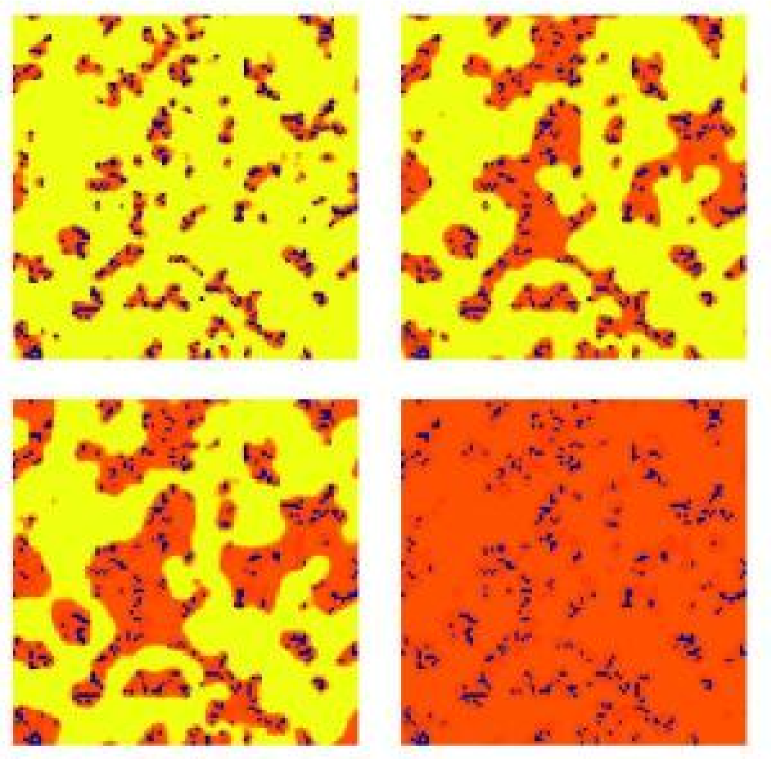
From these results (see for instance the cross-section of the aerogel at ), there is no indication that the radius of curvature of the liquid-vapor interface is concave and uniform throughout the sample just before the major condensation event, as was suggested in Ref.TYC1999 . This makes unlikely any interpretation in terms of a traditional capillary condensation model based for instance on the application of the Kelvin equationLMPMMC2000 ; GBBC2003 . Indeed, condensation in the remaining void space is itself triggered by a condensation event that occurs in one (or several) small region of the aerogel and that induces further condensation in the system. This collective behavior in the form of avalanches of varying sizes is similar to that of the Gaussian RFIM at proposed by Sethna and co-workers to describe the Barkhausen effect in low-T ferromagnetic materialsS1993 . Increasing slowly the chemical potential of the adsorbed fluid is equivalent to increasing adiabatically the applied field in a ferromagnet, and changing the porosity of the aerogel modifies the amount of quenched disorder in the system. In the RFIM, the amount of disorder is controlled by the width of the random-field distribution: only small avalanches are observed for large disorder, resulting in a smooth hysteresis loop, whereas one macroscopic avalanche produces a discontinuity in the magnetization for small disorderS1993 ; PV2003 . The transition between these two regimes for a certain value of the disorder corresponds to a critical out-of-equilibrium phase transition at which the distribution of avalanches follows a power law.
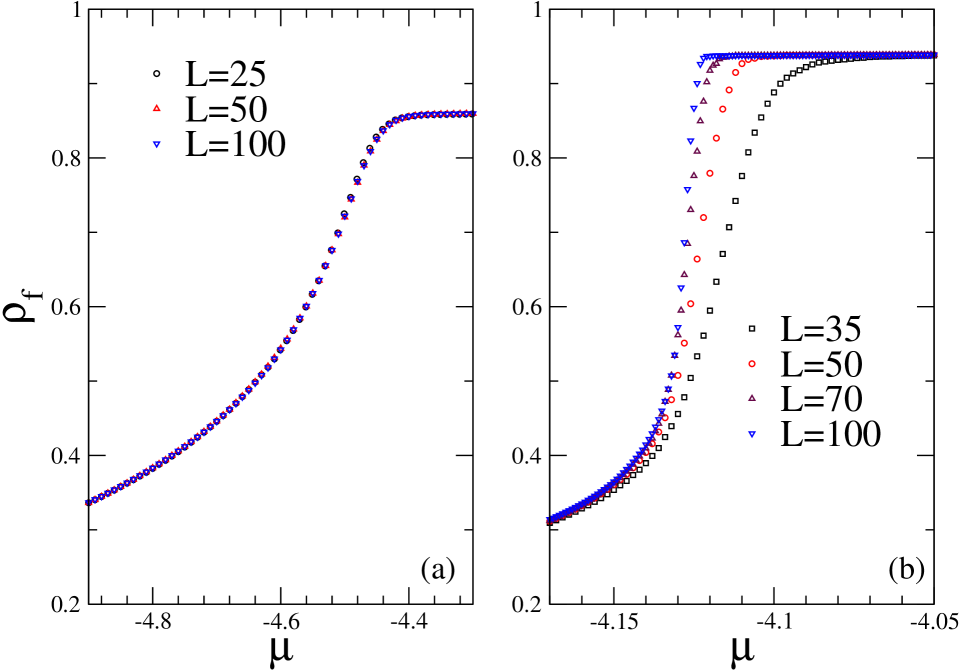
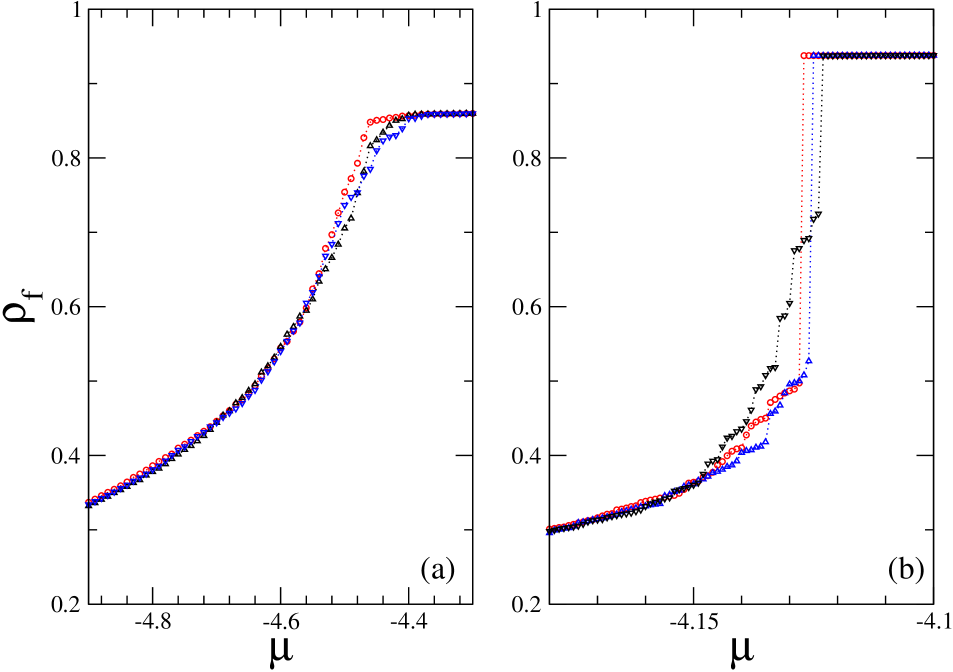
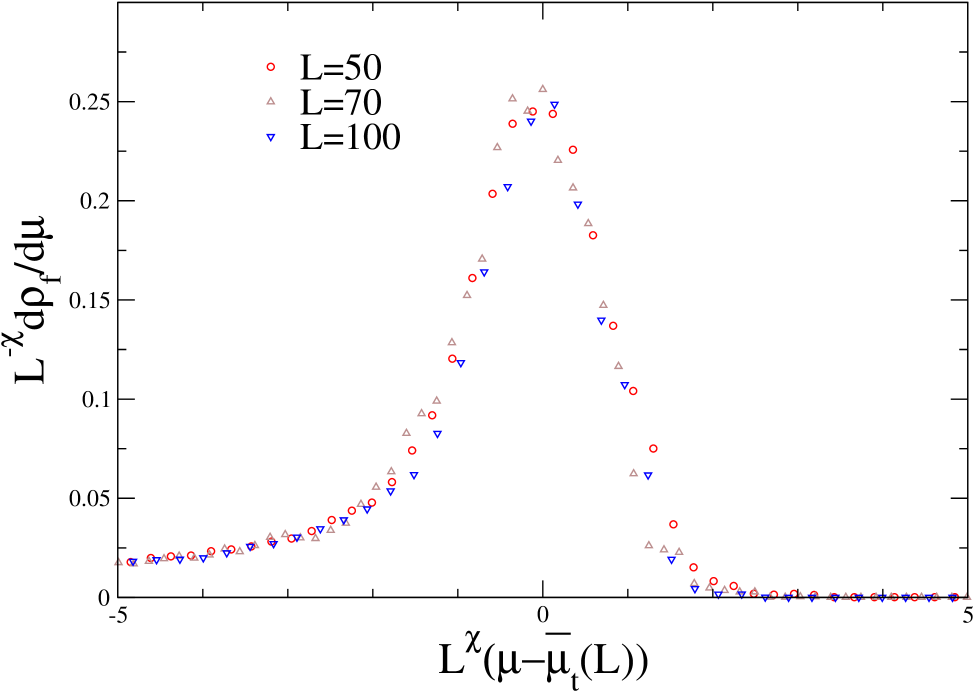
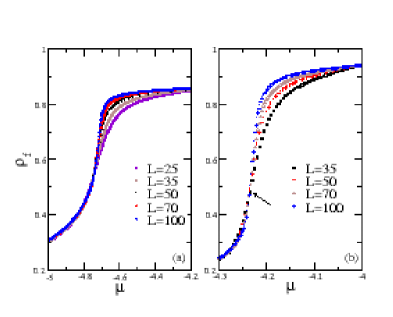
The existence of a major condensation event in most of the samples of size therefore suggests that there is one macroscopic (i.e., infinite) avalanche in the thermodynamic limit, corresponding to a finite jump in the adsorption isotherm. However, this can be only confirmed by performing a finite-size scaling analysis of the isotherms obtained after averaging over many gel realizations. We indeed observe significant sample-to-sample fluctuations both in the location and the height of the largest jump. Such average isotherms are shown in Fig. 10. For the aerogel, there is obviously no size-dependence and we can safely conclude that the adsorption is gradual in the thermodynamic limit. On the contrary, in the lighter aerogel, the isotherms look steeper and steeper as the system size is increased and the results suggest that there is indeed a discontinuity when (the isotherm corresponding to is shown here for completeness, but this size is probably too small to describe properly a aerogel). As we discussed elsewhereK2002 in the case of fluid equilibrium behavior in purely random solids, one expects that the maximal slope of the isotherms should scale as at a first-order transition (assuming that the location of the largest jump fluctuates around its mean value with a variance ). As shown in Fig. 11, one can obtain a reasonably good collapse of the and irreversible “compressiblity” curves by using the scaling variable with .
There are at least two possible explanations for the discrepancy with the expected value . Firstly, the system sizes could still be too small so that too many gel realizations would have a non-typical behavior, with several avalanches of similar heights (note that in a coarse-grained picture of a gel-fluid system where a region of size is represented by a single effective spin, there would be only about such effective spins in a sample of size ). Secondly, one may be close to the critical value of the disorder, i.e., the critical value of the porosity for and , for which the infinite avalanche first appears. Studies of the RFIM have moreover shown that the critical region is unusually largeS1993 . The value is compatible with the predictions of Sethna and co-workers, with note5 , although one cannot also exclude that the exponents differ from those of the conventional RFIM because of the presence of impuritiesT1996 . In any case, it seems reasonable, on the basis of the present calculations, to predict the existence of a phase transition with most probably a discontinuity in the adsorption isotherm in the thermodynamic limit, as shown in Fig. 5(b).
IV.2 Desorption
As discussed elsewhereR2003 , fluid desorption in disordered porous solids can take place via several different mechanisms, depending on the temperature and on the structural and energetic properties of the solid (in Ref.R2003 , however, only the influence of the interaction parameter , i.e., of the wetting properties of the adsorbed fluid, was described). In a first mechanism, desorption is due to the appearance of vapor bubbles in the bulk of the material, bubbles that grow, coalesce, and eventually extend over the whole pore space. The mass adsorbed then decreases continuously. In the other mechanisms, draining of the solid starts from the surface, and the desorption is associated to the penetration of a vapor-liquid interface which was previously pinned by the irregularities of the solid structure for larger than some threshold value (the “depinning”threshold). The desorption curve is then either gradual or discontinuous, depending on whether the growth of the vapor domain is isotropic and percolation-like (self-similar), or compact (self-affine). In those cases the transition is however always critical because the scale of the rearrangements of the interface diverges as . This is very similar to the physics of fluid invasion in porous mediaCR1988 , although we are considering here a single compressible fluid, and of field-driven domain wall motion in disordered magnetsKR2000 .
In order to find what are the relevant mechanisms in the and aerogels for and , we have studied the two systems in the presence and in the absence of the interface with the gas reservoir. In the latter case, we find that emergence of vapor bubbles in the bulk of the solid only occurs at low values of the chemical potential ( and for and aerogels, respectively), very close to the value corresponding to the liquid (mean-field) spinodal of the bulk fluid at . This shows that the perturbation induced by the solid is too small to displace significantly the liquid spinodal. On the other hand, the contact with the ambiant vapor at the surface of the gel has a major influence, as illustrated in Fig. 12 by typical desorption isotherms calculated in the presence of a free surface. One can see that when decreasing the chemical potential all the curves exhibit a pronounced drop much before vapor bubbles appear in the bulk of the material. This is a clear indication that the mechanism of desorption is due to the surface.
The isotherms shown in Fig. 12 consist of many steps of varying size, but it also appears that one step is significantly larger than the other ones in most of the samples, a feature that is not present in the isotherms of the aerogel. This suggests that the growth morphology of the invading vapor domain may change with the porosity. This is confirmed by the snapshots displayed in Figs. 13 and 14 that show the invading vapor domain in two typical and samples when about of the fluid has drained out of the aerogel. This is just after the onset of the sharp drop in the isotherms. As in the case of adsorption, we find that the distribution of the ’s is bimodal in this range of chemical potentials, with most of the fluid sites having a density lower than or larger than . One can thus identify unambiguously the emptied sites. Although the volume occupied by the vapor is the same in the two samples (about sites), the morphology of the domain is remarkably different. In the aerogel, the vapor domain exhibits an intricate isotropic structure that resembles that produced in invasion percolation. In contrast, the domain looks compact with a self-affine interface in the lighter aerogel. This is very similar to the two regimes observed in the RFIM when an interface separating two magnetic domains is driven by an external fieldJR1992 : when the disorder is large, the interface forms a self-similar pattern with a large-scale structure characteristic of percolation, whereas the growth is compact and the domain wall forms a self-affine fractal surface at intermediate degrees of disorder (note that the use of the body-centered cubic lattice has allowed us to suppress the faceted growth regime that is observed at in the porosity aerogel on the simple cubic latticenote6 ; this regime is an artifact of the lattice description).
In order to confirm the existence of two growth regimes and to determine the actual behavior in the thermodynamic limit, a finite-size scaling analysis of the desorption isotherms is required. Average isotherms calculated for different system sizes are shown in Fig. 15. By analogy with the problem of a driven interface in the RFIM, one expects that the total volume of the invading vapor domain shows a power law divergence at the depinning threshold . Then, assuming that the only relevant length scales near are the sytem size and a single correlation length , the dependence of on sytem size should be described by the scaling form where is the fractal dimension characterizing the domain and is a universal function of the scaling variable JR1992 .
In both aerogels, one observes important finite-size effects (see Fig. 15), but, unfortunately, they are not only due to the existence of a diverging correlation length in the system but also to boundary effects. There is indeed an initial regime in which desorption is due to the draining of large crevices at the surface of the gel where the fluid is in direct contact with the ambiant vapor. For a given porosity, the number of these crevices is proportional to and the contribution to the fluid density is thus proportional to . It turns out that this initial regime extends to rather low values of the chemical potential ( and for the and aerogels, respectively), so that the scaling region around the depinning threshold is too small to be studied properly and to extract the values of the critical exponents (such an effect is not present in the numerical studies of domain growth in the standard RFIMKR2000 because there is a different random field on each site of the lattice and no equivalent of the crevices). We note, however, that the curves in Fig. 15(b) have a common intersection at , in contrast with those in Fig. 15(a). This is consistent with the scaling ansatz for the volume of the invading vapor domain with for the aerogel and for the aerogel. We thus conclude that the desorption seems to be discontinuous in the first case and gradual (percolation-like) in the second one.
This leads to the isotherms shown in Fig. 5. Their shape resembles that of the experimental curves in Figs. 4(b) and 4(c) of Ref.TYC1999 . The minor differences can be rationalized: the experimental isotherm in the aerogel (Fig. 4(c) in Ref.TYC1999 ) does not exhibit a sharp kink at , but this rounding may be due to the activated processes that are neglected in the present treatment; Fig. 4(b) in Ref.TYC1999 corresponds to a aerogel, which probably explains why the shape of the hysteresis is more rectangular than in the present Fig. 5(b).
IV.3 Equilibrium
In order to determine the equilibrium isotherms, one has to find, for each value of , the lowest lying state(s) among all the metastable states obtained from Eqs. (3). A complete enumeration of these states is, however, an impossible numerical task, and like in previous workK2001 ; K2002 , we have only calculated a limited number of states that, hopefully, can provide a good approximation of the equilibrium isotherm. This can be checked a posteriori by using the Gibbs adsorption equation which is only satisfied by the equilibrium curveK2001 . In Refs.K2001 ; K2002 , we searched for metastable states inside the hysteresis loop by starting the iterative procedure with initial configurations corresponding to uniform fillings of the lattice (with varying between and ). This method, however, does not converge in dilute aerogels because the structure is very inhomogeneous and correlated, at least for distances smaller than . It is then likely that all metastable fluid configurations are also very inhomogeneous and cannot be reached iteratively from initial uniform fillings. We have thus searched for metastable states by calculating desorption and adsorption scanning curves, i.e., by performing incomplete filling or draining of the aerogel and then reversing the sign of the evolution of the chemical potential. For convenience, these (very long) calculations are done in systems with periodic boundary conditions in all directions, i.e., in the absence of an interface with the reservoirnote7 .

Some typical desorption scanning curves are shown in Figs. 16(a) and (b). In both cases, the top curve is the major desorption branch, and by comparing with the isotherms shown in Figs. 12 or 15, it is clear that the part of this branch extending to low ’s and corresponding to liquid-like metastable states that are isolated from the other states is an artifact coming from the absence of the interface with the reservoir. We also notice that there are no scanning curves in the upper part of the hysteresis loop for the sample. This is because there is a jump in the adsorption isotherm and, thus, there are no intermediate states from which desorption can be started. Therefore the states contained in this region of the plane cannot be reached by performing scanning trajectoriesnote8 . (Further work is clearly needed to determine if there are no metastable states at all in this region or if the states can be obtained by other means, for instance by changing the temperature.)
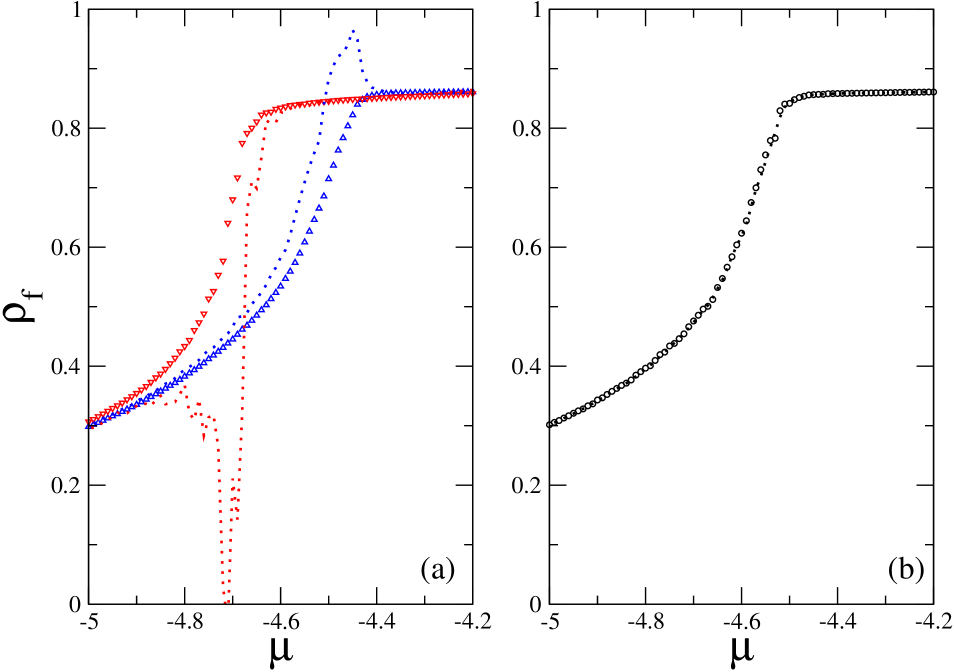
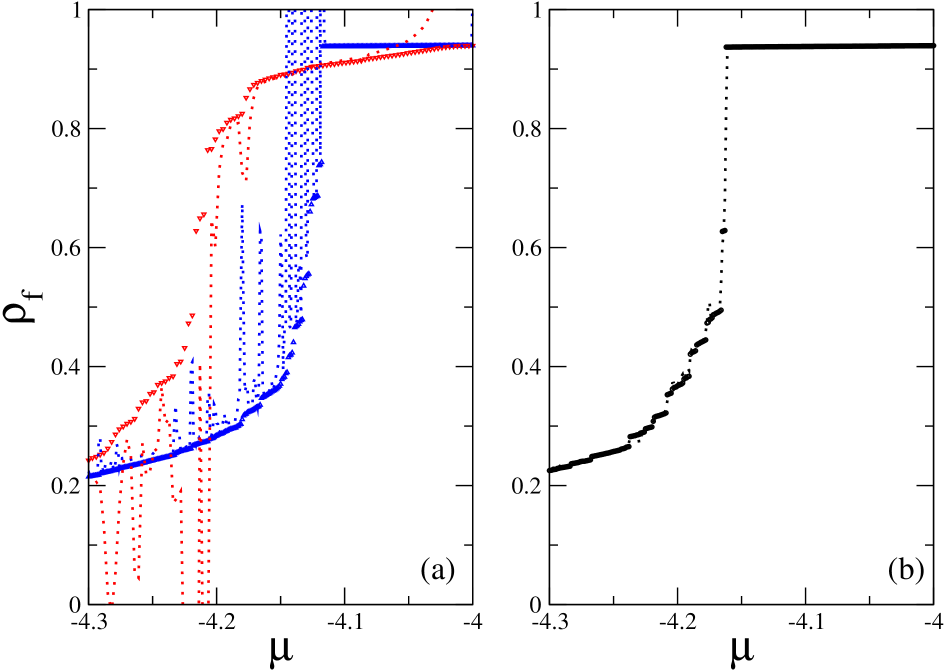
Fig. 16 also shows the approximate equilibrium isotherms obtained by selecting, for each value of , the state that gives the lowest value of the grand potential, as calculated from Eq. (4). We have checked that taking into account the additional metastable states obtained from the adsorption scanning curves did not change significantly the results (as in Ref.K2002 , we have also checked that keeping all solutions with a weighting factor equal to the Boltzmann factor gives the same isotherms). As illustrated in Figs. 17 and 18, the Gibbs adsorption equation is very well verified along these curves. This indicates that we have indeed obtained a good approximation of the true equilibrium isotherms. In contrast, thermodynamic consistency is strongly violated along the adsorption and desorption branches. The presence of (delta) peaks in also shows that the grand potential changes discontinuously (as the fluid density ) during adsorption and desorption in a single finite sample. On the other hand, is continuous (but is discontinuous) along the equilibrium isotherm, as already noticed in Ref.K2002 .
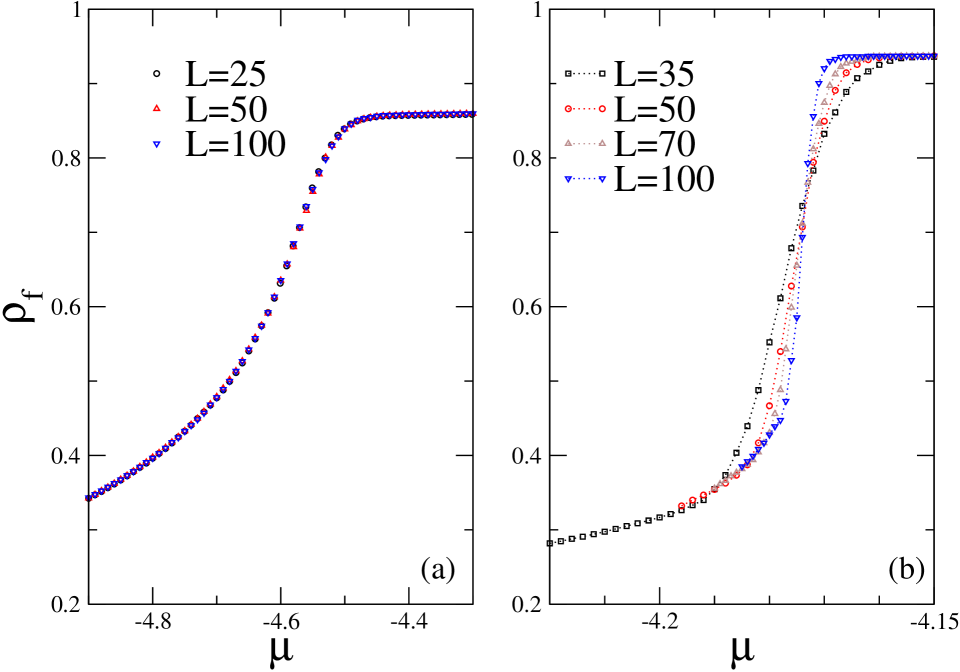
One can see from Figs. 16(a) and 16(b) that the equilibrium behavior is different in the and porosity aerogels. In particular, there is a large final jump in the isotherm of Fig. 16(b). The same feature exists in all samples, but in order to conclude on the actual behavior in the infinite system one has again to analyze the size-dependence of the average isotherms. This is shown in Fig. 19. For the aerogel, there is almost no size-dependence and it is clear that no transition occurs when . On the other hand, for the aerogel, the isotherms become steeper as increases and there is a rather well defined common intersection at . This is a clear indication that a phase transition does occur in the thermodynamic limit. However, we have not succeeded in obtaining a satisfactory collapse of the isotherms using the scaling reduced variable as was done in Ref.K2002 in the case of a random solid. The origin of this problem is still unclear, but we suspect that the system sizes are again too small. Indeed, we note that the maximal slope increases rather weakly between and , but has a size-dependence consistent with the exponent between and . We thus conclude that our results are consistent with a discontinuous jump in the thermodynamic limit, as indicated in Fig. 5(b). This corresponds to a true equilibrium liquid-vapor phase separation in the system.
V Summary and conclusion
In this paper, we have proposed an interpretation of the hysteretic behavior observed in the experiments of 4He adsorption in light silica aerogels. The overall shape of the experimental hysteresis loops is well described by our theoretical model and we have been able to reproduce the dramatic influence of porosity. In this interpretation, the disordered character of the aerogel structure plays an essential role, the porosity being the tunable parameter that controls the amount of disorder in the system. The history-dependent behavior is thus associated to the presence of many metastable states in which the system may be trapped and that prevent thermal equilibration at low temperatures. The most important conclusion of our study is that adsorption and desorption obey to different mechanisms and may be gradual or discontinuous, depending on the porosity. Adsorption is insensitive to the presence of the interface between the solid and the external vapor, and the change in the shape of the isotherm from smooth to discontinuous as increases from to has been related to the appearance of a infinite avalanche occuring in the bulk of the system, similar to what happens in the RFIM below the critical disorderS1993 . In contrast, desorption is triggered by the presence of the outer surface and an associated depinning transition. The change in the shape of the isotherm is then related to a change in the morphology of the invading vapor domain from percolation-like to compact (note however that the mechanism may be different in aerogels of lower porosityD2003 ).
One must keep in mind that our calculations are based on local-mean field theory in which disorder-induced fluctuations are properly accounted for but thermal fluctuations are neglected. This appears to be a reasonable assumption at very low temperatures where the time scale associated to thermally activated processes is much larger than the experimental time scale. In this case, both the adsorption and desorption branches are metastable and we have shown that the true equilibrium isotherm (which probably cannot be reached experimentally) is somewhere in between: this isotherm also changes from gradual to discontinuous as increases. The situation is different at higher temperature (in the vicinity of ) since true equilibrium behavior without hysteresis has been observed experimentallyWC1990 ; WKGC1993 . It will be therefore of interest to study the influence of temperature on the hysteretic behavior and to understand how the dynamics of relaxation towards equilibrium changes with (see, e.g., Ref.WM2003 for a recent study of the relaxation behavior associated to capillary condensation in a lattice model of Vycor).
Finally, we suggest that the scenario for filling and draining described in this work could be tested in more detail by performing experiments in a series of aerogels of gradually increased porosity. If our interpretation of the adsorption process in terms of avalanches is correct, there should exist a value of the porosity for which the isotherm becomes critical and the distribution of avalanche sizes follows a power law with well-defined critical exponentsS1993 . Using superfluid instead of normal 4He could perhaps allow to observe distinct avalanche events in the aerogel and to study their statistical properties. Such a study has been performed recently in the nanoporous material Nucleopore by a capacitance techniqueLH2001 . One could also check that the draining of the aerogel starts from the surface and that the growth of the invading vapor domain obeys different regimes. Related studies have been for instance carried out in Vycor using ultrasonic attenuation and scattering techniquesPLAHDW1995 ; K2000 . Such experiments would give a definite answer to the long-standing question about the nature of hysteresis in fluid adsorption in disordered porous media.
Acknowledgements.
The Laboratoire de Physique Théorique des Liquides is the UMR 7600 of the CNRS. We thank R. Jullien for providing us with his lattice DLCA algorithm to build the model aerogel.References
- (1) F. Brochard and P.G. de Gennes, J. Phys. Lett. 44, L785 (1983); P. G. de Gennes, J. Phys. Chem. 88, 6469 (1984).
- (2) A. P. Y. Wong and M. H. W. Chan, Phys. Rev. Lett. 65, 2567 (1990).
- (3) L. B. Lurio, M. Mulders, M. Paerkau, M. Lee, S. G. J. Mochrie, and M. H. W. Chan, J. Low Temp. Phys. 121, 591 (2000).
- (4) A. P. Y. Wong , S. B. Kim , W. I. Goldburg, and M. H. W. Chan, Phys. Rev. Lett. 70, 954 (1993).
- (5) A. E. Bailey, B. J.Frisken, and D. S. Cannell, Phys. Rev. E 56, 3112 (1997).
- (6) see, e.g., D. P. Belanger in Spin Glasses and Random Fields, edited by A. P. Young (World Scientific, Singapore, 1998), p. 251.
- (7) M. H. W. Chan, Czech J. of Phys. suppl. S6, 2915 (1996).
- (8) D. J. Tulimieri, J. Yoon, and M. H. W. Chan, Phys. Rev. Lett. 82, 121 (1999).
- (9) It was recently reported, using a capacitive technique (J. R. Beamish and T. Herman, Proceedings of LT23, to appear in Physica B), that hysteresis is present in the sorption isotherms of 4He in a 95% porosity aerogel up to 5.155K and that the adsorption remained gradual at all temperatures below . It is not yet clear whether these results, which challenge those of Ref.WC1990 , are due to an insufficient equilibration of the system (very slow thermal relaxation in the coexistence region was indeed observed) or to a different preparation process of the aerogel. Hysteretic behavior in the same range of temperatures has also been found using a low-frequency mechanical oscillator (G. Gabay et al., J. Low Temp. Phys. 121, 585 (2000)).
- (10) D. H. Everett, in The Solid-Gas Interface, edited by E. A. Flood (Marcel Dekker, New York, 1967), Vol. 2, p. 1055.
- (11) P. C. Ball and R. Evans, Langmuir 5 714 (1989).
- (12) We consider here hysteretic cycles that are observed at very slow flow rates on filling and on draining when the system exhibits no explicit time-dependence (after some transient time). This corresponds to the so-called rate-independent limit.
- (13) E. Kierlik, P. A. Monson, M. L. Rosinberg, L. Sarkisov, and G. Tarjus, Phys. Rev. Lett. 87, 055701 (2001).
- (14) E. Kierlik, P. A. Monson, M. L. Rosinberg, and G. Tarjus, J. Phys.: Condens. Matter. 14, 9295 (2002).
- (15) M.L. Rosinberg, E. Kierlik, and G. Tarjus, Europhys. Lett. 62, 377 (2003) .
- (16) J. P. Sethna, K. Dahmen, S. Kartha, J. A. Krumhansl, B. W. Roberts, and J. D. Shore, Phys. Rev. Lett. 70, 3347 (1993); O. Perkovic, K. Dahnen, and J. P. Sethna, Phys. Rev. Lett. 75, 4528 (1995) and cond-mat/9609072 (unpublished); K. Dahmen and J. P. Sethna, Phys. Rev. B 53, 14872 (1996); O. Perkovic, K. Dahnen, and J. P. Sethna, Phys. Rev. B 59, 6106 (1999).
- (17) A. Berger, A. Inomata, J. S. Jiang, J. E. Pearson, and S. D. Bader, Phys. Rev. Lett. 85, 4176 (2000); J. Marcos, E. Vives, L. Manosa, M. Acet, E. Duman, M. Morin, V. Novak, and A. Planes, Phys. Rev. B 67, 2244XXX (2003).
- (18) C. M. Soukoulis, K. Levin, and G. S. Grest, Phys. Rev. B 28, 1495 (1983); H. Yoshizawa and D. P. Belanger, Phys. Rev. B 30, 5220(1984); C. Ro, G. S. Grest, C. M. Soukoulis, and K. Levin, Phys. Rev. B 31, 1682 (1985); G. S. Grest, C. M. Soukoulis, and K. Levin, Phys. Rev. B 33, 7659 (1986); E. P. Raposo and M. D. Coutinho-Filho, Phys. Rev. B 57, 3495 (1998).
- (19) see V. Krakoviack, E. Kierlik, M. L. Rosinberg, and G. Tarjus, J. Chem. Phys. 115, 11289 (2001) for a different treatment of liquid-vapor phase separation in aerogels using integral equation theory and the replica formalism in the continuum. This method, however, does not allow the study of the hysteretic behavior.
- (20) H.-J. Woo, L. Sarkisov, and P. A. Monson, Langmuir 17, 7472 (2001).
- (21) K. Uzelac, A. Hasmy, and R. Jullien, Phys. Rev. Lett. 74, 422 (1995); C. Vasquez, R. Paredes, A. Hasmy, and R. Jullien, preprint cond-mat/0303470.
- (22) R. Salazar, R. Toral, and A. Chakrabarti, J. Sol-Gel Sci. and Technol. 15, 175 (1999).
- (23) E. Pitard, M. L. Rosinberg, G. Stell, and G. Tarjus, Phys. Rev. Lett. 74, 4361(1995).
- (24) E. Kierlik, M. L. Rosinberg, G. Tarjus, and E. Pitard, Mol. Phys. 95, 341 (1998).
- (25) P. Meakin, Phys. Rev. Lett. 51, 1119 (1983); M. Kolb, R. Botet, and R. Jullien, Phys. Rev. Lett. 51, 1123 (1983).
- (26) A. Hasmy, E. Anglaret, M. Foret, J. Pelous, and R. Jullien, Phys. Rev. B 50, 6006 (1994).
- (27) It is possible, however, that long-range correlations in the connectivity of the gel network exist that are not captured by the two-point function UHR1995 . This for instance may explain that no crossover to bulk-like critical behavior is observed in the superfluid transition of 4He in aerogel (Yoon et al., Phys. Rev. Lett. 80, 1461 (1998)).
- (28) M. Lach-hab, A. E. Gonzales, and E. Blaisten-Barojas, Phys. Rev. E 57, 4520 (1998).
- (29) G. Lawes, S. C. J. Kingsley, N. Mulders, and J. Parpia, Phys. Rev. Lett. 84, 4148 (2000).
- (30) J. V. Porto and J. M. Parpia, Phys. Rev. B. 59, 14583 (1999).
- (31) U. Marini Bettolo Marconi, and F. van Swol, Phys. Rev. A 39, 4109 (1989); A. Papadopoulou, F. van Swol, and U. Marini Bettolo Marconi, J. Chem. Phys. bf 97, 6942 (1992).
- (32) J. H. Page, J. Liu, B. Abeles, E. Herbolzheimer, H. W. Deckman, and D. A. Weitz, Phys. Rev. E 52, 2763 (1995).
- (33) A. I. Golov, I. B. Berkutov, S. Babuin, and D. J. Cousins, to appear in Physica B (2003).
- (34) F. J. Perez-Reche and E. Vives, Phys. Rev. B 67, 134421 (2003).
- (35) Strictly speaking, the disorder-induced critical transition studied by Sethna and co-workersS1993 only exists at . In LMFT however, and more generally when thermal fluctuations can be neglected, this is again a well-defined transition and it is reasonable to assume that is characterized by the critical exponents. It is then easy to check that the finite-size scaling exponent identifies with the combination of the exponents introduced in Ref.S1993 . This is based on the hypothesis that close to (for ) and the discontinuous change in is described by the scaling form where , and is a universal scaling funtion. Defining a new universal scaling function , this can be rewritten as . Hence, with . According to Ref.S1993 , one has , , , and . Note that in Fig. 11, we have neglected the dependence on the distance to and used . In fact, according to Ref.PV2003 , the scaling behavior of the magnetisation jump in the RFIM could be more complicated than the one predicted by Sethna and co-workers.
- (36) B. Tadic, Phys. Rev. Lett. 77, 3843 (1996).
- (37) M. Cieplak and M. O. Robbins, Phys. Rev. Lett. 60, 2042 (1988).
- (38) see, e.g., B. Koiller and M. O. Robbins, Phys. Rev. B 62, 5771 (2000) and references therein.
- (39) In the absence of gel, there is no threshold for the onset of motion of the initial liquid-vapor interface parallel to the plane of the bcc lattice, i.e., the interface moves along the -axis for at all temperatures. The actual self-affine interface, however, has various orientations at short-length scale. We found numerically that, at , a portion of the interface parallel to the plane starts to move at . Since the drop in the desorption isotherms of Fig. 12 occurs at lower values of , the pinning of the interface is due to disorder and not to lattice effects.
- (40) H. Ji and M. O. Robbins, Phys. Rev. B 46, 14519 (1992).
- (41) In the thermodynamic limit, the boundary condition (presence or absence of an interface) is not expected to influence the equilibrium phase behavior in the bulk of the material. As we have seen before, this reasoning does not apply to metastable states and out-of-equilibrium behavior.
- (42) The presence of a jump in the adsorption isotherm also implies that there are no adsorption scanning curves in the upper part of the hysteresis loop. Indeed, in the absence of interface with the reservoir, these curves are obtained by re-adsorbing from the metastable states located along the last desorption scanning curve.
- (43) F. Detcheverry, E. Kierlik, M.L. Rosinberg, and G. Tarjus, in preparation.
- (44) H.-J. Woo and P. A. Monson, Phys. Rev. E 67, 041207 (2003).
- (45) M. P. Lilly and R. B. Hallock, Phys. Rev. B 64, 024516 (2001); M. P. Lilly, A. H. Wooters, and R. B. Hallock, Phys. Rev. B 65, 104503 (2002).
- (46) E. S. Kikkinides, M. E. Kainourgiakis, K. L. Stefanopoulos, A. Ch. Mitropoulos, A. K. Stubos, and N. K. Kanellopoulos, J. Chem. Phys. 112, 9881 (2000).