[
Height Fluctuations and Intermittency of Films by Atomic Force Microscopy
Abstract
The spatial scaling law and intermittency of the surface roughness by atomic force microscopy has been investigated. The intermittency of the height fluctuations has been checked by two different methods, first, by measuring scaling exponent of q-th moment of height-difference fluctuations i.e. and the second, by defining generating function and generalized multi-fractal dimension . These methods predict that there is no intermittency in the height fluctuations. The observed roughness and dynamical exponents can be explained by the numerical simulation on the basis of forced Kuramoto-Sivashinsky equation.
PACS: 52.75.Rx, 68.35.Ct.
]
I Introduction
Due to the technical importance and fundamental interest, a great deal of effort has been devoted to understanding the mechanism of thin-film growth and the kinetic roughening of growing surfaces in various growth techniques. Analytical and numerical treatments of simple growth models suggest, quite generally, the height fluctuations have a self-similar character and their average correlations exhibit a dynamic scaling form [1-6].
Vanadium pentoxide, , has been the subject of intense work because of its diverse applications in catalytic oxidation reactions, cathodic electrode in solid state micro-batteries, windows and electrochromic devices as well as gas sensors and to be of interest for transmittance modulation in smart windows with potential application in the architecture and automotive. Also is a low mobility semiconductor, and having predominantly an n-type. Electrons are the charge carriers, and an increase in the carrier density in accompanied by reduction in oxygen concentration in the lattice [7-9].
This work aims to study the roughness and dynamical exponents ( and ) and the intermittency of the films by the atomic force microscopy. We measure the height-difference moments and show that they behave as . The obtained is a linear function of . We also introduce the generating function and generalized multifractal dimension and show that behave also as a linear function of . These observations indicate that the height fluctuations are not intermittent. It is also argued that the measured roughness and dynamical exponents belong to early-time scaling regime of the noisy Kuramoto-Sivashinsky equation.
II Experiments
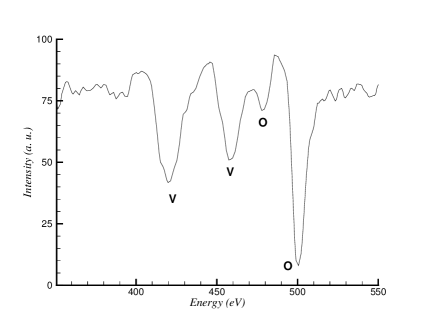
layers were grown on the polished Si(100) substrate by resistive evaporation method in a high vacuum chamber. The pressure during evaporation was torr. The thickness of the growing films was measured in situ by a quartz crystal thickness monitor. We performed all deposition at room teperature, with deposition rate about . However, during the film deposition the substrate temperature raised to , due to the radiation effect of alumina boat. The substrate temperature was determined using chromel/alumel thermocouple mounted in close proximity of samples. Surface composition of samples was measured by Auger electron spectroscopy (AES) using a keV electron beam and a cylindrical mirror analyzer (Varian model 981-2607). The surface topography of the films was investigated using Park Scientific Instruments model Autoprobe CP. The images are collected in a constant force mode and digitized into pixels with scanning frequency of Hz. The cantilever of 0.05 N spring constant with a commercial standard pyramidal tips has been used. A variety of scans, each with size were recorded at random locations on the film surface. In order to determine the structure of the deposited films, we have performed XRD measurements of samples. The spectra for the as-deposited films grown showed that the thin films are amorphous. For thick films () two very broad weak peaks were observed representing the growth of (001) and (002) peaks of the orthorombic structure[7]. The yellow color of deposited oxide films and their optical transmission spectra indicates the existence of structure rather than other vanadium oxide phases[8]. AES analysis of the samples showed and peaks at the surface of the deposited films. The stoichiometry of the vanadium oxide films was calculated from the ratio of to Auger peak heights by considering the elemental sensitivity factors. The ratio was indicating the formation of stoichiometric vanadium pentoxide at the surface of the thin film ( see Fig.1). With these observations we conclude the film composition is nearly stiochiometric[9].
III Results
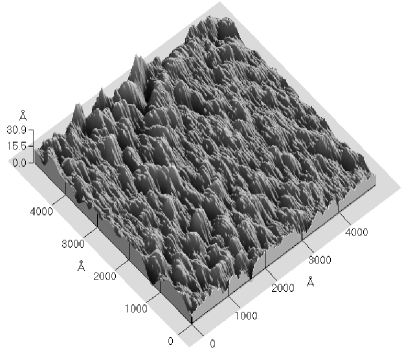
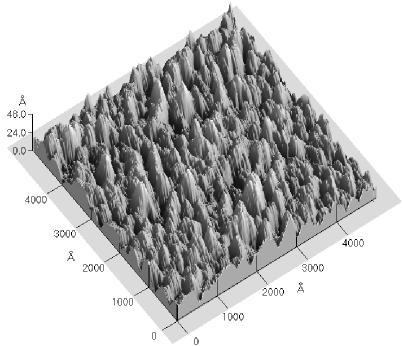
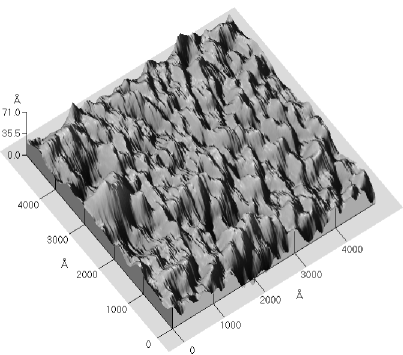
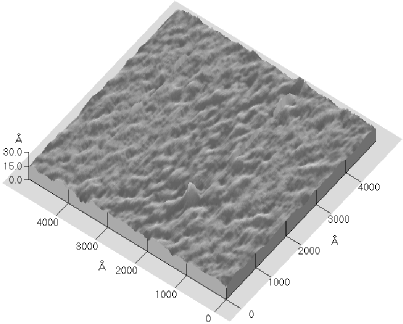
Figure 2 shows the variation of the surface morphology for different growth times ( or thickness) of processed samples by AFM. As deposition proceeds, the size of mountains and valleys grows until the system approaches to a stationary state in which the thickness is about .
The quantitative information of the surface morphology can be derived by considering a sample of size , and defining the mean height of growing film and, its roughness through [10]:
| (1) |
and
| (2) |
denotes an averaging over different realization (samples). Starting from a flat interface (one of the possible initial conditions), it was conjectured by Family and Vicsek [11] that a scaling of space by factor and of time by a factor ( is the dynamical scaling exponent), re-scales the roughness by factor as follows: , which implies that
| (3) |
If for large and fixed , saturates then , as . However, for a fixed large and , one expects that correlations of the height fluctuations are set up only within a distance and thus must be independent of . This implies that for , with . Thus dynamic scaling postulates that, for and for . The roughness exponent and the dynamic exponent characterize the self-affine geometry of the surface and its dynamics, respectively. We measure the exponent from equal-time height-height correlation function defined as . Here is the surface height at position on the surface relative to the mean surface height.
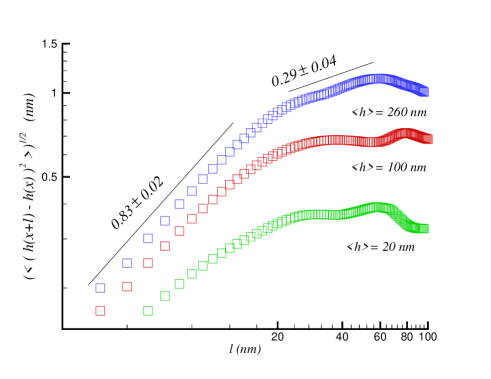
In order to determine the roughness exponent , we consider the roughness of the samples with thickness , and . Fig.3 shows that, for the thickness and , the scaling behavior exists only for the scaling region to , but for the stationary state sample, , there is a cross over for the scaling exponent in . The exponent is for the length scales to the scale , and for the length scales , the fluctuation is determined by another exponent . The measured values for the exponents and are () and ( ) respectively. The measured roughness exponent of the samples , and are , and , respectively. As shown in Figs. 4 and 5, we note that the correlation length is about . Therefore, we are dealing with the statistical properties of the correlated scaling surfaces. As discussed in [22], such systems exhibit the sampling-induced hidden cycles (log-periodic fluctuations [23]). Such oscillatory behavior will diminish when the sampling size is sufficiently large. The oscilation amplitude approaches zero to within an order of , where and are the sampling size and the number of independent curves which are averaged. We have determined each exponents by averaging on the eight AFM images. In our averaging it appears that there is no log-perodic property for the height-height correlation function. Therefore the surfaces of are self-affine.
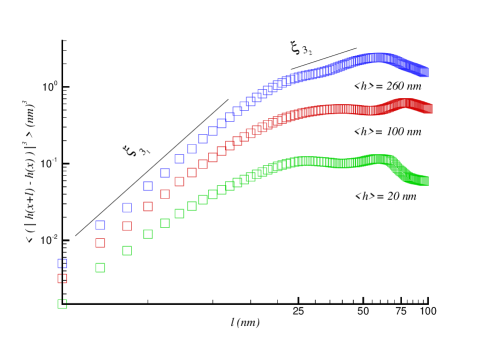
The existence of the cross over scale in the stationary state is not observed only in the second moment . In Fig.4 log-log plot of vs for the three samples are presented. It is evident that for the stationary state sample, the scaling exponent of the third moment has also a cross over in . The measurement shows that in the stationary state the exponents behave as with .
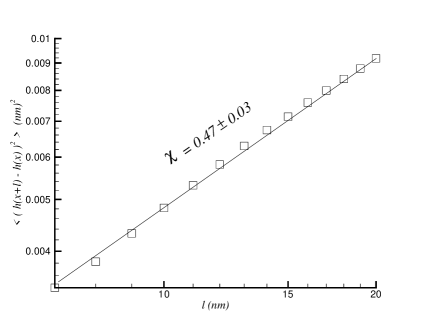
We also examine the scaling behaviour of the q-th moment of the height-difference and show that all of the moments at least up to behave as . Fig.5 shows vs for sample in scaling region. The graph of for the region is the same as Fig.5 but with different slope. In the two scaling regions, the ’s have a linear dependence on . This measurement indicates that the height-fluctuations are not intermittent and all of scaling exponents in the stationary state can be expressed by , only.

There is another method to check that the intermittency is absent in the height fluctuations of surface [12-13]. Let’s introduce the generating function . The generating function is defined through
| (4) |
where the normalized measure is
| (5) |
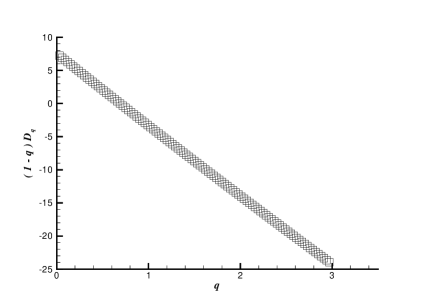
and, is the number of data . For large , the generating function scales as . We measure the exponent in both scaling region ( to and to ). The amplitude of depends only on and . In Fig.6 we plot the vs for small . The figure shows that the has a linear dependence on and the generalized fractal dimension is independent of . Its value is . Therefore we conclude that the height fluctuation is not intermittent. It is necessary to note that the exponents and are not independent in the small region of . Defining , it has been shown in [20] that can be expressed in terms of as;
| (6) |
Our measurement for shows that the is independent of and this means that . Let us discuss the origin of the in eq.(6). To evaluate the we should calculate the summation , where is the number of points over which the average is taken. Normally small is meant by . The authors of Ref.[20] assumed that, in evaluation of , and may be related in a way different from . That is ( could be considered here as a fractal dimension of the effective support of the process). The choice of a particular partition has no effect on the spectrum. However, enters the relation between and generalized dimension as expressed in eq.(6).
IV Discussion and Growth model
In our experiments we obtain a region in which the growth exponents of are consistent with early-scaling regime of forced Kuramoto-Sivashinsky (KS) equation in 2+1 dimensions [19]. The forced Kuramoto-Sivashinsky has the following form [14-19],
| (7) |
where the , and are the surface tension, surface diffusion and non-linear factor, respectively. The force is a noise term reflecting spatial and temporal fluctuation in the incoming flux of material and has a Gaussian distribution and uncorrelated in space and time. In the limit and for the forced KS equation reduces to the Kardar-Parisi-Zhang (KPZ) equation. The KS equation with is a linear equation and can be exactly solved by the standard methods [19,22]. For some Gaussian noise term, because of the linearity the probability distribution function (PDF) of is also Gaussian. It is discussed in [22] that for and the KS equation generates a mound surface and for gives a self-afine surface, with a roughness exponent . For the nonlinear term breaks the symmetry under transformation . Therefore the PDF of must be skewed. Our measured value for the PDF of shows that the PDF has positive skewness. We will report the skewness and kurtosis of the PDF of the films elsewhere [12].
Recent simulation of KS equation reveals the presence of the early and long scaling regimes [19]. The initial-time values for the growth exponent and the roughness exponent are found to be and respectively. The long time scaling regime is determined by the exponents and . The scaling exponents are notably less than the exponents of KPZ equation [19]. The long-time behavior of the KS-equation has an interesting feature. For long-times the height-height correlation function exhibits a bifractal structure with two different roughness exponents (see Fig.11 in ref. [19]). For , and , the upper and lower parts of height-height correlation function have the roughness exponent and , respectively.
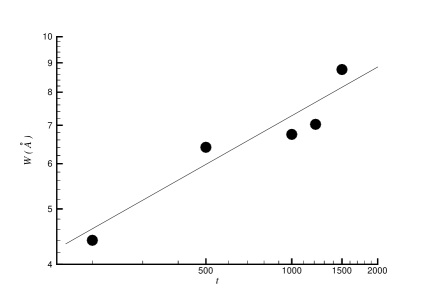
Now let us compare our results with the numerical simulation of KS equation. Using the numerical results of ref.[19] in table II, one can observe that for early-scaling regime of the Kuramoto-Sivashinsky equation the exponents and satisfy the exponent-identity . Using the time dependence of roughness of the samples with thickness , , , and we find that (see Fig.7) and therefore , which satisfies the exponent-identity within the experimental errors. We also observe the similar bifractal structure of the height-height correlation function in our samples with thickness (see Fig.11 in [19]). To relate the cross over scale to the the surface morphology, we have measured average distance of nearest local maxima , and obtain that the is in the same order of magnitude of . This means that, in the stationary state, in average, if the distance between the points and lies between the two local maxima of , the dynamics is determined by the roughness exponent . Also for the points that the relative distance lies between the next neighbor maximums ( ), the dynamics is given by another exponent which is less than the KPZ roughness exponent. Our measurements show that the roughness exponent is less than the the KPZ roughness exponent in dimensions i.e. .
In summary we have checked the intermittency of height fluctuation of via two different methods. These methods predict that the statistics of height fluctuations is not intermittent. We measure the scaling exponents of height-difference moments, , and show that for small , they behave as . The obtained ‘s are linear function of . The observation can be explained with the recent numerical simulation on the basis of nonlinear KS equation. However, one should note that for very early stages, when term dominates term, instability arises in x or y direction causing the ripple structure with corresponding wave vector in x or y direction in KS equation. When the ripple structure is formed, there exists slope asymmetry that activates the nonlinear effect. Therefore, in the early-stage of the process, the ripple structure transforms to symmetric mounds. In our experiments we were not able to detect the ripple structure for the samples with . It could mean that the polished substrate may have an initial roughness which may destroy the ripple structure of the film for very early-stages of the growth. We measure the roughness exponent of the silicon substrate and find that the (see Figs.8 and 9).
Finally we note that the measured roughness exponents and can be higher than the true values because of the tip effect [21]. Aue etal. showed that the surface fractal dimension (fractal dimension for 2+1 interface is related to by ) determined with a scanning probe technique will always lead to an underestimate of the actual fractal dimension, due to the convolutions of tip and surface. Their analysis included tips with different shapes and aspect ratios. For a tip similar to what we have used, it is suggested that our true and should be around and , respectively. We note that the corrected exponents also satisfy the exponent identity.
Acknowledgement
We thank A. Aghamohammadi, F. Azami, M.M. Ahadian, J. Davoudi, A. Farahzadi, G. Ketabi and Z. Vashaei for useful discussions.
REFERENCES
- [1] A.-L. Barabasi and H. E. Stanley, ”Fractal Concepts in Surface Growth” (Cambridge University Press, New York, 1995).
- [2] T. Halpin-Healy and Y. C. Zhang, Phys. Rep.245,218(1995);J. Krug, Adv. Phys.46,139(1997)
- [3] J. Krug and H. Spohn in ”Solids Far from Equilibrium Growth, Morphology and Defects”, edited by C. Godreche (Cambridge University Press, New York, 1990).
- [4] P. Meakin, ”Fractal, Scaling and Growth Far from Equilibrium” (Cambridge University Press, Cambridge, 1998).
- [5] M. Kardar, Physica A 281,295(2000).
- [6] A. A. Masoudi, F. Shahbazi, J. Davoudi and M. Reza Rahimi Tabar, Phys. Rev. E 65, 026132(2002).
- [7] M. Benmoussa, E. Ibnouelghazi, A. Bennouna and E.L. Ameziane, Thin Solid Films 265, 22 (1995)
- [8] S.A. Aly, S.A. Mahmoud, N.Z. El-Sayed and M.A. Kaid, Vacuum 55,159 (1999)
- [9] S.N. Svitasheva and V.N. Kruchinin, Thin Solid Films 313-314,319(1998)
- [10] M. Marsilli, A. Maritan, F. Toigoend J.R. Banavar,Rev. Mod. Phys., 68,963 (1996)
- [11] F. Family and T. Vicsek,J.Phys.A 18,L75(1985)
- [12] A. Iraji zad, G. Kavei, M. Reza Rahimi Tabar and S.M. Vaez Allaei,in preparation.
- [13] J. Lee and H. E. Stanley, Phys. Rev. Lett. 61,2945(1988); see also ”Fractal and Disordered Systems”,Eds. A. Bunde and S. Havlin (Springer-Verlag, p.15,1991).
- [14] R. M. Bradley, J. M. E. Harper, J. Vac. Sci. Technol. A 6,2390(1994).
- [15] R. Cuerno, A.-L. Barabasi, Phys. Rev. Lett. 74,4746(1995).
- [16] R. Cuerno, H. A. Makse, S. Tommasone, S. T. Harrington, H. E. Stanley, Phys.Rev.Lett. 75, 4464(1995).
- [17] K. B. Lauritsen, R. Cuerno, H. A. Makse, Phys.Rev. E 54, 3577 (1996).
- [18] Anthony C.-T. Chan, G.-C. Wang, Surf. Sci. 414,17-25(1998).
- [19] J.T. Drotar, Y.-P. Zhao, T.-M. Lu and G.-C. Wang, Phys. Rev. E 59 177 (1999)
- [20] A. -L. Barabasi, P. Szepfalusy and T. Vicsed, Physica A 178, 17 (1991); A. Bershadskii, Phys. Rev. E 58, 2660 (1998)
- [21] J. Aue and J. Th. M. De Hosson, Appl. Phys. Lett 71 (10) 1347 (1997)
- [22] H. -N. Yang, Y. -P. Zhao, A. Chan, T.-M. Lu and G, -C. Wang, Phys. Rev E56 (1997) 4224
- [23] N. Abed-pour, A. Aghamohammadi, M. Khorrami and M. Reza Rahimi Tabar, cond-mat/0208544, to appear in Nucl. Phys. B.