On the Coalescence of Nanoscale Metal Clusters
Abstract
We study the coalescence of nanoscale metal clusters in an inert-gas atmosphere using constant-energy molecular dynamics. The coalescence proceeds via atomic diffusion with the release of surface energy raising the temperature. If the temperature exceeds the melting point of the coalesced cluster, a molten droplet forms. If the temperature falls between the melting point of the larger cluster and those of the smaller clusters, a metastable molten droplet forms and freezes.
The ability to predict and control the size and structure of nanoparticles is of great importance for applications, as the arrangement of atoms is a key determinant of the optical, electronic and thermal properties of such particles. However, the structure of an atomic cluster often differs from that of the corresponding bulk material Ino (1966). As the number of surface atoms is comparable to the number of interior atoms in a cluster, the surface energy plays an important role in determining the overall structure. The delicate balance between surface and internal energies often produces a complex dependence of equilibrium structure upon cluster size Raoult et al. (1989); Cleveland et al. (1997).
In an inert-gas aggregation (IGA) source, where metal clusters are produced by evaporation and then condensation from a vapor in an inert gas atmosphere, experiments have shown that the final cluster structure depends on the growth rate Reinhard et al. (1997). Molecular dynamics simulations of silver clusters support this finding, with studies of both the growth of clusters from small seeds Baletto et al. (2000) and the freezing of clusters from molten droplets Baletto et al. (2002) finding a dependence of structure on kinetic factors. These examples illustrate that it is important to understand cluster kinetics if one wishes to predict cluster structure.
The growth of clusters by coalescence is a kinetic process which will also effect structure. Indeed, the aggregation of atomic clusters has generated much interest due to the variety of different large-scale structures that can form, and the relevance of this to the functionality of devices built from clusters. For example, the deposition of clusters onto surfaces can result in highly ramified fractal structures Brechignac et al (2001), highly symmetric droplets Goldby et al (1996), as well as many intermediate structures Kaiser et al (2002). A recent proposal Schmelzer et al. (2002) uses cluster deposition to form wire-like cluster chains resembling nanowires with conduction of electrical current between neighboring particles. Understanding cluster coalescence is therefore crucial for reliable design and fabrication of such devices.
Further, the distribution of cluster sizes produced in IGA sources suggests that coalescence is an important growth mechanism Granqvist and Buhrman (1976, 1976). Studies by electron diffraction of lead clusters grown in an IGA source have found structures that could not be fitted by standard model structures but which might be accounted for by coalesced structures Hyslop et al. (2001). To predict the structures of metal clusters produced in IGA sources we need to study the coalescence of free metal clusters.
The collision and coalescence of small clusters, containing tens of atoms, has been studied extensively using molecular dynamics. For example, an early study showed that the decrease in surface area during fusion can lead to an increase in kinetic energy Schmidt et al. (1991). Simulations of the coalescence of larger clusters have been predominantly conducted at constant temperature Zhu and Averback (1996); Lewis et al. (1997), which probably best represents the coalescence of supported clusters with the substrate acting as a thermostat Lewis et al. (1997). However, as we will argue below, the coalescence of nanometer-sized free clusters in an IGA source is best described by constant energy molecular dynamics. We are aware of only one such study, which considered the fusion of both pairs of liquid and pairs of ”glassy” solid silicon clusters Zachariah and Carrier (1999), and demonstrated that the kinetic energy generated during coalescence can considerably shorten coalescence times by enhancing atomic diffusion. Recent kinetic Monte Carlo simulations have shown, however, that the coalescence of facetted clusters can be considerably slower than surface-roughened particles Combe et al. (2000).
Our purpose is to study the coalescence of facetted solid lead clusters using molecular dynamics under conditions similar to those found in an IGA source. We examine the coalescence of lead clusters using the empirical glue potential developed by Lim, Ong and Ercolessi Lim et al. (1992). Recently it was shown that many-body effects in the glue potential produce unusual surface-reconstructed icosahedra in simulations of freezing Hendy and Hall (2001). Further, these surface-reconstructed icosahedra are thought to be globally optimum structures for the glue-potential for lead over a wide range of sizes Hendy and Hall (2001); Doye and Hendy (2003); Hendy and Doye (2002). It is of interest then to study the coalescence of such icosahedra under conditions that might occur in an IGA source.
An estimate of the mean time, , for a cluster of radius between collisions with an inert-gas atmosphere of atomic mass , pressure and temperature in the source can be made as follows Baletto et al. (2002):
For a 2 nm radius lead cluster in a helium atmosphere at 5 mbar and 500 K, the time between collisions is approximately 1 ns. Thus over periods of a nanosecond or so, a constant-energy simulation of cluster coalescence will be a reasonable approximation to conditions in an IGA source. We will use constant-energy molecular dynamics here.
Two 565-atom surface-reconstructed icosahedral clusters are initially prepared by construction as detailed in Hendy and Doye Hendy and Doye (2002). Each of these clusters consist of a 147 Mackay icosahedral core with two reconstructed outer shells which differ from the usual Mackay icosahedral surface termination. Each cluster is then equilibrated in isolation during a constant-temperature simulation for time-steps at some common initial temperature . The clusters are then placed in a common simulation cell so that the edges are aligned and the corresponding edge atoms are 0.5 nm apart(approximately next-nearest neighbor distance but within the glue potential cut-off). In this work, we will not examine the effects of relative orientation, initial structure or impact parameter of the clusters in detail. Further simulations reveal that changing relative orientations does not alter the conclusions reached here, although we have not investigated the case of non-zero impact parameter.
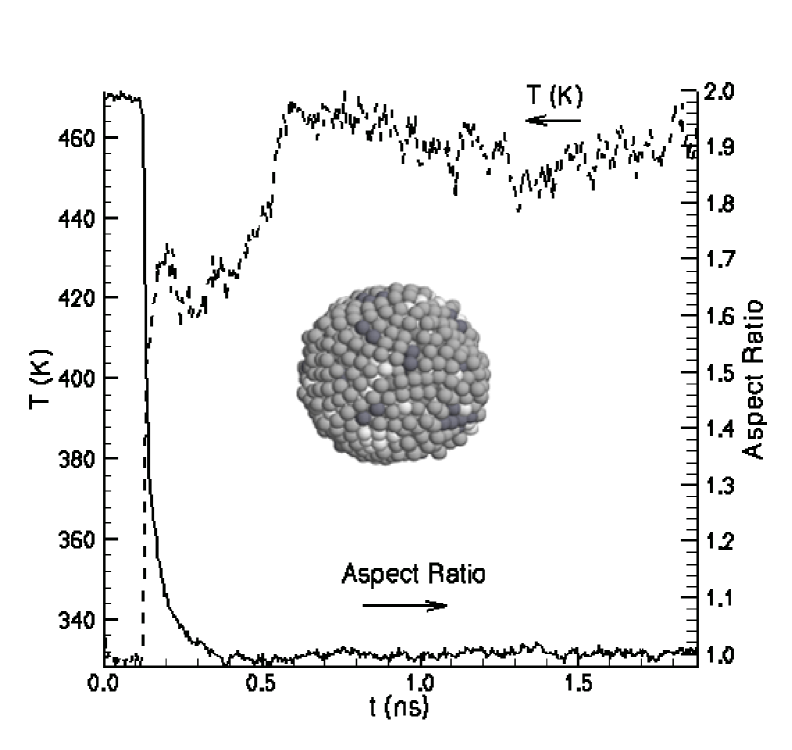
The constant-energy simulation then proceeds at a total energy equal to the sum of the final energies from each isolated equilibration run. Here we use a 3.75 fs time step which ensures energy is conserved to within 0.01 eV/atom over a 10 ns simulation. Figure 1 shows a series of snapshots of the initial stages of coalescence between two 565-atom clusters each equilibrated at 300 K. Coalescence typically begins tens of picoseconds into the simulation when an atom on one of the aligned edges makes contact with the adjacent edge of the other cluster. The first snapshot in figure 1 shows the situation at this initial moment of contact, with the formation of an initial neck shown in subsequent frames. Neck growth is essentially complete by the final snapshot in figure 1. Figure 2 shows the evolution of temperature and the aspect ratio 111Aligning the clusters along the x-axis, we define the aspect ratio to be where is the radius of gyration along axis .
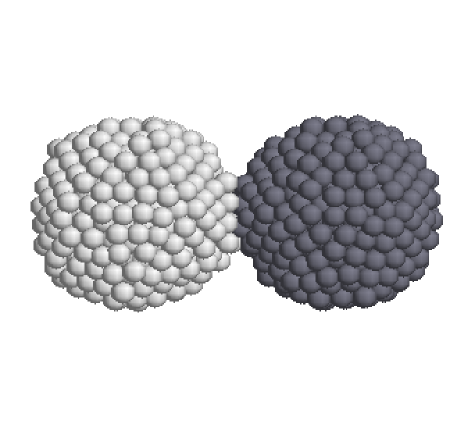
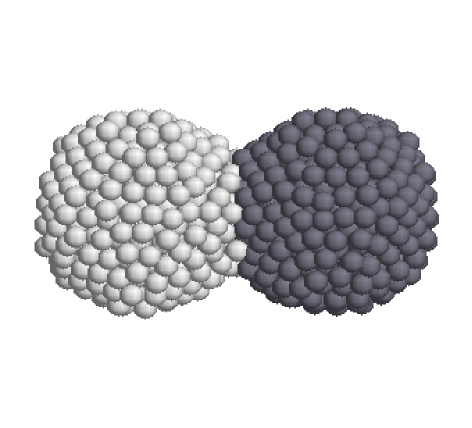
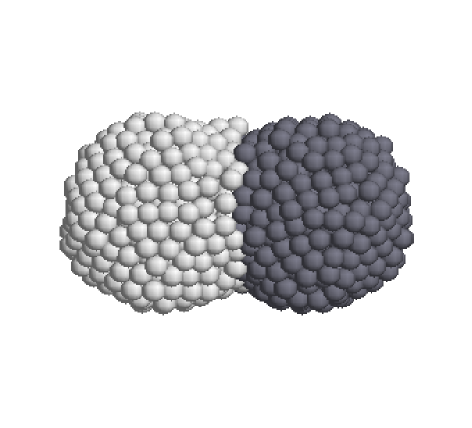
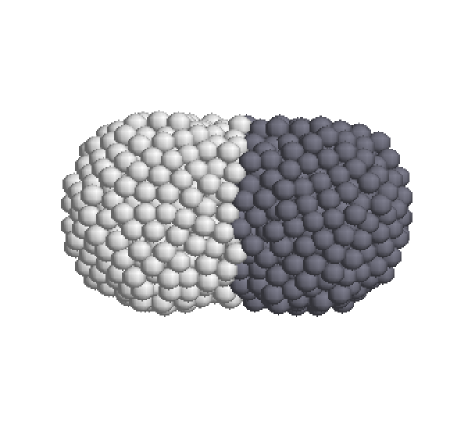
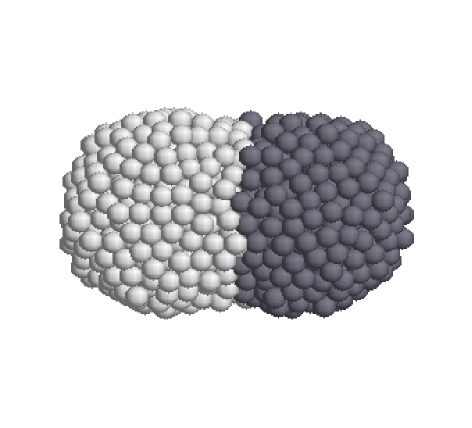
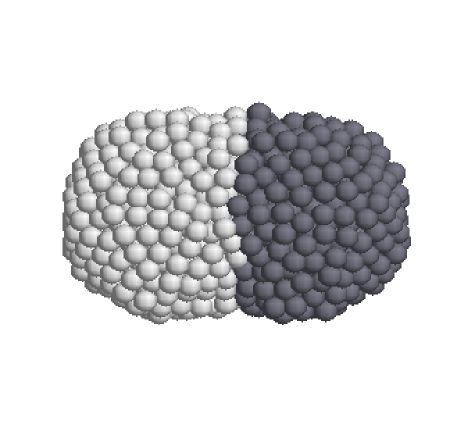
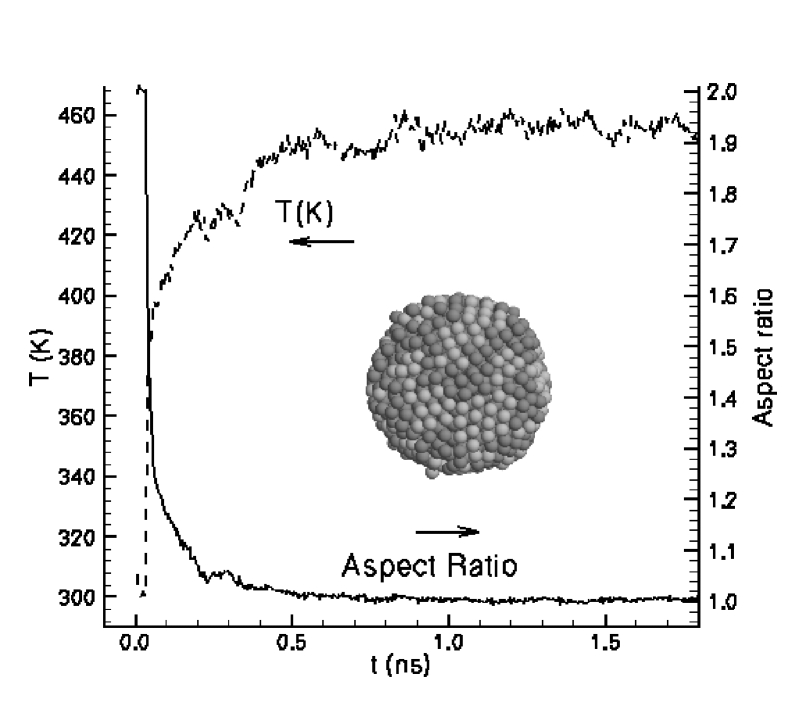
As the neck grows, the surface area of the merging clusters decreases, leading to the release of considerable surface energy. This energy is converted to heat, as can be seen in Figure 2 by the large increase in temperature during neck growth. After initial contact and the period of rapid neck growth, the aspect ratio evolves more slowly. In Figure 2, we can see that the cluster is essentially spherical in shape after a period of 0.5 ns after initial contact, as the aspect ratio is very close to one by this stage. Examination of cluster structure reveals that it is static after this time. We conclude that coalescence is complete within 1 ns. The final structure of the 1130-atom cluster is that of a surface-reconstructed icosahedron (see Figure 2).
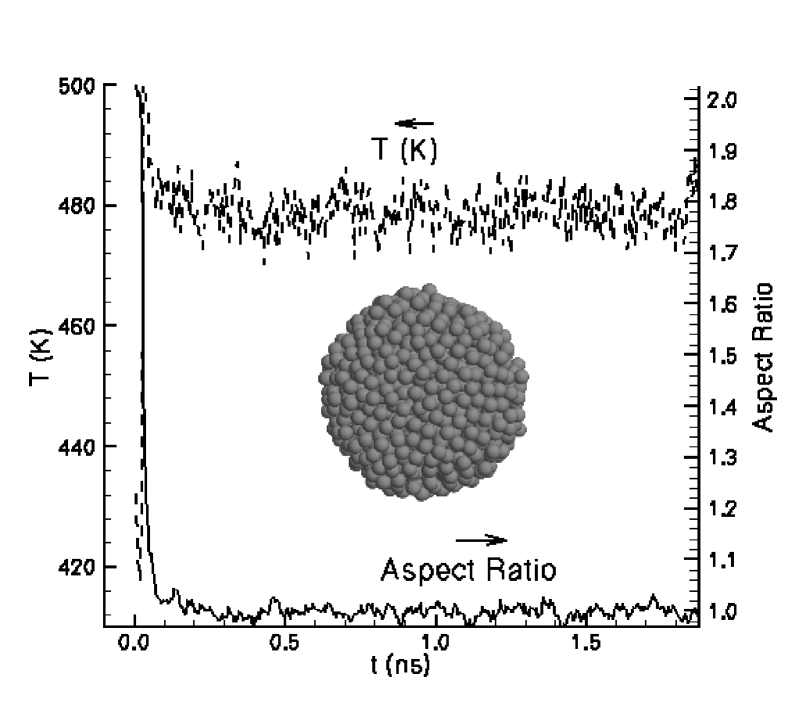
The amount of surface energy released as heat will clearly play a role in enhancing atomic diffusion during coalescence. In fact, if the initial temperature of the two clusters is close enough to the melting point, the final coalesced cluster may be molten. Such a case is shown in Figure 3, which illustrates the evolution of temperature and aspect ratio of two clusters initially at 420 K. Here the coalescence is far more rapid than in the previous example, occurring in tens of picoseconds rather than over 0.5 ns. The clusters form a neck and then melt, with the coalesced cluster rapidly becoming spherical. Note the initial spike in temperature prior to melting, followed by a drop in temperature due to the heat of melting. The final cluster is molten at a temperature of approximately 480 K. In the IGA source, this coalesced cluster will cool slowly and freeze before reaching equilibrium with the inert gas atmosphere.
It is instructive to consider simple models of coalescence and melting. Consider the coalescence of a spherical particle of radius with a spherical particle of radius . Conservation of energy tells us that the increase in thermal energy of the coalescing cluster must balance the reduction in surface energy. Thus, the increase in temperature of the aggregate can be estimated as:
| (1) |
where is the surface tension, is the heat capacity and is the density of the two particles. In general, , and will depend on cluster size. However, we will ignore this dependence here and use the bulk values for these parameters. For the simulation presented in figure 2, nm and equation (1) predicts K, which is close to the value attained in the simulation of 150 K. This increase in temperature is maximized when the ratio of change in surface area to volume ratio is maximized i.e. when for a given . If exceeds the cluster melting point then we would expect the cluster to melt during coalescence.
However, it is well-known that the melting point, , of a metal cluster depends strongly on the radius, . A simple model for this dependence can be written as Pawlow (1909):
| (2) |
where is some length which depends on bulk material parameters. Obviously, this model fails for clusters of radius and does not account for the irregular variation in melting point observed in small clusters Kusche et al. (1999), but experimental results for lead Ben David et al. (1995), where nm, suggest it is adequate for nm. By simulation we have identified the melting point of the initial 565-atom clusters to be K and that of the coalesced 1130-atom clusters to be K. Equation (2) predicts the melting point for the 565-atom clusters ( nm) to be 410 K and for the 1130-atom clusters ( nm) to be 450 K. This rough agreement between (2) and simulation will be sufficient for our purposes here.
Clearly one can always arrange an initial temperature , such that . However, for clusters of equal size , comparison of equation (1) and equation (2) suggests that there is a critical cluster size nm, below which coalescence will always cause melting (i.e. since at , ). However, we have not tested this using simulations here as the glue potential Lim et al. (1992) may be unsuitable for such small clusters Doye and Hendy (2003).
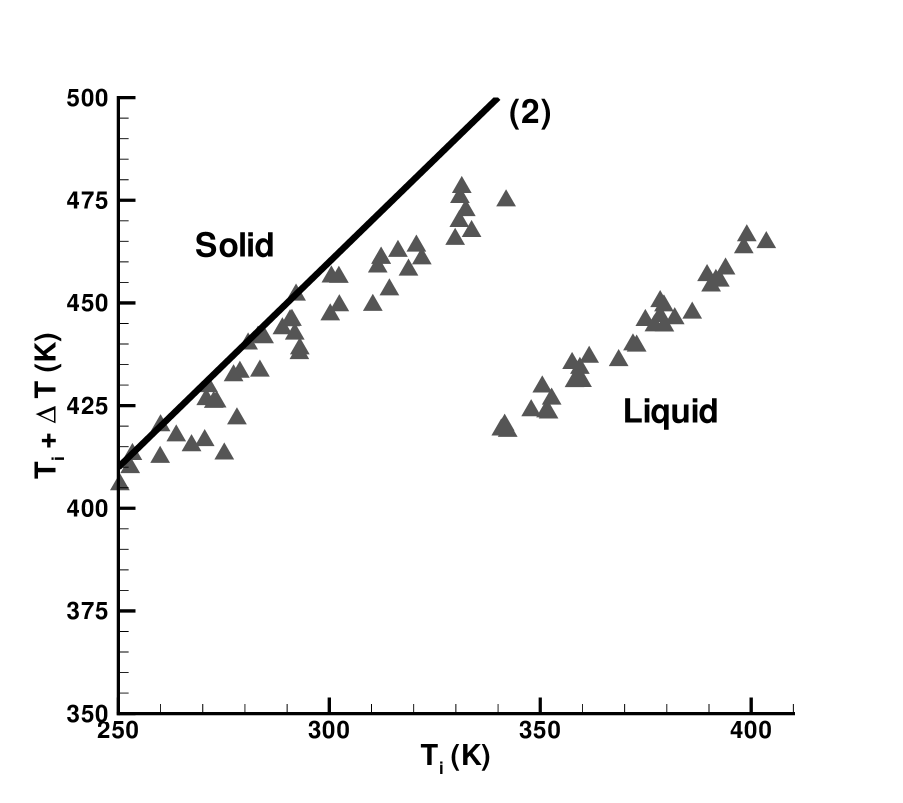
Figure 4 shows the final temperatures of a series of pairs of 565-atom clusters that have undergone coalescence. The initial temperature of the pairs has been varied from 250 K to 400 K. The solid line is the value of predicted by equation (1). We see from the figure, that equation (1) is adequate (considering the approximations involved) until an initial temperature of . Above this initial temperature the final state of the coalesced clusters is molten. The highest final temperature reached in this series of simulations is . Thus when the melting point of the final cluster is exceeded during coalescence, a molten cluster results. The drop in the final temperature is due to the latent heat of melting. Note, that as the initial temperatures of the simulations correspond to the total energy, figure 4 is essentially a caloric curve for the coalesced clusters. The coexistence of both liquid and solid clusters between final temperatures of 425 K and 475 K corresponds to the van der Waals loop in the microcanonical ensemble Wales and Berry (1994).
In figure 5 we illustrate the coalescence of two 565-atom icosahedra initially prepared at 330 K. Coalescence occurs rapidly, with the aspect ratio reaching one 0.2 ns after initial contact. There is a corresponding increase in temperature of approximately at this time. Inspection of the cluster structure at this time reveals that it is highly disordered and is consistent with that of a molten structure 222In fact, it is difficult to be certain whether this transient state is liquid or a disordered glassy structure.. The smaller than expected increase in temperature during coalescence also suggests the cluster is molten. However this structure is evidently unstable as at 0.5 ns, the cluster structure undergoes a transition to form a more regular icosahedral structure. There is a corresponding increase in temperature at this time. This route to coalescence via an unstable molten intermediate state was found to be typical of coalescing clusters at initial temperatures of 320-330 K. It is interesting to note that the temperature, K, of the unstable droplet falls between and . This suggests a crude interpretation of this process, namely that the two individual 565-atom clusters melt when exceeds during coalescence, but that the resulting 1130 atom molten droplet is now unstable as . Finally, it seems reasonable to characterize the liquid state seen immediately after coalescence as metastable: while for small clusters dynamical coexistence between the solid and liquid state has been observed Honeycutt and Andersen (1987), the energy barriers between the liquid and solid states scale as Lynden-Bell and Wales (1994), hence repeated melting and freezing of the 1130-atom cluster will not be observed.
To summarize, we have identified three regimes for the coalescence of free solid metal clusters: 1. solid-solid coalescence by diffusion. This will produce highly-defective clusters, perhaps with large numbers of stacking faults (see Ref. Lewis et al. (1997)). 2. complete melting of solid clusters as they coalesce to form a single liquid droplet. In an IGA source, the final structures will depend on the cooling rate due to equilibration with the inert gas Baletto et al. (2002). 3. complete melting of solid clusters coalescing to form an unstable liquid droplet which subsequently solidifies. The solid structures produced by this mechanism will resemble those produced by a rapid quench.
References
- Ino (1966) S. Ino, J. Phys. Soc. Jpn 21, 346 (1966).
- Raoult et al. (1989) B. Raoult et al., Philosophical Magazine B 60, 881 (1989).
- Cleveland et al. (1997) C. L. Cleveland et al., Physical Review Letters 79, 1873 (1997).
- Reinhard et al. (1997) D. Reinhard et al., Phys. Rev. B 55, 7868 (1997).
- Baletto et al. (2000) F. Baletto, C. Mottet and R. Ferrando, Phys. Rev. Lett. 84, 5544 (2000).
- Baletto et al. (2002) F. Baletto, C. Mottet and R. Ferrando, Chem. Phys. Lett. 354, 82-87 (2002).
- Brechignac et al (2001) C. Bréchignac et al., Eur. Phys. J. D 16, 265 (2001).
- Goldby et al (1996) I. M. Goldby et al., Appl. Phys. Lett. 69, 2819 (1996).
- Kaiser et al (2002) B. Kaiser et al., Surface Science 496, 18-22 (2002).
- Schmelzer et al. (2002) J. Schmelzer, Jr. et al., Phys. Rev. Lett. 88, 226802 (2002).
- Granqvist and Buhrman (1976) C. G. Granqvist and R. A. Buhrman, Solid State Comm. 18, 123-126 (1976).
- Granqvist and Buhrman (1976) C. G. Granqvist and R. A. Buhrman, J. Appl. Phys. 47, 2200 (1976).
- Hyslop et al. (2001) M. Hyslop et al., European Physics Journal D 16, 233-236 (2001).
- Schmidt et al. (1991) R. Schmidt, G. Seifert, and H. O. Lutz, Phys. Lett. A 158, 231 (1991).
- Zhu and Averback (1996) H. Zhu and R. S. Averback, Phil. Mag. Lett. 73, 27 (1996).
- Lewis et al. (1997) L. J. Lewis, P. Jensen and J-L. Barrat, Phys. Rev. B 56, 2248 (1997).
- Zachariah and Carrier (1999) M. R. Zachariah and M. J. Carrier, J. Aerosol. Sci. 30, 1139 (1999).
- Combe et al. (2000) N. Combe, P. Jensen and A. Pimpinelli, Phys. Rev. Lett. 85, 110 (2000).
- Lim et al. (1992) H. S. Lim, C. K. Ong, and F. Ercolessi, Surface Science 269/270, 1109 (1992).
- Doye and Hendy (2003) J. P. K. Doye and S. C. Hendy, European Physics Journal D 22, 99-107(2003).
- Hendy and Hall (2001) S. C. Hendy and B. D. Hall, Physical Review B 64, 085425 (2001).
- Hendy and Doye (2002) S. C. Hendy and J. P. K. Doye , Physical Review B 66, 235402 (2002).
- Pawlow (1909) P. Pawlow, Z. Phys. Chem. 65, 545 (1909).
- Kusche et al. (1999) R. Kusche et al., Eur. Phys. J. D 9, 1 (1999).
- Ben David et al. (1995) T. Ben David et al., Phil. Mag. A 71, 1135-1143 (1995).
- Wales and Berry (1994) D. J. Wales and R. S. Berry, Phys. Rev. Lett. 73, 2875 (1994).
- Honeycutt and Andersen (1987) J. D. Honeycutt and H. C. Andersen, J. Phys. Chem. 91, 4950-4963 (1987).
- Lynden-Bell and Wales (1994) R. M. Lynden-Bell and D. J. Wales, J. Chem. Phys. 101, 1460 (1994).