Large difference in the elastic properties of fcc and hcp hard-sphere crystals
Abstract
We report a numerical calculation of the elastic constants of the fcc and hcp crystal phases of monodisperse hard-sphere colloids. Surprisingly, some of these elastic constants are very different (up to 20%), even though the free energy, pressure and bulk compressibility of the two crystal structures are very nearly equal. As a consequence, a moderate deformation of a hard-sphere crystal may make the hcp phase more stable than the fcc phase. This finding has implications for the design of patterned templates to grow colloidal hcp crystals. We also find that, below close packing, there is a small, but significant, difference between the distances between hexagonal layers ( ratios) of fcc and hcp crystals.
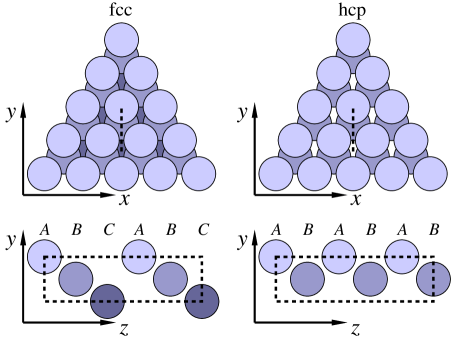
The simplest regular close-packed structures of hard, spherical particles are the face-centered cubic (fcc) and hexagonal close-packed (hcp) structures (see Fig. 1). Close to melting, the Helmholtz free energies of these two crystal structures differ by less than 0.05% Bolhuis et al. (1997); Bruce et al. (1997); Pronk and Frenkel (1999). As a consequence, hard-sphere colloids (the experimental realization of elastic hard spheres) rarely crystallize directly into the more stable fcc structure. Rather, crystallization initially results in the formation of a randomly stacked crystal Zhu et al. (1997); Petukhov et al. (2003). The latter then slowly transforms to the stable fcc structure Cheng et al. (2002); Kegel and Dhont (2000); Martelozzo et al. (2002); Pronk and Frenkel (1999). However, pure hcp crystals have recently been grown by colloidal epitaxy on patterned templates Hoogenboom et al. (2003). At a given density, not only the free energies, but also the pressures and compressibilities of the fcc and hcp phases are very similar. One might therefore be tempted to suppose that these two crystal phases are similar in all their thermodynamic properties. Surprisingly, this is not the case. In this Letter we present calculations of the elastic constants of fcc and hcp hard-sphere crystals. We show that some of these elastic constants may differ by as much as 20%. As a consequence, a moderate deformation of the hard-sphere crystal may change the relative stability of the two crystal phases.
A homogeneous deformation of a solid can be described by the transformation matrix that relates the cartesian coordinates of a point in the undeformed solid, to the coordinates in the deformed solid: , where summation of repeated indices is implied. The (isothermal) elastic constants of a crystal are most easily defined in terms of an expansion of the Helmholtz free energy in powers of the Lagrangian strains Wallace (1970):
| (1) | |||||
The Lagrangian strain parameters are related to the deformation matrix through . In Eq. 1, the coefficients are simply the components of the stress tensor at zero deformation, are the second-order elastic constants, are the third-order elastic constants, and so on. For a system under hydrostatic pressure , the components of the stress tensor are .
The fcc lattice has only 3 independent elastic constants Wallace (1970) (, and in the coordinate frame of the cubic unit cell). In what follows, we use this Voigt notation () to denote the second-order elastic constants.
In order to compare the elastic constants of the fcc and hcp crystals, we used the coordinate system shown in Fig. 1, with the and directions in the hexagonal planes and the direction perpendicular to these planes. For hcp (with hexagonal symmetry), there are six distinct elastic constants, five of which are independentWallace (1970). To make a term-by-term comparison of the fcc and hcp elastic constant, it is convenient to ignore the full symmetry of the fcc crystal, and only use the fact that the crystal also has a lower rhombohedral symmetry. If the symmetry were really rhombohedral, the fcc crystal would have six independent elastic constants. But, if we take the full fcc symmetry into account, only three are linearly independent; the usual fcc elastic constants can be expressed as linear combinations of the rhombohedral elastic constants : , and .
We computed the elastic constants by calculating the stress response to a small applied strain, using molecular dynamics simulations Frenkel and Ladd (1987). At zero deformation, the stress response of a system with isotropic pressure is given by a generalization of Hooke’s law:
| (2) |
For the MD simulations, we used the event-based algorithm described by RapaportRapaport (1980). The pressure tensor is calculated as the time average of the dyadic product of the collisional momentum exchange vector and the particle separation vector for each two-particle collisionAllen and Tildesley (1987).
We performed simulations for a range of amplitudes of each type of deformation. The second-order elastic constants were deduced from the linear part of the stress-strain relation. In principle, all elastic constants can also be calculated in a single simulation using fluctuation methods Parrinello and Rahman (1980); Sprik et al. (1984); Tretiakov and Wojciechowski (2002). However, these methods suffer from slow convergence Sprik et al. (1984). We found the stress-strain method to be the most efficient.
For some deformations, we also computed the third-order elastic constants from the second derivative of the stress tensor with respect to deformation:
| (3) | |||||
The third-order elastic constants appear in the last term.
| 13292 | fcc | 90.51(6) | 13.56(7) | 7.51(7) | -8.77(4) | 96.7(1) | 32.22(6) | |
| hcp | 87.39(8) | 15.95(7) | 7.7(1) | 0 | 96.56(9) | 33.79(4) | ||
| hcp | 87.0(1) | 15.82(9) | 7.83(8) | 0 | 97.1(1) | 33.90(5) | ||
| 216 | fcc | 90.50(8) | 13.8(1) | 7.57(8) | -8.75(6) | 97.0(1) | 32.4(1) | |
| hcp | 87.39(7) | 16.6(1) | 7.56(9) | 0 | 96.67(9) | 35.0(1) | ||
| 216 | fcc | 99.41(9) | 15.2(1) | 8.4(1) | -9.65(4) | 106.16(8) | 35.76(4) | |
| hcp | 95.88(6) | 17.9(1) | 8.6(1) | 0 | 106.1(1) | 37.38(7) | ||
| 13292 | fcc | 146.42(8) | 21.86(7) | 12.1(1) | -13.82(6) | 156.1(1) | 52.33(5) | |
| hcp | 142.1(1) | 25.64(7) | 12.36(8) | 0 | 155.78(9) | 54.56(4) | ||
| 216 | fcc | 146.1(1) | 21.8(2) | 12.1(1) | -14.3(1) | 156.3(3) | 52.8(4) | |
| hcp | 141.8(1) | 25.8(1) | 12.44(9) | 0 | 156.1(4) | 54.9(1) | ||
| 216 | fcc | 366.4(6) | 51.6(4) | 26.4(5) | -35.4(1) | 392(1) | 133.7(2) | |
| hcp | 356.9(4) | 60.3(6) | 27.3(3) | 0 | 390(1) | 138.2(1) | ||
| 216 | fcc | 1463(3) | 189(2) | 89(2) | -145(2) | 1563(3) | 535(2) | |
| hcp | 1423(3) | 223(3) | 97(1) | 0 | 1559(2) | 557(2) | ||
| 216 | fcc | |||||||
| hcp | 0 |
The simulations were performed on systems with , and particles. The maximum applied deformation at lower densities was ; higher densities required even smaller deformations to keep the stress response linear. The measured elastic constants between the melting point (packing fraction Frenkel and Smit (2002)) and close packing are given in table 1.
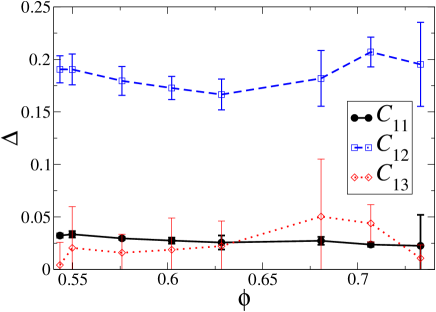
At all densities, the values of the fcc and hcp elastic constants differ significantly (see Fig. 2). The relative differences between the elastic constants appear to remain approximately constant over the entire density range. The largest difference between fcc and hcp (up to 20%) was found for . Yet, the compressibilities of the two phases are identical to within the measurement error. For instance, at melting: vs. (for 1728 particles). We computed these compressibilities in two ways: (a) from the appropriate linear combination of elastic constants and (b) directly from the equation of state Speedy (1998). The results are the same, to within the statistical error. At the same density, the pressures of the fcc and hcp phases are also very similar: and . Finally, the free energies differ only by about per particle Bolhuis et al. (1997); Bruce et al. (1997); Pronk and Frenkel (1999).
| fcc | hcp | |
|---|---|---|
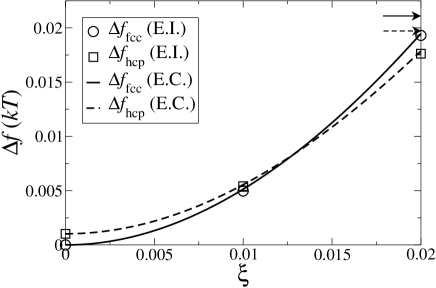
The difference between the fcc and hcp elastic constants is surprising because, already in 1967, Stillinger and Salsburg Stillinger and Salsburg (1967) had pointed out that a simple free-volume model predicts that the fcc and hcp elastic constants should be equal. However, they also showed that pair and triplet correlation effects can lead to differences. Still, we were surprised by the magnitude of the computed differences, in particular for . To double-check our calculations of the elastic constants, we performed a second, fully independent calculation where we directly computed the free energy of the crystals in various states of deformation. The free energy of the (deformed and undeformed) crystals was calculated using a 20-point Einstein integration Frenkel and Smit (2002). We found that the results obtained by the two methods were completely consistent. For example, in Fig. 3, we show the results of the two calculations for free energy change due to a deformation of the form
| (4) |
To lowest order in , , for this deformation. As the figure shows, the differences in elastic constants and , for fcc and hcp, are so large that a deformation of 1.2% is enough to make hcp more stable than fcc. The free energy increase of the fcc phase due to a deformation of 2% is , while for hcp it is only . Fig. 3 also shows the effect of the third-order elastic constants. To within the statistical accuracy of our simulations, the relevant third-order elastic constants (see table 2), were found to be the same for fcc and hcp. Hence, they do not affect the free energy difference between the two lattices.
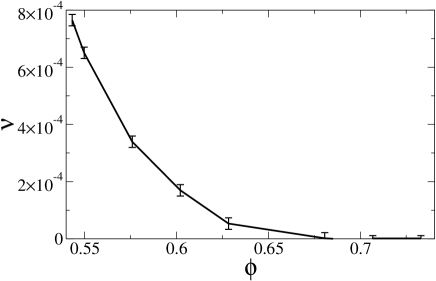
For the undeformed fcc system, all three diagonal components of the pressure tensor are equal. However, this does not hold for a hcp system at the same -ratio (i.e. for the same spacing between the close packed [111]-planes). If we fix the ratio at the fcc value (), the stresses exhibit a slight anisotropy. For the 13292 particle system and are equal (as they should): , . However, is significantly different: . From Eq. 1, we can derive what change in the ratio is needed to make the pressure isotropic. We find that, at melting, isotropy is restored for a ratio of . At higher densities, this value approaches the close-packing value , as can be seen in Fig. 4. Stillinger and Salsburg Stillinger and Salsburg (1967) used the cell-cluster method to estimate the difference of the fcc and hcp ratios. Our simulations show that, close to melting, the effect is one order of magnitude larger than predicted. The free energy difference between the equilibrium hcp and fcc crystals is only slightly changed by this relaxation of the hcp ratio: it becomes per particle for at melting.
As can be seen from the results in table 1 for — where the ratio differs most from fcc — the effect of relaxing to its equilibrium value, is barely significant. For this reason, most hcp elastic constants in table 1 were computed for . The table also shows that the elastic constants depend somewhat on system size, but the effect is too small to change the qualitative picture.
In colloidal-epitaxy experiments Hoogenboom et al. (2003), the best hcp crystals were obtained when the patterned template was stretched by with respect to the expected lattice spacing at the experimental packing fraction (). The templates used matched a diagonal cut through the plane of Fig. 1. Together with the stress produced by gravity (resulting in a strain perpendicular to the template plane of ), this strain is comparable to the strain of Eq. 4 and would result in a free energy difference of about per particle in favor of hcp. The present simulation results may help experimentalists in designing optimal templates to grow selectively colloidal hcp or fcc crystals.
We thank Jacob Hoogenboom (Universiteit Twente) for inspiring discussions about his experimental work. The work of the FOM institute is part of the research program of the Foundation for Fundamental Research on Matter (FOM) and was made possible through financial support by the Dutch Foundation for Scientific Research (NWO).
References
- Bolhuis et al. (1997) P. Bolhuis, D. Frenkel, S.-C. Mau, and D. A. Huse, Nature 385, 131 (1997).
- Bruce et al. (1997) A. D. Bruce, N. B. Wilding, and G. J. Ackland, Phys. Rev. Lett. 79, 3002 (1997).
- Pronk and Frenkel (1999) S. Pronk and D. Frenkel, J. Chem. Phys. 110, 4589 (1999).
- Zhu et al. (1997) J. Zhu, M. Li, R. Rogers, W. Meyer, R. H. Ottewill, STS-73 Space Shuttle Crew, W. B. Russel, and P. M. Chaikin, Nature 387, 883 (1997).
- Petukhov et al. (2003) A. V. Petukhov, I. P. Dolbnya, D. G. A. L. Aarts, G. J. Vroege, and H. N. W. Lekkerkerker, Phys. Rev. Lett. 90, 028304 (2003).
- Cheng et al. (2002) Z. Cheng, P. M. Chaikin, J. Zhu, W. B. Russel, and W. V. Meyer, Phys. Rev. Lett. 88, 015501 (2002).
- Kegel and Dhont (2000) W. K. Kegel and J. K. G. Dhont, J. Chem. Phys. 112, 3431 (2000).
- Martelozzo et al. (2002) V. C. Martelozzo, A. B. Schofield, W. C. K. Poon, and P. N. Pusey, Phys. Rev. E 66, 021408 (2002).
- Hoogenboom et al. (2003) J. P. Hoogenboom, A. K. van Langen-Suurling, J. Romijn, and A. van Blaaderen, Phys. Rev. Lett. 90, 138301 (2003).
- Wallace (1970) D. C. Wallace, in Solid State Physics: Advances in Research and Applications, edited by H. Ehrenreich, F. Seitz, and D. Turnbull (Academic Press, New York, 1970), pp. 301–404.
- Frenkel and Ladd (1987) D. Frenkel and A. J. C. Ladd, Phys. Rev. Lett. 59, 1169 (1987).
- Rapaport (1980) D. C. Rapaport, J. Comp. Phys. 34, 184 (1980).
- Allen and Tildesley (1987) M. P. Allen and D. J. Tildesley, Computer Simulation of Liquids (Oxford University Press, Oxford, 1987).
- Sprik et al. (1984) M. Sprik, R. W. Impey, and M. L. Klein, Phys. Rev. B 29, 4368 (1984).
- Tretiakov and Wojciechowski (2002) K. V. Tretiakov and K. W. Wojciechowski, J. Phys. Cond. Matt. 14, 1261 (2002).
- Parrinello and Rahman (1980) M. Parrinello and A. Rahman, Phys. Rev. Lett. 45, 1196 (1980).
- Frenkel and Smit (2002) D. Frenkel and B. Smit, Understanding Molecular Simulation (Academic Press, London, 2002), 2nd ed.
- Speedy (1998) R. J. Speedy, J. Phys. Cond. Matt. 10, 4387 (1998).
- Stillinger and Salsburg (1967) F. H. Stillinger and Z. W. Salsburg, J. Chem. Phys. 46, 3962 (1967). As the cell-cluster expansion converges poorly, its numerical predictions differ very considerably (more than 100%) from the simulation data.