Variation of metal-insulator transition and formation of bipolarons by the Cd-doping in the thiospinel system of Cu1-xCdxIr2S4
Abstract
The pseudo-binary thiospinel system Cu1-xCdxIr2S4 was investigated by the x-ray diffraction, electrical resistivity, magnetic susceptibility and specific heat measurements. It was shown that the system exhibits a miscibility-gap behavior for the Cd substitution, however, nearly monophasic samples was obtained by quenching at 1373 K, except for . With increasing the Cd concentration, the room-temperature electrical conductivity and Pauli susceptibility decrease monotonically, consistent with the hole-filling picture. The first-order metal-insulator transition at about 230 K in the parent compound CuIr2S4 is changed into a second-order transition around 185 K when 0.25, whereafter the second-order transition disappears at . No superconductivity was observed down to 1.8 K. The end-member compound CdIr2S4 is shown as an insulator with a band-gap of 0.3 eV. Analysis for the data of magnetic susceptibility and electrical resistivity suggests the formation of bipolarons below 185 K for 0.8, which accounts for the absence of superconductivity in terms of the transition from the BCS Cooper pairs to small bipolarons.
pacs:
71.30.+h, 72.80.Ga, 75.40.Cx, 71.38.MxI INTRODUCTION
Thiospinel CuIr2S4 has recently attracted much interest for its novel metal-insulator (MI) transition. Nagata94 ; Hagino ; Furubayashi94 ; Oomi ; Suzuki ; Cao01 ; Radaelli ; Oda ; Kumagai ; Matsuno The MI transition takes place at about 224 K on cooling, accompanied by a sudden increase of the electrical resistivity, a quenching of the Pauli magnetic susceptibility, and a structural phase transition towards lower symmetry. Nagata94 ; Hagino ; Furubayashi94 It was found that the MI transition temperature increases with applying pressures. Furubayashi94 ; Oomi Recently, we found that the Zn substitution for Cu resulted in appearance of superconductivity by the suppression of the MI transition. Suzuki ; Cao01
The mechanism of the MI transition has remained an open question. We have elucidated it in terms of the interatomic Coulomb interactions and the dimerizations of Ir4+ based on the Zn substitution result. Cao01 Very recently, the low-temperature insulating phase was revealed to be charge ordered and spin-dimerized, Radaelli consistent with our proposal. However, further studies are needed to clarify the driving force of the unusual spin-dimerization in a three dimensional compound.
In this paper, we studied the Cu1-xCdxIr2S4 system based on the following considerations. First, the cadmium substitution at the A-site of the normal spinel AB2X4 hardly changes the IrS6-octahedron framework, which determines the electronic structure of the valence bands. Oda Second, the valence state of Cu has been confirmed to be 1+, Kumagai ; Matsuno and the energy level of Cu 3 or Cd 4 is far below the Fermi energy . Therefore, the Cd-substitution is expected to alter the carrier concentration like the Zn-substitution does in Cu1-xZnxIr2S4. Third, the ionic radius of Cd2+ is obviously larger than that of Cu1+ or Zn2+. Shannon So, the Cd substitution will bring in a negative chemical pressure for the lattice, which is expected to affect both of the charge ordering and the spin dimerization. Finally, one would be interested in whether or not superconductivity could also appear in the Cd-substitution system.
II EXPERIMENTS
Samples of Cu1-xCdxIr2S4 (=0, 0.025, 0.05, 0.1, 0.15, 0.2, 0.25, 0.3, 0.4, 0.5, 0.6, 0.7, 0.8, 0.9 and 1.0) were prepared by the chemical reaction in a sealed quartz ampoule. The starting material was Cu, CdS, Ir and S powders with the purity higher than 99.9%. The sealed ampoule was first heated slowly to 1023 K, and then fired at 1373 K for 96 hours. In order to increase the Cd solubility, samples were quenched. The as-prepared powder was pressed into pellets with the pressure of 2000 kg/cm2, and the pellets were sealed and sintered at the same temperature for 48 hours and then quenched.
Powder x-ray diffraction (XRD) was carried out at room temperature with CuK radiation by employing a RIGAKU X-ray Diffractometer. The crystal structure was refined by the RIETAN Rietveld analysis program. Izumi The electrical resistivity ( was measured by the standard dc four-probe method down to 2 K. The magnetic susceptibility () was measured by using a Quantum Design SQUID magnetometer, whose precision achieves emu. The measurement was carried out using about 100 mg samples in both cooling and heating processes between 1.8 K and 300 K under applied field of 1000 Oe. The background was measured in advance and then subtracted, so that the net value could be accurately obtained. Finally, the heat capacity was measured on a Quantum Design PPMS system using an automated relaxation technique.
III RESULTS AND DISCUSSION
Fig. 1 shows the XRD patterns for some of the Cu1-xCdxIr2S4 samples quenched at 1373 K. nearly single spinel phase is indicated for 0 0.4 and . For =0.5 and 0.6 samples, however, there exist two additional broad peaks on both sides of every diffraction position. Detailed analysis indicates that the sample contains three spinel phases with different lattice constants. The phase with the sharp XRD peaks is the metastable solid-solution phase, obtained by the quenching. However, since the quenching time was not short enough (Note that the sample was sealed under vacuum in a quartz tube), the metastable solid-solution phase decomposes into the Cd-rich and Cd-poor phases during the cooling process. As the quenching temperature is lowered, the Cd (or Cu) solubility decreases obviously. For example, the Cd solubility is found to be 0.15 when quenched at 1123 K. So, the Cu/Cd substitution in the Cu1-xCdxIr2S4 system exhibits miscibility gap behavior.

The XRD data of the monophasic samples can be successfully fitted by the Rietveld refinement method, Izumi which gives the lattice constant and parameter for the thiospinel system. It is also indicated that the Cu1-xCdxIr2S4 system crystalizes in normal spinel structure, in which Cu/Cd and Ir occupy A and B sites, respectively. Fig. 2 shows the crystal structure parameters as a function of Cd content. It can be seen that the lattice constant increases linearly with increasing Cd substitution, obeying the Vegard’s law, except for the case of the additional phases separated during the quenching process. The parameter, which determines the atomic position of sulfur, also increases linearly. As expected, the Cu/Cd-S (denoted as A-S) interatomic distance increases remarkably due to the lattice expansion. However, the Ir-S bond distance increase little, which is structurally related to the stretching of the IrS6 octahedra along [111] directions. Compared with the result of the Cu1-xZnxIr2S4 system, Cao01 though the Ir-S interatomic distance has no much difference against the A-site substitution, the IrS6 octahedra are obviously more distorted in the present system.
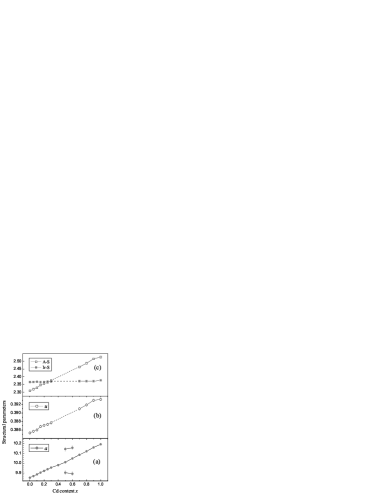
Fig. 3 shows the temperature dependence of resistivity in the Cu1-xCdxIr2S4 system. The parent compound CuIr2S4 undergoes a MI transition at 228 K with an obvious thermal hysteresis, consistent with the earlier literatures. Nagata94 ; Hagino ; Furubayashi94 The MI transition temperature decreases to 185 K when =0.05. With further increasing the Cd substitution, the value does not decrease anymore. However, the thermal hysteresis tends to disappear at this stage. At =0.25, no thermal hysteresis is detectable. The sudden change in resistivity evolves into an inflexion for the ) curve at the temperature . This suggests a crossover from a first-order transition to a higher-order one. When 0.8, even an inflexion cannot be observed in the whole temperature range. The end member CdIr2S4 shows an insulating behavior. The Arrhenius fitting for the data from 200 K to 300 K gives the activation energy of 0.15 eV. So, the band gap is about 0.30 eV if assuming that the sample is an intrinsic semiconductor. No superconducting transition was observed down to 2 K.

It has been revealed that the low-temperature triclinic phase of CuIr2S4 is a charge ordered insulator with Ir4+ dimerizations. Radaelli Very recently, -orbital orientation ordering along Ir chains was suggested to account for the x-ray absorption measurement result. Croft The model shows the direct -orbital overlap between Ir4+, like the case proposed in Ti4O7. Lakkis ; Cao01 If we describe the Ir4+-dimers as spin-singlet small bipolarons, and regardless of the microscopic mechanism for the bipolaron formation, the electronic state of the triclinic CuIr2S4 may be regarded as ”bipolaron crystals”. Kobayashi As stated above, the thermal hysteresis associated with the structural phase transition from cubic to triclinic disappears at =0.25. This rules out the possibility of the bipolaron crystals for 0.25 samples (Further low-temperature structural analysis is needed to confirm this point). Noted that the resistivity increases rapidly at the with decreasing temperature. We suggest that this is due to the formation of disordered Ir4+-dimers, which can be described as a ”bipolaron liquid”. Kobayashi Theoretically, Emin Emin studied the hopping transport for the singlet small bipolarons. It was shown that one-electron transfers involving small polarons coming from the bipolaron pair-breaking always dominate the dc conductivity. Therefore, when bipolarons form at , the concentration of the mobile carriers decreases rapidly, resulting in the fast increase in the resistivity.
Low-temperature conductivity behaviors may give information for the insulating properties. Considering the formation of bipolarons and three-dimensional variable-range-hopping (VRH) of localized carriers, Mott we employed a two-channel conduction equation, Cao01
| (1) |
The first term describes the conductivity contribution due to the thermally activated bipolaron pair-breaking. The second term expresses the VRH conduction of the localized carriers. According to Emin’s description for strong small-bipolaron binding , Emin , where , and denote the binding energy of small bipolarons, on-site Coulomb repulsion and the transfer energy between sites, respectively.
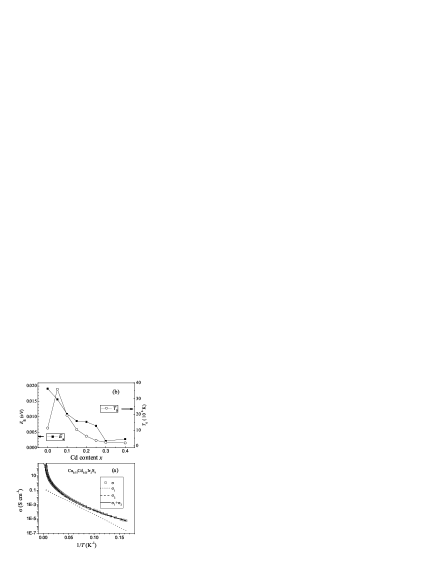
Fig. 4(a) shows the typical least-squared fitting for the =0.25 sample using Eq. (1). It can be seen that the activated component is needed to improve the fitting. Table 1 gives the values of fitted parameters. To reveal the Cd-doping dependence, and are plotted as a function of Cd content in Fig. 4(b). One can see that decreases with increasing Cd content. In the following analysis on the magnetic susceptibility, is shown to decease sharply at low Cd-doping, then keeps almost unchanged. So, the rapid decrease in at low Cd-doping is mainly due to the change of , since . Another parameter in Fig. 4(b) is found to increase abruptly for small Cd-doping, and then decrease monotonically as Cd content increases. Similar result was also observed in the Zn-doped system. Cao01 The rapid increase of at low Cd-doping may be due to enhanced localization resulting from doping-induced disorder. As the doping level is increased, however, the ratio of Ir3+:Ir4+=1:1 for a charge-ordered state is not satisfied. One may expect that the density of localized states at the Fermi level increases with the Cd doping, resulting in the decrease of . Mott
| (S cm-1) | (eV) | (106 S cm-1) | (106 K) | |
|---|---|---|---|---|
| 0 | 0.083(1) | 0.0191(1) | 3.1(1) | 11.4(1) |
| 0.05 | 0.071(3) | 0.0157(1) | 3200 | 36(2) |
| 0.1 | 0.004(1) | 0.0109(3) | 600 | 19.5(4) |
| 0.15 | 0.009(2) | 0.0086(2) | 95(6) | 10.4(1) |
| 0.2 | 0.07(1) | 0.0084(2) | 26(1) | 6.2(1) |
| 0.25 | 0.16(1) | 0.0071(1) | 5.0(1) | 3.52(3) |
| 0.3 | 0.013(1) | 0.0022(1) | 0.9(1) | 2.3(1) |
| 0.4 | 0.021(2) | 0.0028(1) | 0.51(4) | 1.95(5) |
Fig. 5 shows the temperature dependence of magnetic susceptibility for some Cu1-xCdxIr2S4 samples. At the MI transition for CuIr2S4, the susceptibility has an abrupt change with a distinct thermal hysteresis, because the Ir4+ (=1/2) spin in the low-temperature triclinic phase forms spin-singlet dimers. Radaelli With increasing the Cd content, first decreases ( 0.05) rapidly and then keeps unchanged (0.05 0.3), in confirmation with the above resistivity result. Similarly, the thermal hysteresis disappears at =0.25. However, the susceptibility drop is still obvious at 185 K, which supplies further evidence of the bipolaron formation. When , even the drop in is not detectable. For the insulating end member CdIr2S4, the value is emu/mol, almost the same as the susceptibility of the low-temperature insulating phase of CuIr2S4. Cao01 No sign of superconductivity is observed above 1.8 K for all the samples.
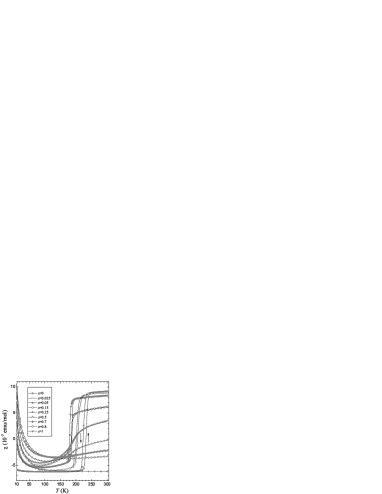
We note that the minimal susceptibility value for the samples other than the end members is substantially larger than emu/mol. This cannot be explained only by the impurity moments. Emin Emin suggests that certain paramagnetic susceptibility may be produced due to the thermal activation of the small bipolarons. So, similar to our previous treatment, Cao01 the low-temperature susceptibility data for the 0.7 samples were analyzed using the equation below
| (2) |
The first term on the right, including the core diamagnetism and the Pauli paramagnetism , is assumed to be temperature independent. The second term is the Curie-Weiss paramagnetism part (), coming from impurities and/or the lattice imperfections. The last term describes the pair-breaking of the bipolarons (), where is the energy to activate one localized spin. If the exchange energy in a Ir4+ dimer is , we have, , where is the Coulomb repulsion between the two carriers in a small bipolaron.
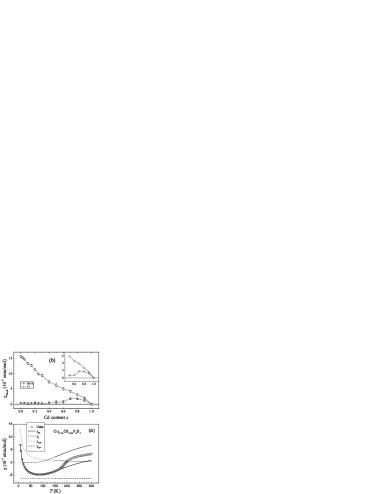
Fig. 6(a) shows the least-squared fitting for =0.25 sample using Eq. (2). It can be seen that the fitting is quite good. The Curie-Weiss contribution mainly accounts for the susceptibility upturn at low temperatures, while the term elucidates the temperature dependence of susceptibility just below . The fitted parameters are listed in Table 2. As can be seen, the value is rather small, corresponding to . The data gives the effective moment for the pair-broken spin, and tends to increase with increasing Cd content.
| (10-5 emu/mol) | (emu K/mol) | (K) | (emu K/mol) | (K) | |
|---|---|---|---|---|---|
| 0 | -6.35(1) | 0.000071(1) | -3.6(1) | 0.0395(7) | 977(3) |
| 0.025 | -6.40(5) | 0.00037(2) | -1(1) | 0.069(1) | 774(10) |
| 0.05 | -6.30(2) | 0.00066(1) | -0.3(1) | 0.061(1) | 565(5) |
| 0.1 | -6.44(4) | 0.00116(1) | -0.7(2) | 0.095(1) | 563(9) |
| 0.15 | -6.39(6) | 0.00095(3) | -1.0(8) | 0.130(1) | 566(9) |
| 0.2 | -6.17(7) | 0.00132(1) | -1.0(2) | 0.126(5) | 551(2) |
| 0.25 | -6.36(5) | 0.00120(1) | -0.7(2) | 0.130(2) | 561(5) |
| 0.3 | -6.43(3) | 0.00205(1) | -2.1(1) | 0.118(1) | 540(1) |
By employing the fitted parameters in Table 2, the values in the high-temperature state can be roughly extracted from the values assuming that =++, where the is approximately treated as the value of the insulator CdIr2S4. As shown in Fig. 6(b), the room-temperature value decreases almost linearly, indicating that the density of state at decreases with increasing Cd content since . Therefore, one may conclude that the Cd substitution fills the hole carriers, resulting in the increase of resistivity and the decrease of magnetic susceptibility. Compared with the result of the Zn substitution, Cao01 the present Cd substitution leads to sharper decrease in the , implying that valence band width of the Cd-substituted system is narrower. This is consistent with the lattice expansion due to the Cd substitution.
The values in the low-temperature state, if exists, can also be estimated in a similar way. It is shown in Fig. 6(b) that the low-temperature value keeps nearly zero for , consistent with the picture of dimerizations of Ir4+. This result is in sharp contrast with that of Cu1-xZnxIr2S4 system. The latter system shows that changes rapidly from -6.2 emu/mol for =0.1 to -1.5 emu/mol for =0.25, which was explained by the fact of two-phase coexistence. Cao01 Therefore, it is very likely that the present Cd-doping system keeps only one phase at low temperatures for . Low-temperature XRD measurement is needed for confirming this point. When , however, the low-temperature is remarkably increased, indicating that the bipolarons become unstable. This is consistent with the fact that the samples shows no transition into the bipolaron state at all in the whole temperature range. Therefore, the solid solution in the range of 0.8 1 can be regarded as a polaronic semiconductor. In the case of 0.4 0.6, the non-zero is observed, which is probably originated from the contribution of Cd-rich phase formed during the quenching process.
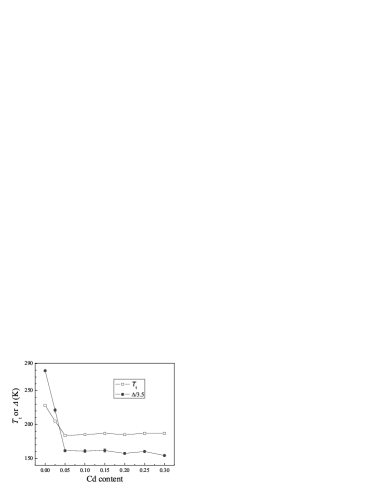
Fig. 7 shows the fitted values as well as the transition temperature ( or ) for Cu1-xCdxIr2S4 system. It can be seen that changes in the same tendency as the does. This indicates that the formation of the Ir4+-dimers or the bipolarons is closely relevant to the first-order or the second-order transitions at .
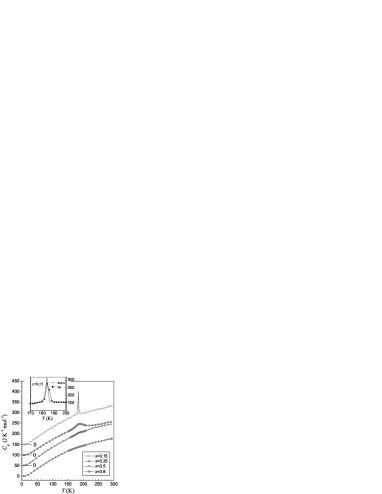
The result of heat capacity measurement is shown in Fig. 8. For =0.15, a sharp peak can be seen at the , accompanied with a thermal hysteresis. This is consistent with the first-order phase transition. The enthalpy and entropy of the transition are 450 J mol-1 and 2.43 J K-1 mol-1, respectively. When =0.25, a broad peak can be seen at the on the background of the lattice specific heat, but no thermal hysteresis was observed. This observation indicates that the transition is of second order. In the case of =0.5, detectably small peak appears at 185 K. For =0.8, no second order transition can be found. By using the Debye theory, the Debye temperature was determined to be about 100 K, independent of the Cd content.
Based upon the above result, the phase diagram of Cu1-xCdxIr2S4 can be concluded as shown in Fig. 9(a). In the low Cd-doping region, the high temperature phase is a cubic metal. The low temperature phase is a triclinic insulator with charge ordering and Ir4+-dimerization, called bipolaron crystals. It is noted that the MI transition temperature first drops rapidly, then remains unchanged. For the intermediate Cd-doping (), the first-order transition is changed into a second order one at the . It is noted that the is almost independent of Cd content. This may be relevant to the fact that Ir-S bond distance hardly changes with the Cd content. The phase above the becomes a kind of semiconductor as called a polaronic semiconductor, while the phase below the can be described as a bipolaron liquid. It is noted that the present samples of =0.5 and 0.6 contain multiple spinel phases due to the miscibility-gap effect. In the case of heavy Cd substitution (), the hole concentration is so low that bipolaron is not stable anymore. Furthermore, with increasing the hole filling, the Fermi level may move across the mobility edge, Mott locating in the Anderson localization state. So, the sample shows a semiconducting behavior. The end member CdIr2S4 is a band insulator.
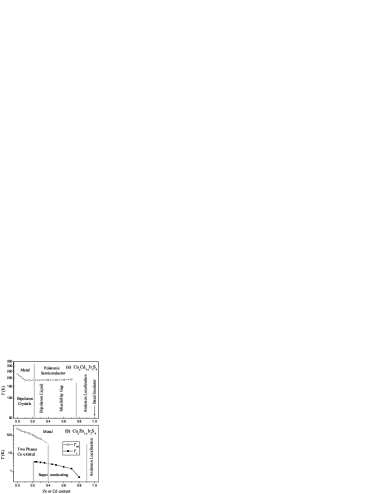
The phase diagram differs much from that of an analogue Cu1-xZnxIr2S4 system shown in Fig. 9(b). Cao01 One striking difference is that the Zn-doping induces superconductivity below 3 K, while the Cd-doping does not lead to any superconducting ground state. Instead of the superconducting Cooper pairs, small bipolarons become stable in the range of 0.25 0.8 for the Cd-substituted system. Theoretically, Chakraverty Chakraverty earlier showed that a Cooper-pair superconductor may change into a bipolaronic insulator when the electron-phonon coupling constant goes beyond a critical value. It was also stressed that the coupling constant increases with decreasing the bandwidth in the strong coupling regime. Therefore, the absence of superconductivity in the Cd-substituted system is possibly ascribed to the relatively small bandwidth arising from the negative chemical pressure by the Cd substitution. Nevertheless, the physical pressure effect in Cu1-xZnxIr2S4 system Cao03 reveals the opposite tendency. The applied pressure, which is generally assumed to increase the bandwidth, induces a superconductor-to-semiconductor transition. The low-temperature semiconducting phase was also associated with the bipolaron formation. Such contradiction deserves further investigations.
Another difference concerns the electrical conduction for the intermediate doping. The semiconducting behavior above in Cu1-xCdxIr2S4 () seems to be rather unusual. We note that the value of the present system is much smaller than the corresponding one in Cu1-xZnxIr2S4. This means that the density of state at is much lower in the Cd-doped system. However, to elucidate the semiconducting behavior, one may need to consider the distortion of the IrS6 octahedra as well as the Anderson localization effect.
IV CONCLUSION
In summary, the Cd substitution for Cu in CuIr2S4 system was studied for understanding the variation of the MI transition and the effect of chemical pressures on the charge ordering and the Ir4+ dimerizations. The XRD structural analysis indicates that the Cd substitution increases the lattice constant and the distortion of IrS6 octahedra obviously, but affects the Ir-S bond distance quite little. By the measurement of temperature dependence of electrical resistivity, magnetic susceptibility and specific heat, the electronic phase diagram has been tentatively established, which is quite different from an analogue system of Cu1-xZnxIr2S4. It is found that the first-order MI transition at 228 K in the parent compound CuIr2S4 is at first suppressed to a level of 185 K, and then changed into a second-order transition for 0.2. The second-order transition disappears when 0.8. The end-member compound CdIr2S4 is shown as an insulator with a band-gap of 0.3 eV. Both the electrical resistivity and the magnetic susceptibility data suggest that the phase below the can be described as a bipolaron liquid. The absence of superconductivity in the present system can thus be understood in terms of the transition from the BCS Cooper pairs to small bipolarons due to the decrease of the bandwidth resulted from the negative chemical pressures.
Acknowledgements.
We are indebted to Dr. T. Sato for the chance to use the SQUID magnetometer. One of the authors (Cao) acknowledges the support from NSFC with the Grant No. 10104012.References
- (1)
- (2) S. Nagata, T. Hagino, Y. Seki, T. Bitoh, Physica B 194-196, 1077 (1994).
- (3) T. Hagino, T. Toji, T. Atake and S. Nagata, Philosophical Magazine B 71, 881 (1995).
- (4) T. Furubayashi, T. Matsumoto, T. Hagino, S. Nagata, J. Phys. Soc. Japan 63, 3333 (1994).
- (5) G. Oomi, T. Kagayama, I. Yoshida, T. Hagina, S. Nagata, J. Magn. Magn. Mater. 140-144, 157 (1995).
- (6) H. Suzuki, T. Furubayashi, G. Cao, H. Kitazawa, A. Kamimura, K. Hirata and T. Matsumoto, J. Phys. Soc. Japan. 68, 2495 (1999).
- (7) G. Cao, T. Furubayashi, H. Suzuki, H. Kitazawa, T. Matsumoto, and Y. Uwatoko, Phys. Rev. B 64, 214514 (2001).
- (8) P. G. Radaelli, Y. Horibe, M. J. Gutmann, H. Ishibashi, C. H. Chen, R. M. Ibberson, Y. Koyama, Y. S. Hor, V. Kiryukhin, and S. W. Cheong, Nature 416 (2002) 155.
- (9) T. Oda, M. Shirai, N. Suzuki, and K. Motizuki, J. Phys.: Condens. Matter 7, 4433 (1995).
- (10) K. Kumagai, S. Tsuji, T. Hagino, and S. Nagata, in: Spectroscopy of Mott Insulators and Correlated Metals, edited by A. Fujimori and Y. Tokura (Springer-Verlag, Berlin, 1995), p.255.
- (11) J. Matsuno, T. Mizokawa, A. Fujimori, D. A. Zatsepin, V. R. Galakhov, E. Z. Kurmaev, Y. Kato, and S. Nagata, Phys. Rev. B 55, R15979 (1997).
- (12) R. D. Shannon, Acta Cryst. A 32, 751 (1976).
- (13) F. Izumi: The Rietveld Method, ed. R. A. Young (Oxford University Press, Oxford, 1993) Chap. 13; Y. –I. Kim and F. Izumi: J. Ceram. Soc. Jpn. 102, 401 (1994).
- (14) M. Croft, W. Caliebe, H. Woo, T. A. Tyson, D. Sills, Y. S. Hor, S-W. Cheong, V. Kiryukhin, and S-J. Oh, Phys. Rev. B 67, 201102 (2003).
- (15) S. Lakkis, C. Schlenker, B. K. Chakraverty, R. Buder, and M. Marezio, Phys. Rev. B 14, 1429 (1976).
- (16) K. Kobayashi, T. Susaki, A. Fujimori, T. Tonogai, and H. Takagi, Europhysics Letters 59, 868 (2002).
- (17) D. Emin, Phys. Rev. B 53, 1260 (1996).
- (18) N. F. Mott, Metal-Insulator Transitions (Taylor & Francis, London, 1990).
- (19) B. K. Chakraverty, J. Physique 42, 1351 (1981).
- (20) G. Cao, T. Naka, H. Kitazawa, M. Isobe, and T. Matsumoto, Phys. Lett. A 307, 166 (2003).