Experimental phase diagram of moving vortices
M. Hilke, S. Reid, R. Gagnon, and Z. Altounian
Dpt. of Physics, McGill University, Montréal, Canada H3A
2T8
In the mixed state of type II superconductors, vortices penetrate the sample and form a correlated system due to the screening of supercurrents around them. Interestingly, we can study this correlated system as a function of density and driving force. The density, for instance, is controlled by the magnetic field, , whereas a current density acts as a driving force on all vortices. The free motion of vortices is inhibited by the presence of an underlying potential, which tends to pin the vortices. Hence, to minimize the pinning strength we studied a superconducting glass in which the depinning current is 10 to 1000 times smaller than in previous studies, which enables us to map out the complete phase diagram in this new regime. The diagram is obtained as a function of , driving current and temperature and led a remarkable set of new results, which includes a huge peak effect, an additional reentrant depinning phase and a driving force induced pinning phase.
The Peak effect (PE), which is one of the most intriguing consequences of the motion of vortices in superconductors, is a peak in the critical current as a function of and typically occurs below, but near, the critical field () in some strong type II conventional superconductors belincourt ; rosenblum ; pippard ; kes ; higginsexp . In high temperature superconductors the is also observed but usually appears well below hitcexp as inferred from magneto-transport measurements. The can lead to a reentrant superconducting phase as a function of or when a current slightly below the maximum critical current is applied. Above the critical current, vortices experience a force strong enough to be depinned and they start moving, which leads to a non-zero electrical field and hence to a non-zero resistance, where is the average vortex velocity. At the the vortices are pinned again, which decreases the resistance and enhances the critical current. While the exact mechanism of the is not fully understood, recent experiments on have correlated the with the disappearance of neutron scattering Bragg peaks from the vortex structure. This was attributed to the transition from a long-range ordered phase to a short-ranged disordered phase, which in turn is pinned more efficiently proorderdisorder ; troyanovski . This transition can be induced either by increasing disorder or equivalently by increasing , since the disorder potential couples to all vortices, hence effectively increasing with . However, recent experiments on have questioned the amorphous nature of the phase in the regime conorderdisorder .
In this work we investigate the vortex dynamics in a system with the weakest possible pinning potential. It is well known that amorphous superconductors have a lower critical current than crystals because of the absence of long-range order, which implies weaker collective pinning. The remaining pinning is then mainly governed by impurities. We therefore used high purity based superconducting glasses, which have a similar critical temperature () and as the widely studied crystalline system higginsexp and others rosenblum ; pippard ; hitcexp ; troyanovski ; proorderdisorder ; conorderdisorder , but our amorphous samples exhibit a critical current density, (), just below the t, which is typically 100 to 1000 times smaller. In comparison to earlier studies on the in amorphous films, our samples still have a 10 times smaller belincourt ; kes ; kes2 ; wordenweber , which reflects the high level of purity of our samples.
We obtained these high purity superconducting glasses by melt spinning altounian with different values of x. Although we only present results for x=0.3, qualitatively very similar features were obtained for x=0, 0.1 and 0.2, which suggests that these effects are inherent to these types of materials and do not depend critically on composition. The transition temperature () for x=0.3 is K as extracted from three different samples. The sharpness of the transition region is quite remarkable, with a transition temperature width (10-90% value) ranging between 5 and 20mK for all three samples, indicative of very homogenous samples. The absence of crystallinity is confirmed by the absence of Bragg peaks in X-ray diffraction. The samples have the following typical sizes (thickness=m, width=1.15mm, and length between indium contacts=8mm). Using standard expressions for superconductors in the dirty limit kes , we can estimate the different length scales in our system. The zero temperature penetration depth is , the BCS coherence length is (or 8.3nm using GL), the Ginzburg-Landau (GL) parameter and mT. Relevant experimental quantities are K, T, m (normal resistivity) and T/K. These numbers are typical for a strong type II low- material.
Since moving vortices give rise to a non-zero resistance in a superconductor, we measured the -dependence of the magneto-resistance for different currents to probe the dynamics of the vortices. The results are presented in figure 1. The most striking feature is the -induced reentrant superconducting phase for currents above 0.07mA. Such a strong reentrant superconductor was never observed before in any amorphous superconductor. However, because we observed a similarly strong reentrant behavior for different concentrations of (=0, 0.1, and 0.2), we believe that this effect is very general for high purity and weakly pinned amorphous superconductors. Indeed, when comparing our results to previous studies on the in amorphous superconductors belincourt ; kes ; kes2 ; wordenweber , the most notable difference is the critical current, which is a measure of the pinning strength and is at least 10 times smaller in our samples, indicating that weak pinning enhances the reentrant behavior. The reentrant behavior is the most dramatic signature of the , which disappears below 0.07mA and implies a peak in the critical current in the region of the reentrant superconductor.
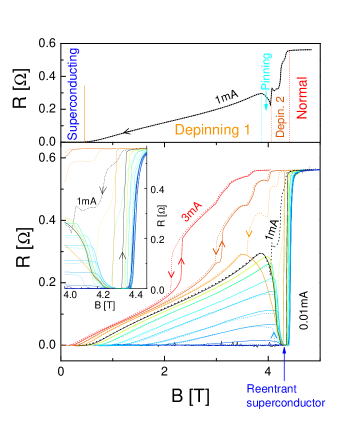
We map-out the phase diagram of the moving vortices using the dissipative transport in figure 1 and illustrated by the top figure with the help of the 1mA down-sweep curve. The results of the diagram are presented in figure 2. At low fields we have the first depinning transition defined when the resistance exceeds 0.5m, which is our experimental resolution. The choice of this cut-off is not critical since close to the depinning transition the dependence of the resistance on is stronger than exponential. When increasing further, the system becomes more and more resistive for currents above 0.07 mA. In this region, which we denote depinning 1, the vortices start moving. At even higher , the moving vortices are pinned again in the pinning region, which leads to the reentrant superconducting phase inside this pinning region. The pinning transition is defined when . Inside the pinning region, the resistance eventually vanishes within our experimental resolution (0.5m). Finally, at high enough we cross and the system becomes normal. is defined as the point of strongest negative curvature just before reaching the normal state. At higher driving currents we observe another region, labelled depinning 2, which corresponds to a sudden increase of resistance after the pinning or depinning 1 regions, indicative of another depinning transition, before reaching , which is defined as the point of highest positive curvature.
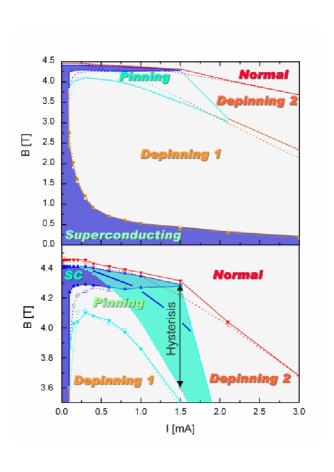
A striking feature of the phase diagram is the huge at 4.3T. Indeed, the critical current, which delimits the superconductor (shaded in dark blue in figure 2) from the non-zero resistance depinned phases, jumps from 0.07mA to 1.5mA close to 4.3T. This is associated with the depinning 1 - to - pinning transition of the vortices.
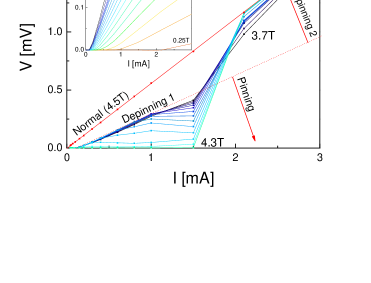
Quite generally, the depinning 1 region is characterized by weakly pinned vortices, which move beyond a -dependent activated threshold. Giamarchi and co-workers giamarchiBG argued that this phase is a long-range ordered moving Bragg glass (MBG), consistent with a recent experiment showing algebraic neutron scattering Bragg peaks in this region with measurements performed on giamarchiBGexp . Our results support this picture since the dependence of the voltage (V) on current (I) below the for -fields between 0.25 and 3.75T, (as illustrated in the inset of figure 3), is well fitted by the activated creep expression . reflects the pinning strength and the expression was derived directly from the equation of motion creepIV and assumes a long-range ordered phase, such as a Bragg glass. The long-range nature of this phase can be inferred from the geometry dependent transition point. Indeed, when tilting the field so that is aligned along the wide axis of the sample (instead of perpendicular to it), the transition is shifted upwards between 1.5T and 2.5T depending on the current. Since the sample is amorphous and 1mm wide but only 20m thick this implies long range order above 20m. This transition is the only one, which is significantly affected by the tilted field below 1.5mA, suggesting that the remaining phases have short-ranged order.
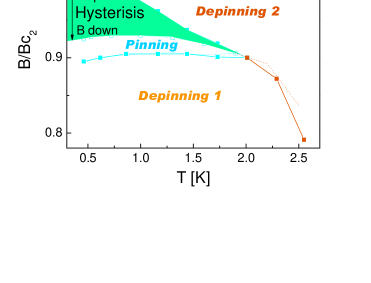
At higher the pinning increases in the region. In this region the inter-vortex distance is close to , which is the size of the vortex core and implies strong inter-vortex correlations. The exact nature of this pinning transition is still under debate, but is commonly associated with an order-disorder transition giamarchirev , the melting of the vortex structure larkin or the anomalous friction close to nissila . Experimentally, the reentrant superconductor is nonetheless the most spectacular demonstration for the existence of a depinning - to - pinning transition. In figure 2, the reentrant superconductor is shaded in dark blue, which is included in the pinning region delimited by the light blue line. We mapped out the pinning regions for both -sweep directions up (solid lines) and down (dotted lines) and observed an increasing hysteresis as a function of driving current, which is the region shaded in light blue. The region of hysteresis does not depend on the sweeping rate and is stable once reached. The left inset of figure 1 shows details of the region of hysteresis and the -sweep direction is labelled with corresponding arrows. The hysteresis is particularly striking, when coming from the low region into the pinning region. Indeed, at a fixed T and , the sample is superconducting, then we can either increase the current to 2mA and back or sweep to 4.5T and back, or increase to 1K and back, and the sample is no longer superconducting and remains dissipative on time scales beyond our experiment. Sweeping to 3.5T and back recovers a highly stable superconducting phase. Hence, for the same and we can have two different phases, which are stable over very long time scales. Moreover, when increasing the temperature, the size of the region of hysteresis decreases and eventually vanishes as illustrated in figure 4 (the light blue shaded region). Since the dependence on temperature is non-critical, this transition is strongly suggestive of a first order phase transition inside the region of hysteresis, which we indicated as a thick dashed line in figure 2. This is in agreement with earlier experiments on crystals zeldov ; twophases , but in our system this first order transition is not associated with the formation of the pinning region but rather with the transition to the depinning 2 phase at -fields above the .
This additional depinning 2 phase between the and the normal phase is only seen at sufficiently high driving currents (figure 2) and is masked by the hysteresis at low and becomes more apparent at higher as seen in figure 4. This hints to a much richer transition region between the and the normal state than previously expected and constitutes an important new experimental finding for the theoretical understanding of these systems.
At even higher currents the depinning 2 region can be reached directly from the depinning 1 region, which corresponds to a sudden delocalization of the vortices identified by a jump in the resistance. This region is not an inhomogeneous mix of normal and superconducting regions because at low currents the superconducting - to - normal transition is extremely sharp, i.e., less than 50mT wide for the 10-90%, which excludes any large scale inhomogeneities in the sample. This type of transition is consistent with several theoretical and numerical results giamarchiDyn ; olson ; fangohr describing the transition from a to a smectic or plastic flow of vortices. Moreover, the depinning 2 region is increasingly geometry dependent at large currents above 2mA as observed from tilted field measurements, which suggests that the vortex order of the depinning 2 region increases with current as expected from the above-mentioned theoretical results.
However, there is an overall downward bending of the pinning region with current, which implies that for some fields vortices get pinned again before they eventually depin. This is very unusual and has never been observed before in the context of vortices. We analyzed this behavior in more detail with the help of the ’s shown in figure 3. For 4T there is a negative differential resistance as a function of current, which implies a dynamical pinning mechanism at high average vortex velocities. This effect cannot be due to an increase of effective since is almost not affected by currents in this range, but it is hysteretic and might be due to the non-monotonous ordering as a function of driving force, similar to the situation of driven charge-density waves grant .
Summarizing, we have studied a new class of superconductors in relation to the peak effect, in which the depinning threshold is extremely weak and where there is no underlying crystalline order. In our system the is huge, with an increase by more than an order of magnitude of the critical current in the region, indicating that very low pinning tends to enhance the peak effect. In addition, after mapping out the entire phase diagram of our system, while many similarities with previous studies on the have been found, we also observed two striking differences. Indeed, we observed an additional transition between the and the normal state as well as a dynamical pinning transition at constant vortex density. These results have important implications on our understanding of the dynamics of vortices in very weakly pinned systems.
References
- (1)
- (2) Higgins, M.J. & Bhattacharya, S., Varieties of dynamics in a disordered flux-line lattice, Physica C 257, 232-254 (1996).
- (3) Berlincourt, T.G., Hake, R.R. & Leslie, D.H., Superconductivity at high magnetic fields and current densities in some Nb-Zr alloys, Phys. Rev. Lett. 6, 671-674 (1961).
- (4) Rosenblum, E.S., Autler, S.H. & Gooen, K.H., The Dependence of the Upper Critical Field of Niobium on Temperature and Resistivity, Rev. Mod. Phys. 36, 77 80 (1964).
- (5) Pippard, A.B., A possible mechanism for the peak effect in type II superconductors, Phil. Mag. 19, 217-220 (1969).
- (6) Kes, P.H. & Tsuei, C.C., Two-dimensional collective flux pinning, defects, and structural relaxation in amorphous superconducting films, Phys. Rev. B 28, 5126-5139 (1983).
- (7) Kwok, W.K. , Fendrich, J.A., van der Beek, C.J., & Crabtree, G.W., Peak Effect as a Precursor to Vortex Lattice Melting in Single Crystal , Phys. Rev. Lett. 73, 2614-2617 (1994).
- (8) Troyanovski, A.M., van Hecke, M., Saha, N., Aarts, J. and Kes, P.H., STM Imaging of Flus Line Arrangements in the Peak Effect Regime, Phys. Rev. Lett. 89, 1470061-(1-4) (2002).
- (9) Gammel, P.L. et al., Structure and Correlations of the Flux Line Lattice in Crystalline Nb through the Peak Effect, Phys. Rev. Lett. 80 833 836 (1998).
- (10) Fasano, Y. et al., Order-disorder phase transition in : Absence of amorphous vortex matter, Phys. Rev. B 66 020512(R)-(1-4) (2002).
- (11) Geers, J.M.E., Attanasio, C., Hesselberth, M.B.S., Aarts, J. & Kes, P.H., Dynamic vortex ordering in thin films, Phys. Rev. B 63, 094511-(1-9) (2001).
- (12) Wördenweber, R., Kes, P.H., & C.C. Tsuei, Peak and history effects in two-dimensional collective flux pinning, Phys. Rev. B 33 3172-3180 (1986).
- (13) Altounian, Z., Guo-hua, Tu, & Strom-Olsen, J.O., Crystallization characteristics of Cu-Zr metallic glasses from to , J. Appl. Phys. 53, 4755-4760 (1982).
- (14) Giamarchi, T. & Le Doussal, P., Elastic theory of flux lattices in the presence of weak disorder, Phys. Rev. B 52, 1242-1270 (1995).
- (15) Klein, T., Joumard, I., Blanchard, S., Marcus, J., Cubitt, R., Giamarchi, T., & Le Doussal, P., A Bragg glass phase in the vortex lattice of a type II superconductor, Nature 413, 404-406 (2001).
- (16) Chauve, P., Giamarchi, T. & Le Doussal, P., Creep and depinning in disordered media, Phys. Rev. B 62 6241-6267 (2000).
- (17) For recent reviews on vortex phases Giamarchi, T. & Bhattacharya, S., in High Magnetic fields. Applications in condensed matter physics and spectroscopy (eds. Berthier, C., Levy, L.P. & Martinez, G.) 314-360 (Springer-Verlag, 2001) (cond-mat/0111052).
- (18) Larkin, A.I., Marchchetti, M.C., & Vinokur, V.M., Peak effect in twinned superconductors, Phys. Rev. Lett. 75, 2995-2998 (1995).
- (19) Granato, E., Ala-Nissila, T. & Ying, S.C., Anomalous sliding friction and peak effect near the flux lattice melting tranistion Phys. Rev. B 62 11834-11837 (2000).
- (20) Zeldov, E. et al., Thermodynamic observation of first-order vortex-lattice melting transition, Nature 375, 373-376 (1995).
- (21) Marchesky, M., Higgins, M.J. & Bhattacharya, S., Two coexisting vortex phases in the peak effect regime in a superconductor, Nature 409, 591-594 (2001).
- (22) Giamarchi, T. & Le Doussal, P., Moving glass theory of driven lattices with disorder, Phys. Rev. B 57, 11356 11403 (1998).
- (23) Olson, C.J., Reichhardt, C. and Nori, Franco, Nonequilibrium Dynamic Phase Diagram for Vortex Lattices, Phys. Rev. Lett. 81, 3757 3760 (1998).
- (24) Fangohr, H., Cox, S.J. & de Groot, P.A.J., Vortex dynamics in two-dimensional systems at high driving forces, Phys. Rev. B, 64 064505-(1-10) (2001).
- (25) Karttunen, M., Haataja, M., Elder, K.R. & Grant, M., Defects, Order and Hysterisis in Driven Charge-Density Waves, Phys. Rev. Lett. 83 3518-3521 (1999).
Acknowledgements
The authors would like to acknowledge helpful discussions with T. Ala-Nissila, M. Grant, H. Guo and J.O. Strom-Olsen and support from NSERC and FCAR.
(hilke@physics.mcgill.ca)