Self-Diffusion of a Polymer Chain in a Melt
Abstract
Self-diffusion of a polymer chain in a melt is studied by Monte Carlo simulations of the bond fluctuation model, where only the excluded volume interaction is taken into account. Polymer chains, each of which consists of segments, are located on an simple cubic lattice under periodic boundary conditions, where each segment occupies unit cells. The results for and at the volume fraction are reported, where for and for . The -dependence of the self-diffusion constant is examined. Here, is estimated from the mean square displacements of the center of mass of a single polymer chain at the times larger than the longest relaxation time. From the data for , and , the apparent exponent , which describes the apparent power law dependence of on as , is estimated as . The ratio seems to be a constant for and , where and denote the longest relaxation time and the mean square end-to-end distance, respectively.
Recently, many works have been done in order to study the slow dynamics of a single polymer chain in a melt through simulations.[1, 2, 3, 4, 5, 6, 8, 7, 9] These studies are motivated by the reptation theory of the dynamics of concentrated polymer systems.[10, 11] In the reptation theory, the dynamics of concentrated polymer systems is described in terms of the motion of a polymer chain trapped in a tube, which represents the entanglement effects of the surrounding polymers. The self-diffusion constant of the center of mass and the longest relaxation time of a polymer chain of segments are predicted to behave as and , respectively. On the other hand, the experimental results on the behaviors of and have been summarized as and .[10, 11] Thus, the exponent for observed in the experiments is different from that predicted by the reptation theory. This discrepancy between the experiments and the reptation theory is considered to be attributed to the contour length fluctuation.[10, 12, 13, 14] The contour length fluctuation makes the relaxation time shorter than that predicted by the original reptation theory. As becomes very large, the effect of the contour length fluctuation becomes negligible and approaches the predicted power law behavior from below, where denotes the number of segments between entanglement points. Because of this crossover behavior, the apparent exponent for increases beyond three and reaches for intermediately large values of . This behavior of the apparent exponent for has been confirmed by the present authors through Monte Carlo simulations.[1]
In contrast to the relaxation time , the exponent for the self-diffusion constant observed in the experiments has been believed to agree with that predicted by the reptation theory. Therefore, the contour length fluctuation has been considered to have little effect on the -dependence of the self-diffusion constant . In the recent experiments by Tao, Lodge and Meerwall,[15, 16] however, it is reported that the self-diffusion constant in hydrogenated polybutadiene (hPB) alkane solutions and hPB melt behaves as . Theoretically, Frischknecht and Milner[17] reported that the apparent power law dependence of on is modified by the contour length fluctuation as at , while it approaches the behavior predicted by the reptation theory as becomes larger. Thus, the behavior of the self-diffusion constant is still in dispute. Therefore, it is desirable to elucidate the -dependence of through simulations. Even in the recent simulations of a polymer melt,[8, 7] however, the -dependence of has not been clarified. Dünweg, Grest and Kremer[7] performed molecular dynamics simulations for and at the reduced density and the reduced temperature .[5, 6] They estimated only for . From their values of for and , the apparent exponent in the apparent power law can be estimated as . However, the values and are not in the range where the apparent exponent for the relaxation time exceeds three.[7] Therefore, their results cannot resolve the dispute as to the apparent power law dependence of on . Moreover, the sizes of the systems used in their simulations do not seem to be sufficiently large. The ratio of the linear dimension of the simulation box to the root mean square end-to-end distance of a polymer chain is and for and , respectively. Kreer, Bashnagel, Müller and Binder[8] performed Monte Carlo simulations of the bond fluctuation model[18] for and at the volume fraction .[3] From their values of for and , the apparent exponent is estimated to be a little smaller than two. Although the values and are in the range where the apparent exponent for the relaxation time exceeds three,[1, 8] they are only two values of and it is not clear how the apparent exponent changes as becomes large. Furthermore, the problem of the system size also exists in their simulations. The ratio of the linear dimension of the system to the root mean square end-to-end distance is for .
The purpose of the present letter is to clarify the -dependence of in the range of values of where the apparent exponent for the relaxation time exceeds three. As in our previous letter,[1] we perform Monte Carlo simulations of the same model as used in Ref. \citenKreerBaschnagelMullerBinder. More values of than in Ref. \citenKreerBaschnagelMullerBinder are studied. For each value of , the linear dimension of the simulation box is at least times larger than the root mean square end-to-end distance. The self-diffusion constant is estimated from the mean square displacements of the center of mass of a polymer chain at the times larger than the longest relaxation time.[1]
In the present study, the bond fluctuation model[18] is used for Monte Carlo simulations of a polymer melt. A system of polymer chains, each of which consists of segments, is considered on a simple cubic lattice of which the lattice constant is . Each side of the lattice has lattice points and the periodic boundary conditions are applied. The polymer chains are represented by series of lattice points , where denotes the center of the th segment of the th polymer chain. Each segment occupies a cube of unit cells and no overlap of segments is allowed. The volume fraction is given by . The lengths of the bond vectors are restricted to the five prescribed lengths . The center of each segment stochastically moves to one of its nearest neighbor lattice points with the transition probability per unit time if the new position is allowed by the conditions for the excluded volume and the bond vectors. The dynamics is simulated by a standard Monte Carlo method, which uses discrete time steps and updates segments in random sequence. The time scale corresponds to one update per segment. [19] We choose and .
In the present study, the cases of the volume fraction are examined for and . We choose for and for . For these values of , it is confirmed that no polymer chain interacts with its images generated by the periodic boundary conditions in the present simulations. The vectorized code for the bond fluctuation model[20] is used on vector processors for . The equilibrium average is calculated as the average of the time averages obtained from Monte Carlo simulations of four statistically independent systems. In each Monte Carlo simulation, the time average is calculated from the sequence of states taken at intervals of after the initial period of , which is discarded for the equilibration. The values of the parameters used in the present simulations are shown in Table 1.
| M | k | k | |||||||
| M | k | k | |||||||
| M | k | k | |||||||
| M | k | k | |||||||
| M | k | k | |||||||
| M | k | k | |||||||
| M | k | k | |||||||
| M | M | k | |||||||
| M | M | k |
Figure 1 shows the elapsed time dependence of the mean square displacement of the center of mass of a polymer chain, where denotes the elapsed time.
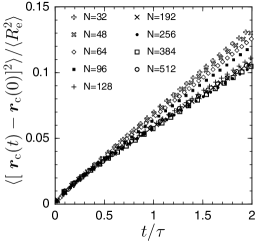
In Fig. 1, the mean square displacement and the elapsed time are scaled by the mean square end-to-end distance and the longest relaxation time , respectively. The values of and are shown in Table 1. For , the values estimated in Ref. \citenHagitaTakano:melt are used, while those estimated from longer simulations than in Ref. \citenHagitaTakano:melt are used for . Here, the longest relaxation time is estimated by the same method as in Ref. \citenHagitaTakano:melt, which is based on the variational estimation of the relaxation modes and rates[21] and has been applied to various polymer systems.[1, 19, 22, 23, 24, 25] The self-diffusion constant is estimated by fitting the data points at times longer than the longest relaxation time to a straight line . The estimated values of are shown in Table 1.
Figure 2 shows a log-log plot of versus .
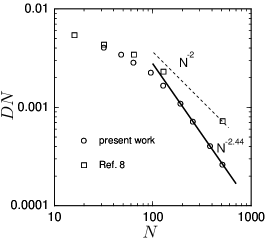
The apparent exponent of the power law dependence of the self-diffusion constant , which appears as the slope in the log-log plot, increases as increases. It is smaller than two for and larger than two for . The least squares fit of the data points for and to a straight line in a log-log plot of versus gives , while that for and gives . The latter result is shown in Fig. 2 as a solid line.
The reptation theory predicts that and in the large limit, while is expected to hold in a melt. Thus, the ratio is predicted to be independent of for sufficiently large . From the values in Table 1, the apparent exponents of the power law dependences and are estimated as and for , and . As mentioned before, the apparent exponent in is estimated as for , and . Thus, the relation seems to hold. This means that is independent of even in the range of where the true asymptotic behaviors of and are not expected to be seen. This behavior can be seen from the fact that the slopes in Fig. 1, which correspond to , are almost the same for .
According to the reptation theory, the ratio is not only independent of but also a constant which contains no adjustable parameter. Its value is given by .[10] Figure 3 shows a semi-log plot of versus .
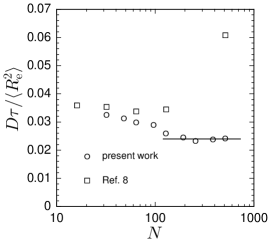
For , the values of seem to converge to a constant value around . If this value can be regarded as the large limit of , the value is about thirty percent smaller than the value predicted by the reptation theory. The agreement between the two values is considered to be reasonable if we take into account the following facts. Firstly, the estimated value of is considered to have a tendency to be smaller than the exact value, because the relaxation time is estimated by the variational method.[1, 21] Secondly, the accuracy of the predicted value of itself is unknown, since the reptation theory is based on a simple model of polymer melts.
In summary, we have examined the -dependence of the self-diffusion constant of a polymer chain of segments in a melt through Monte Carlo simulations of the bond fluctuation model. The apparent exponent in the power law dependence is found to increase beyond two as increases. From the data for , and , is estimated as . For large values of , the ratio seems to be a constant value around 0.024, which reasonably agrees with the theoretical prediction. The reptation theory predicts that is independent of the monomer concentration of a melt.[10] Therefore, it is interesting to investigate the volume fraction dependences of , and in addition to their -dependences. A study in this direction is in progress
The authors are grateful to Professor S. F. Edwards, Professor E. M. Terentjev, Professor M. Doi and Professor P. G. de Gennes for their comments. The present work was partially supported by a Grant-in-Aid for Scientific Research (C) and a Grant-in-Aid for Scientific Research on Priority Areas from the Ministry of Education, Culture, Sports, Science and Technology. The authors thank Research Center for Computational Science of Okazaki National Research Institutes for the use of the Fujitsu VPP 5000 and Hokkaido University Computing Center for the use of the Hewlett-Packard V2500. One of the authors (K.H.) thanks Professor E. Hanamura at Hanamura Team, CREST, Japan Science and Technology Corporation and Chitose Institute of Science and Technology, where a part of the present work was carried out.
References
- [1] K. Hagita and H. Takano: J. Phys. Soc. Jpn. 71 (2002) 673.
- [2] K. Binder: Monte Carlo and Molecular Dynamics Simulations in Polymer Science (Oxford University Press, Oxford, 1995).
- [3] W. Paul, K. Binder, D. W. Heermann and K. Kremer: J. Chem. Phys. 95 (1991) 7726.
- [4] W. Paul, K. Binder, D. W. Heermann and K. Kremer: J. Phys. (Paris) II 1 (1991) 37.
- [5] K. Kremer and G. S. Grest: J. Chem. Phys. 92 (1990) 5057.
- [6] K. Kremer and G. S. Grest: J. Chem. Soc., Faraday Trans. 88 (1992) 1707.
- [7] B. Dünweg, G. S. Grest and K. Kremer: Numerical Methods for Polymeric Systems, ed. S. Whittington, IMA Volumes in Mathematics and its Applications 102 (Springer-Verlag, New York, 1998) 159.
- [8] T. Kreer, J. Baschnagel, M. Müller and K. Binder: Macromolecules 34 (2001) 1105.
- [9] Y. N. Kaznessis, D. A. Hill and E. J. Maginn: J. Chem. Phys. 111 (1999) 1325.
- [10] M. Doi and S. F. Edwards: The Theory of Polymer Dynamics (Oxford University Press, Oxford, 1986).
- [11] P. G. de Gennes: Scaling Concepts in Polymer Physics (Cornell University Press, Ithaca, 1984).
- [12] M. Doi: J. Polym. Sci. Polym. Lett. Ed. 19 (1981) 265.
- [13] N. P. T. O’Connor and R. C. Ball: Macromolecules 25 (1992) 5677.
- [14] S. T. Milner and T. C. B. McLeish: Phys. Rev. Lett. 81 (1998) 725.
- [15] T. P. Lodge: Phys. Rev. Lett. 83 (1999) 3218.
- [16] H. Tao, T. P. Lodge, E. D. Meerwall: Macromolecules 33 (2000) 1747.
- [17] A. L. Frischknecht and S. T. Milner: Macromolecules 33 (2000) 5273.
- [18] I. Carmesin and K. Kremer: Macromolecules 21 (1988) 2819.
- [19] S. Koseki, H. Hirao and H. Takano: J. Phys. Soc. Jpn. 66 (1997) 1631.
- [20] H. -P. Wittmann and K. Kremer: Comput. Phys. Commun. 61 (1990) 309, ibid 71 (1992) 343.
- [21] H. Takano and S. Miyashita: J. Phys. Soc. Jpn. 64 (1995) 3688.
- [22] H. Hirao, S. Koseki and H. Takano: J. Phys. Soc. Jpn. 66 (1997) 3399.
- [23] K. Hagita and H. Takano: J. Phys. Soc. Jpn. 68 (1999) 401.
- [24] K. Hagita, S. Koseki and H. Takano: J. Phys. Soc. Jpn. 68 (1999) 2144.
- [25] K. Hagita, D. Ishizuka and H. Takano: J. Phys. Soc. Jpn. 70 (2001) 2897.