EXAFS, XRD and RMC studies of an Amorphous Ga50Se50 Alloy Produced by Mechanical Alloying
Abstract
The local atomic order of an amorphous Ga50Se50 alloy produced by Mechanical Alloying (MA) was studied by the Extended X-ray Absorption Fine Structure (EXAFS) and X-ray Diffraction (XRD) techniques and by Reverse Monte Carlo (RMC) simulations of its total x-ray structure factor. The coordination numbers and interatomic distances for the first neighbors were determined by means of EXAFS analysis and RMC simulations. The RMC simulations also furnished the partial pair distribution functions , and . The results obtained indicated that there are important differences among the local structure of the amorphous Ga50Se50 alloy produced by MA and those of the corresponding crystals, since there are Se-Se pairs in the first coordination shell of the amorphous alloy that are forbidden in the Ga50Se50 crystals.
pacs:
61.10.Ht, 61.10.Eq, 61.43.Bn, 61.43.Dq, 05.10.Ln, 81.05.GcIn the recent years there has been an increase in the number of applications related to nonlinear optical materials. However, the desired properties concerning this kind of applications, such as optical homogeneity, laser damage threshold, stability of the compound upon exposure to laser beam, ease of fabrication, improved mechanical strength and the possibility of making large crystals are difficult to find in a single material. Some of the materials that can be used for nonlinear applications, like silver gallium selenides, zinc germanium phosphides and thallium arsenic selenides, do not fulfill all of these requirements, limiting severely their efficiency and applicability. Thus, there is a high necessity of developing new materials with a higher level of performance and more cost effective characteristics. Gallium selenide (GaSe) has a number of interesting properties for electrical and nonlinear optics applications. It transmits in the wavelength range varying from 0.65 to 18 m and its optical absorption coefficient remains below 1 cm-1 throughout the transparency range. It has the possibility of converting sum and difference frequencies Fernelius (1994); Singh et al. (1998). It has also been reported to be used in making a number of devices like MOSFET, IR detector, Solar Cell, compound semiconductor, etc. in crystalline form while in amorphous form, it is a potential candidate for optical memory type applications Singh et al. (1999, 1998). Crystalline GaSe is a semiconductor of the III-VI family like GaS and InSe and it has a layered graphite type structure with a fourfold layer in the sequence Se-Ga-Ga-Se. The crystal cleaves very easily along the layers Fernelius (1994). At room temperature, the layers are bound by weak van der Waals-type interactions. The weakness of this interaction explains the existence of a number of polytypes Jandl et al. (1976). Ga50Se50 alloys can be prepared by the melting, vapor deposition and molecular beam epitaxy techniques Ludviksson et al. (1995); Fujita et al. (1994); Stoll et al. (1996); Ng et al. (1996). These techniques have had very limited success because they do not have control over the kinetics and morphology. In addition, due to the low melting points of the elemental Ga (30∘C) and Se (217∘C) and the high vapor pressure of Se above 600∘C it is difficult to obtain Ga-Se alloys at specific compositions. On the other hand, the mechanical alloying (MA) technique Suryanarayana (2001) can be used to overcome these difficulties since the temperatures reached in MA are very low, what reduces reaction kinetics, allowing the production of poorly crystallized or amorphous materials Machado et al. (2002); Campos et al. (2002a, b); de Lima et al. (1999) even if the constituents of the alloy have low melting points, as it is in the case of gallium and selenium.

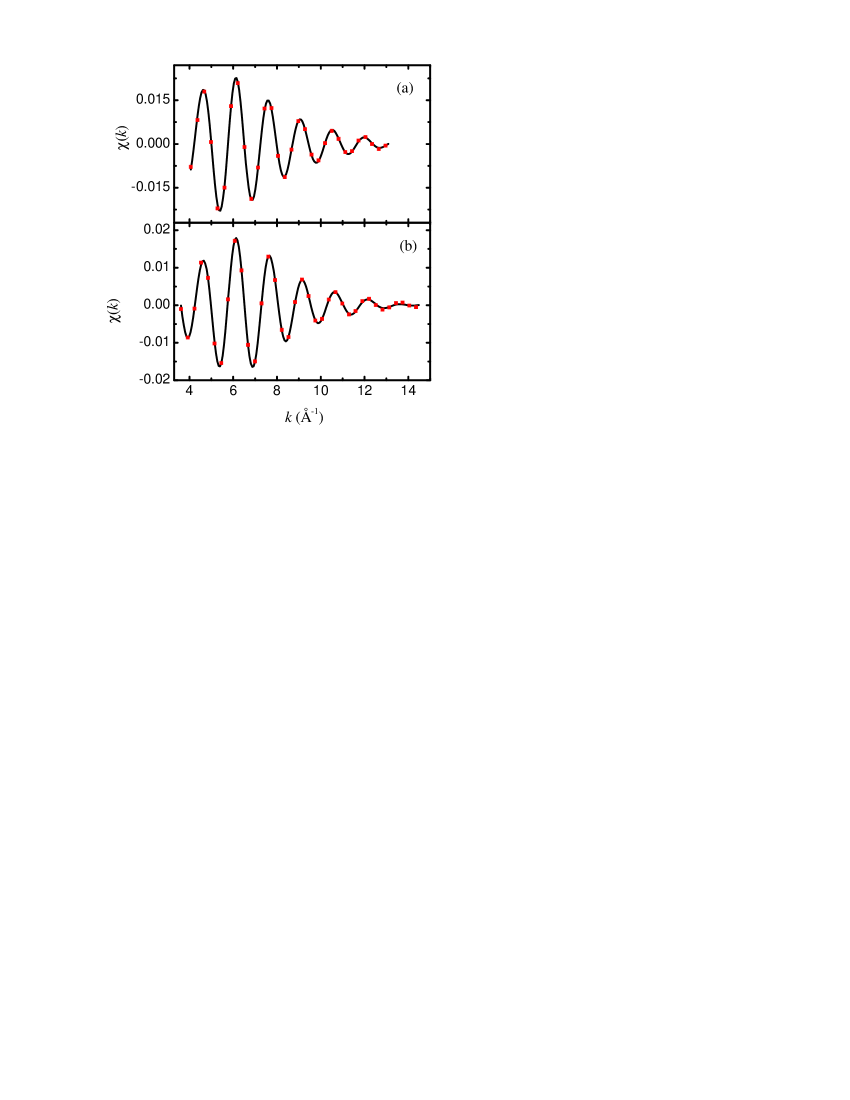
Amorphous Ga50Se50 (a-Ga50Se50) was prepared by MA starting from high purity elemental powder selenium (Alfa Aesar, 99.9999% purity, 150 m) and scraped ingots of gallium (Aldrich, 99.999% purity) with nominal composition Ga50Se50. The mixture was sealed together with several steel balls into a cylindrical steel vial under argon atmosphere. The ball-to-powder weight ratio was 10:1. A Spex Mixer/Mill model 8000 was used to perform MA at room temperature. The mixture was milled for 15 h. A ventilation system was used to keep the vial temperature close to room temperature. The composition of the alloy was confirmed by an energy dispersive spectroscopy (EDS) measurement and impurity traces were not observed. The alloy produced was investigated by extended x-ray absorption fine structure (EXAFS) and x-ray diffraction (XRD) techniques and also by reverse Monte Carlo simulation (RMC). The EXAFS measurements were carried out on the D04B beam line of LNLS (Campinas, Brazil), using a channel cut monochromator (Si 111), two ionization chambers as detectors and a 1 mm entrance slit. All data were taken at room temperature in the transmission mode. The EXAFS oscillations at both K edges, after the standard data reduction procedures using Winxas97 software Ressler (1997), were Fourier transformed (FT) using a Hanning weighting function within the ranges 3.8 – 14.3 Å-1 for the Ga, and 3.4 – 14.3 Å-1 for the Se edge. They can be seen in Fig. 1. Raw spectra were filtered by Fourier transforming (Ga edge) and (Se edge) into -space (Fig. 1) and transforming back the first coordination shells (1.20 – 2.85 Å for the Ga edge and 1.13 – 3.0 Å for the Se edge). Filtered spectra were then fit by using Gaussian distributions to represent the homopolar and heteropolar bonds Stern et al. (1975). The amplitude and phase shifts relative to the homopolar and heteropolar bonds needed to fit them were obtained from ab initio calculations using the spherical waves method Rehr (1991) and by the FEFF software. Figure 2 shows the experimental and the fitting results for the Fourier-filtered first shells on the Ga and Se edges. Structural parameters extracted from the fits are listed in Table 1. It is interesting to note that the very good fits shown in Fig. 2 were achieved only when Se-Se pairs were considered in the first shell. This fact indicates that the local structure of a-Ga50Se50 produced by MA is different from its crystalline counterparts as none of the known stable crystalline Ga50Se50 structures contains Se-Se bonds.
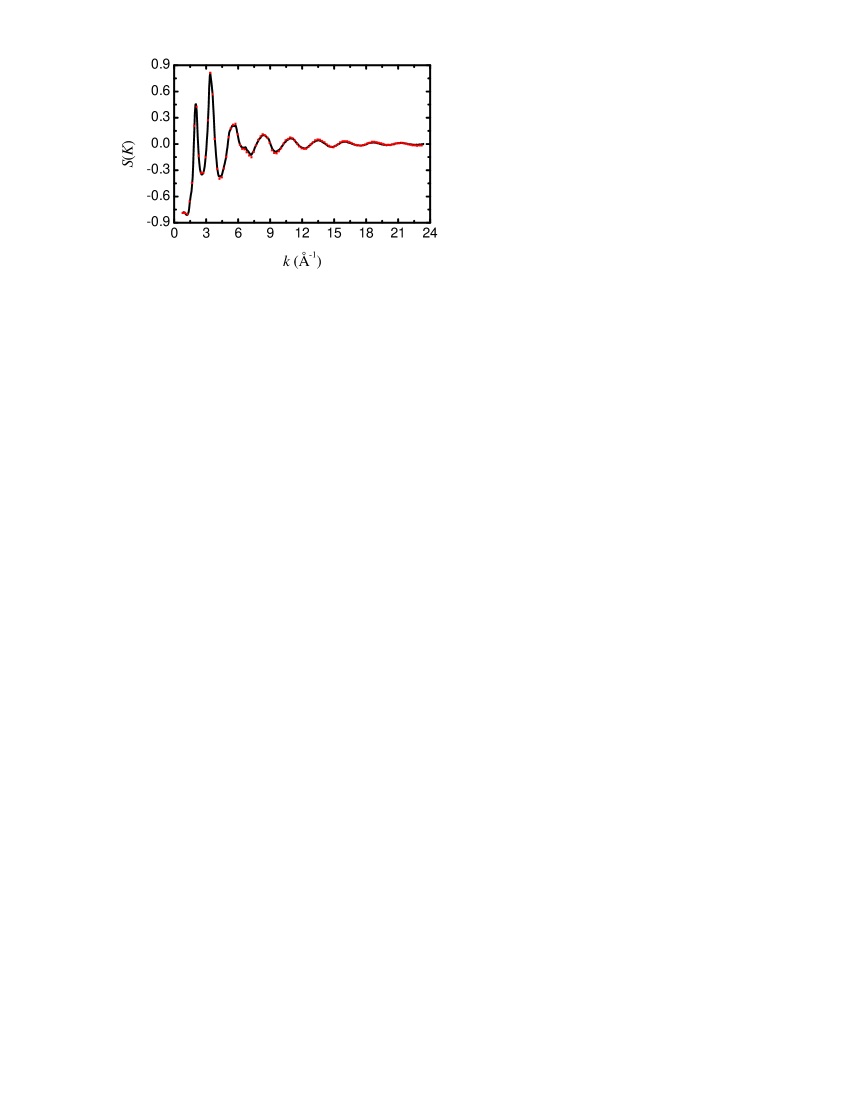
The XRD measurements were carried out at the BW5 beamline Poulsen et al. (1995) at HASYLAB. All data were taken at room temperature. The energy of the incident beam was 121.3 keV ( Å). The structure factor (Fig. 3, full line) was computed from the normalized intensity according to Faber and Ziman Faber and Ziman (1965) and it was modeled by reverse Monte Carlo simulations. This technique is described in details elsewhere McGreevy and Pusztai (1988); RMC ; McGreevy (2001); Machado et al. (2002) and it has been used as a method for structural modeling based directly on experimental data. There are several papers Jóvári and Pusztai (2001); Machado et al. (2002); Keen and McGreevy (1990); Wang et al. (1997); Bionducci et al. (1999); Cicco et al. (2000) reporting structural studies of amorphous alloys by RMC. Simulations were carried out by the RMC program available on the Internet RMC . Cubic cells contained 1600 and 12800 atoms, and the average density was atoms/Å3. This value was found from the slope of the straight line () fitting the initial part (until the first minimum) of the total function Waseda (1980). The minimum distance of atoms was also extracted from and fixed at 2.18 Å. All the simulations were performed considering atoms randomly placed in the cubic cells as starting configurations. Then the following series of simulations were carried out:

-
1.
Hard sphere simulation without experimental data to avoid possible memory effects of the initial configurations in the results.
-
2.
‘Unconstrained’ runs (i.e. when experimental data were ‘switched on’). These runs led to three essentially identical partial pair correlation functions and partial structure factors which can be considered as linear combinations of the ‘true’ partial quantities. It is to be mentioned that as neither the size nor other a priori information can distinguish between Ga and Se atoms at this step no adequate coordination numbers can be obtained.
- 3.
| EXAFS | ||||
| Ga K-edge | Se K-edge | |||
| Bond Type | Ga-Ga | Ga-Se | Se-Ga | Se-Se |
| 1.3 | 2.4 | 2.4 | 1.3 | |
| (Å) | 2.38 | 2.45 | 2.45 | 2.37 |
| (Å) | 1.58 | 0.545 | 0.545 | 1.77 |
| RMC | ||||
| Bond Type | Ga-Ga | Ga-Se | Se-Ga | Se-Se |
| 1.2 | 2.5 | 2.5 | 1.3 | |
| (Å) | 2.42 | 2.42 | 2.42 | 2.42 |
| Ga50Se50 compound 111Space group P63/MMC. | ||||
| Bond Type | Ga-Ga | Ga-Se | Se-Ga | Se-Se |
| 1 | 3 | 3 | 6 | |
| (Å) | 2.44 | 2.45 | 2.45 | 3.75 |
| Ga50Se50 compound 222Space group P-6M2 | ||||
| Bond Type | Ga-Ga | Ga-Se | Se-Ga | Se-Se |
| 1 | 3 | 3 | 6 333The trigonal crystal of space group R3M has 4 Se-Se pairs. | |
| (Å) | 2.39 | 2.47 | 2.47 | 3.74 |
Finally the whole series of calculations was repeated from the very beginning with the difference that during the ‘constrained’ run random steps resulting in non-zero Se-Se first coordination number were rejected. It is important to note that if Se-Se pairs are forbidden as first neighbors simulations did not converge, reinforcing the results obtained by EXAFS analysis. The position of the first and second peak are 2.42 Å and 3.89 Å in all of the pcf’s corresponding to a mean bond angle of 107∘ for the four bond types (Ga-Ga-Ga, Se-Se-Se, Ga-Se-Se, Ga-Ga-Se) that can be directly derived from the pcf peak positions. As this is very close to the value describing perfect tetrahedral coordination (109.5∘) and and are both close to 4 it is evident to assume that ball milled a-Ga50Se50 has a tetrahedral structure with a definite tendency to form homopolar bonds.
The difference of Ga-Ga and Ga-Se bond lengths in the crystalline modifications is not greater than about 0.08 Å (see Table 1) and they are also quite close to the value of 2.35 Å found recently for a-Se Jóvári and Pusztai (2001). As the spatial resolution of diffraction experiments is equal to the factor should be measured at least up to 40 Å-1 or further to get more detailed information on the first coordination shell. It should also be mentioned that due to the value of neutron scattering lenghts ( fm, fm) neutron diffraction data would give essentially the same information. Other techniques used to obtain information at the level of pcf’s are either prohibitively expensive (neutron diffraction with isotopic substitution) or yield limited spatial resolution due to the low value available (anomalous X-ray scattering).
In summary the local structure of ball milled a-Ga50Se50 was investigated experimentally with EXAFS and high energy X-ray diffraction. EXAFS analysis led to the following conclusions: the average first coordination number in a-Ga50Se50 is close to 4, Ga and Se local environments are similar and Se-Se bonding is significant. All of these findings were checked and confirmed by RMC study of diffraction data: it was possible to obtain a good fit with coordination constraints close to the EXAFS values while runs without Se-Se first neighbors led to a bad agreement between model and experiment. Mean bond angle calculated from diffraction data is 107∘ indicating that a-Ga50Se50 has a tetrahedral local structure.
The present study illustrates how complementary information obtained by different experimental techniques can be combined within the frame of reverse Monte Carlo simulation. We believe that this is a useful and efficient way of modelling disordered materials especially in cases when traditional methods (e.g. neutron diffraction with isotopic substitution) are not available.
Acknowledgements.
The Brazilian authors wish to thank the Brazilian agencies CNPq and CAPES for financial support. This study was also partially supported by LNLS (Proposal No. XAS 998/01). P. Jóvári is indebted to Hermann Franz and Martin von Zimmermann (both HASYLAB) for their help during the diffraction measurement.References
- Singh et al. (1998) N. B. Singh, D. R. Suhre, V. Balakrishna, M. Marable, R. Meyer, N. C. Fernelius, F. Hopkins, and D. Zelmon, Progr. Cryst. Growth and Char 37, 47 (1998).
- Fernelius (1994) N. C. Fernelius, Prog. Cryst. Growth and Char. 28, 275 (1994).
- Singh et al. (1999) N. B. Singh, D. R. Suhre, W. Rosch, R. Meyer, M. Marable, N. C. Fernelius, F. K. Hopkins, D. E. Zelmon, and R. Narayanan, J. Crystal Growth 198/199, 588 (1999).
- Jandl et al. (1976) S. Jandl, J. L. Brebner, and B. M. Powell, Phys. Rev. B 13, 686 (1976).
- Ludviksson et al. (1995) A. Ludviksson, L. E. Rumaner, J. W. J. Rogers, and F. S. Ohuchi, J. Cryst. Growth 151, 114 (1995).
- Fujita et al. (1994) K. Fujita, T. Izumi, K. Ohsaki, T. Tambo, H. Ueba, and C. Tatsuyama, Thin Solid Films 247, 134 (1994).
- Stoll et al. (1996) S. L. Stoll, E. G. Gillan, and A. R. Barron, Adv. Materials 8, 182 (1996).
- Ng et al. (1996) T. L. Ng, N. Maung, G. Fan, I. B. Poole, J. O. Williams, A. C. Wright, D. F. Foster, and D. J. Cole-Hamilton, Chem. Vapor Deposition 2, 185 (1996).
- Suryanarayana (2001) C. Suryanarayana, Prog. Mater. Sci. 46, 1 (2001).
- Machado et al. (2002) K. D. Machado, J. C. de Lima, C. E. M. de Campos, T. A. Grandi, and D. M. Trichês, Phys. Rev. B 66, 094205 (2002).
- Campos et al. (2002a) C. E. M. Campos, J. C. de Lima, T. A. Grandi, K. D. Machado, and P. S. Pizani, Sol. State. Commun. 123, 179 (2002a).
- Campos et al. (2002b) C. E. M. Campos, J. C. de Lima, T. A. Grandi, K. D. Machado, and P. S. Pizani, Physica B 324, 409 (2002b).
- de Lima et al. (1999) J. C. de Lima, V. H. F. dos Santos, and T. A. Grandi, Nanostruct. Matter. 11, 51 (1999).
- Ressler (1997) T. Ressler, J. Phys. 7, C2 (1997), licensed to LNLS.
- Stern et al. (1975) E. A. Stern, D. E. Sayers, and F. W. Lytle, Phys. Rev. B 11, 4836 (1975).
- Rehr (1991) J. J. Rehr, J. Am. Chem. Soc. 113, 5135 (1991).
- Poulsen et al. (1995) H. F. Poulsen, J. Neuefeind, H.-B. Neumann, J. R. Schneider, and M. D. Zeidler, J. Non-Cryst. Solids 188, 63 (1995).
- Faber and Ziman (1965) T. E. Faber and J. M. Ziman, Philos. Mag. 11 (1965).
- McGreevy and Pusztai (1988) R. L. McGreevy and L. Pusztai, Mol. Simulations 1, 359 (1988).
- (20) RMCA version 3, R. L. McGreevy, M. A. Howe and J. D. Wicks, 1993. available at http://www.studsvik.uu.se.
- McGreevy (2001) R. L. McGreevy, J. Phys.: Condens. Matter 13, 877 (2001).
- Jóvári and Pusztai (2001) P. Jóvári and L. Pusztai, Phys. Rev. B 64, 14205 (2001).
- Keen and McGreevy (1990) D. A. Keen and R. L. McGreevy, Nature 344, 423 (1990).
- Wang et al. (1997) Y. Wang, K. Lu, and C. Li, Phys. Rev. Lett. 79 (1997).
- Bionducci et al. (1999) M. Bionducci, G. Navarra, R. Bellissent, G. Concas, and F. Congiu, J. Non-Cryst. Solids 250, 605 (1999).
- Cicco et al. (2000) A. D. Cicco, M. Taglienti, M. Minicucci, and A. Filipponi, Phys. Rev. B 62, 12001 (2000).
- Waseda (1980) Y. Waseda, The Structure of Non-Crystalline Materials (Liquid and Amorphous Solids) (McGraw-Hill, New York, 1980).