Study of the formation and decay of electron-hole plasma clusters in a direct-gap semiconductor CuCl
Abstract
The master equation for the cluster-size distribution function is solved numerically to investigate the electron-hole droplet formation claimed to be discovered in the direct-gap CuCl excited by picosecond laser pulses [Nagai et al., Phys. Rev. Lett. 86, 5795 (2001); J. Lumin. 100, 233 (2002)]. Our result shows that for the excitation in the experiment, the average number of pairs per cluster (ANPC) is only around 5.2, much smaller than that (106 typically for Ge) of the well studied electron-hole droplet in indirect-gap semiconductors such as Ge and Si.
pacs:
71.35.Ee, 71.35.LkIn photoexcited semiconductors, electrons and holes are generated by the photon absorption and interact with each other via the Coulomb interaction. When the exchange- and correlation-induced attractions among the high density photogenerated carriers are strong enough to overcome the fermionic repulsive pressure and to reduce the chemical potential below the exciton energy, electron-hole droplets (EHDs) appear as first order transition.lvk Investigation of the formation kinetics of EHD provides an opportunity to understand the quantum many-body effects. In semiconductor with an indirect gap and correspondingly long optical lifetimes, such as Ge and Si, EHDs have been investigated both theoretically and experimentally in great detail.sige Within the coexistence regime, relatively large EHD clusters are formed and the kinetics of the EHD formation is well understood in terms of the master equationsil ; haug where the ANPC is very large (for Ge is about 106).
Unlike indirect gap semiconductors, in direct gap semiconductors the situation is very complicated because the system cannot reach quasiequilibrium during the carrier lifetime (typically in the order of 1 ns). Despite extensive experimental efforts, no decisive evidence of the EHD formation has yet been reported for a very long time.haug2 EHD formation has been predicted theoretically in polar CdS and CdSe.rice1 Also, EHD-like behavior has been observed in them experimentally in which time-resolved emission measurements are performed.vbtim1 ; ssion1 This method has also been applied to GaAs. It reveals that electron-hole plasma created by band-to-band excitation has extremely high temperature due to the overheating caused by the reduction of band gap. Very recently, Nagai et al. used CuCl which has large binding energy and band gap (binding energy of 1s-Z3 exciton Eex=213 meV and band-gap energy Eg=3.396 eV) to overcome the problem. They therefore are able to study the formation of EHD in CuCl via time-resolved emission and pump-probe reflection measurements by femtosecond excitation in the mid-infrared region under resonant exciton excitation. They reported that clear EHD-like behavior in CuCl has been found.ku1 ; ku2
However, due to the fact of the short lifetime of the carrier, one expects only small clusters can be formed and sustained. Two decades ago, Haug and Abraham performed a theoretical investigation of the EHD formation in GaAs.haug1 They reported for the typical picosecond excitation the ANPC is at most around 2 where there should be no EHD formation can be found. In this paper we use the master equation theory developed by Haug and Abrahamhaug1 to investigate the femtosecond excitation in CuCl in the experiments of Nagai et al..ku1 ; ku2 This theory has been proven to be very sucessful in dealing with the EHD formation in indirect gap semiconductors.sil ; haug In this study, we focus on how big the ANPC can be in this material and how this number is affected by different parameters.

The concentration to find at a given time t a cluster with e-h pairs per unit volume is given by the following master equation equations:haug1 For ,
| (1) | |||
| (2) |
where is the net probability current between the clusters with n and n+1 e-h pairs, is the gain rate of a cluster with n e-h pairs and is approximated by
| (3) | |||||
| (4) | |||||
| (5) |
is the radius of the cluster, is the thermal exciton velocity, is the liquid density. The loss rate is the sum of the evaporation rate and the recombination rate :
| (6) |
is given by the Richardson-Dushman currentsil
| (7) |
is the degeneracy of the exciton level, is the binding energy of the liquid with respect to the exciton. is the correction of the binding energy with denoting the surface energy of the liquid. Typically we select =1. with , standing for the condensate energy per electron-hole pair and .lvk The change of exciton (corresponding to ) is treated separately:
| (8) |
where G(t) is the generation rate of excitons.

We solve above equations numerically for the example of CuCl. The parameters for CuCl at 4.2 K are =2.0 and erg.d1 The value of the binding energy is taken to be the biexciton binding energy which is the lower limit of the binding energy. Our computation indicates that the result is almost unchanged if one increases by one order of magnitude. We obtain from =, where is the Bohr radius and =1.8. ku1 ergcm-2. In our calculation we assume . According to the experiment, we choose a Gaussian pulse:
| (9) |
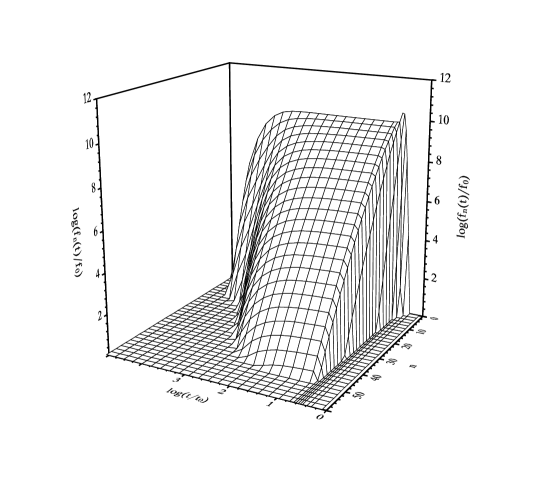
where the pulse width ps, and the peak generation rate is cm-3s-1, corresponding to a excitation density of 4.3 mJcm-2. The main results of our calculation are plotted in Figs. 1-3.
Figure 1 shows the development of the distribution of cluster distribution. For the short pulse, the exciton concentration rapidly reaches its maximum near the pulse center, ps. Then it decreases quickly due to the formation of the clusters. It is also noted from the figure that within 1 ps after the center of the pulse, clusters of all sizes reaches to their maximum values. As any cluster with size comes from the exciton, sharply drops 5 orders of magnitude from its peak within that period of time. After that, because of the recombination and the evaporation, almost all clusters start to decay, except for some small clusters (say and 2) which increase a little bit due to the evaporation from bigger clusters. The lifetime of large cluster (say ) is much shorter than that of the small one as the later gets compensation from the decay of the larger clusters and also the recombination rate is propotional to . After 10 ns almost all cluster concentrations are below cm-3. This can be seen more quantitatively in Fig. 2 where the concentration of some selected clusters are plotted as functions of time.
In order to see in average how large the cluster can be under the experiments by Nagai et al., we plot in Fig. 3 the ANPC as function of time for three different lifetimes . can be calculated from
| (10) |
One notices from the figure that for the excitation in the experiment, ANPC is only 5.2, orders of magnitude smaller than the number in the EHD of indirect semiconductor such as Ge and Si. This result is consistent with the regular expectation of the excitation in the direct gap semiconductors. Moreover, if one assumes that the larger clusters are stable and therefore () is larger than . We demonstrate in the same figure the result when ns but ns when . One finds that this does not affect the ANPC, although the metastable time is much longer. We further find that if we increase the excitation by one order of magnitude, we can only double the ANPC. These results indicate that the feature of low ANPC is very robust. These results indicate that what measured in CuCl by Nagai et al.ku1 ; ku2 may not come from the EHD formed from exciton gas, but instead possibly come from some bubbles of excitons in metallic liquid.ku2
MWW is supported by the “100 Person Project” of Chinese Academy of Sciences and Natural Science Foundation of China under Grant No. 10247002. He would also like to thank S. T. Chui at Bartol Research Institute, University of Delaware for hospitality. LJ would like to thank M. Q. Weng for his help during this work. MWW, MN and MK is supported in part by the Solution Oriented Research for Science and Technology (SORST) of the Japan Science and Technology Corporation (JST).
References
- (1) Eletron-hole Droplets in Semiconductors edited by C. D. Jefferies and L. V. Keldysh(Northen Holland, Amsterdam,1983).
- (2) Ya. Prokrovskii, Phys. Status Solidi A 11, 385 (1972); C. D. Jeffries, Science 189, 955 (1975); J. C. Hensel, T. G. Phillips, and G. A. Thomas, in Solid State Physics, ed. H. Ehrenreich, F. Seita, and D. Turnbull (Academic, New York, 1977), Vol. 32, p. 1.
- (3) R. N. Silver, Phys. Rev. B 11, 1569 (1975); 12, 5689 (1975); 16, 797 (1976).
- (4) S. W. Koch and H. Haug, Phys. Stat. Sol. B 95, 155 (1979).
- (5) K. Bohnert, M. Anselment, G. Kobbe, C. Klingshirn, H. Haug, S. W. Koch, S. Schmitt-Rink, and F. F. Abraham, Z. Phys. B 42, 1 (1981).
- (6) G. Beni and T. M. Rice, Phys. Rev. B 18, 768 (1978).
- (7) H. Yoshda, H. Saito, S. Sionoya, and V. B. Timofeev, Solid State Commun. 33, 161 (1980).
- (8) H. Yoshida, H. Saito, and S. Sionoya, Phys. State Sol. B 104, 331 (1981).
- (9) T. C. Damen, L. Vina, J. E. Cunningham, J. Shah, and L. J. Sham, Phys. Rev. Lett. 67, 3432 (1991).
- (10) M. Nagai, R. Shimano, and M. Kuwata-Gonokami, Phys. Rev. Lett. 86, 5795 (2001).
- (11) M. Nagai and M. Kuwata-Gonokami, J. Lumin. 100, 233 (2002).
- (12) H.Haug and Farid F. Abraham, Phys. Rev. B 23, 2960 (1981).
- (13) O. Madelung, M.Schulz, and H. Weiss (eds.), Numerical Data and Functional Relationships in Science and Technology Landolt-Börnstein, New Series, Vol. 17, (Springer-Verlag, Berlin, 1982).