Self-organization in multimode microwave phonon laser (phaser):
experimental observation of spin-phonon cooperative motions
Abstract
An unusual nonlinear resonance was experimentally observed in a ruby phonon laser (phaser) operating at 9 GHz with an electromagnetic pumping at 23 GHz. The resonance is manifested by very slow cooperative self-detunings in the microwave spectra of stimulated phonon emission when pumping is modulated at a superlow frequency (less than 10 Hz). During the self-detuning cycle new and new narrow phonon modes are sequentially “fired” on one side of the spectrum and approximately the same number of modes are “extinguished” on the other side, up to a complete generation breakdown in a certain final portion of the frequency axis. This is usually followed by a short-time refractority, after which the generation is fired again in the opposite (starting) portion of the frequency axis. The entire process of such cooperative spectral motions is repeated with high degree of regularity. The self-detuning period strongly depends on difference between the modulation frequency and the resonance frequency. This period is incommensurable with period of modulation. It increases to very large values (more than 100 s) when pointed difference is less than 0.05 Hz. The revealed phenomenon is a kind of global spin-phonon self-organization. All microwave modes of phonon laser oscillate with the same period, but with different, strongly determined phase shifts — as in optical lasers with antiphase motions.
pacs:
05.65.+b, 42.65.Sf, 43.35.+dPhonon amplification by stimulated emission of radiation was predicted theoretically in TheorEarly and experimentally observed in microwave range by several groups AmplifEarly in 1960–1970-th. This phenomenon is very similar to the usual paramagnetic maser gain of electromagnetic field Siegman-1964 ; TP-1991 . But if the phonon gain is large enough to exceed the phonon losses in the solid-state resonator, the self-excitation of laser-like phonon emission is possible GenerTucker ; SSC-1974 ; JETP-1977 . The wavelength of generated microwave-frequency phonons in such phonon laser lies usually in optical or near-infrared range (due to very small velocity of sound in crystals, which is about 5 orders less than the light velocity). In this sence microwave phonon laser (phaser) is more close relative of the optical laser, than terahertz phonon laser (saser), having much shorter wavelength (see Terahertz and references therein).
Almost all early experiments with microwave phonon lasers GenerTucker ; SSC-1974 ; JETP-1977 were carried out in autonomous regime, when the control parameters of the active system remain unchanged during the whole time of measurement. Various regular and chaotic processes of generation of microwave phonons in a multimode nonautonomous phaser was experimentally observed and studied Chaotic for 20–300 Hz, where is the pumping modulation frequency, is the relaxation frequency of a nonequilibrium autonomous acoustic system ( depends on pumping level). The existence of a single dominating component for the transient processes in the autonomous phonon laser reflects the collective character of a multimode stimulated emission LaminarTheory in the quantum generators of class , an acoustic analog of which is represented by a system studied in Chaotic . As a result, a nonlinear dynamics of the integral intensity of the multimode stimulated phonon emission in a nonautonomous phonon laser operating at Chaotic is satisfactorily described by a single-mode (or even point-like) model.
Outside the region of the nonlinear low-frequency resonance indicated above, the pronounced dependence of the mode variables on the scalar order parameter is violated. Even in a two-mode regime of the class quantum generator, evolution of the partial components qualitatively differs from Georgiou-1994 . In particular, the system may exhibit manifestations of a new nonlinear resonance at a frequency , which is related to the phonon intermode energy exchange through spin-system.
In this study, a nonlinear superlow-frequency resonance in a ruby phaser was experimentally observed for the first time at Hz. This resonance leads to a manifold narrowing of the microwave spectrum of stimulated phonon emission and to the appearance of very slow, highly organized self-detunings of phaser generation at still lower frequencies depending on the parameter . Some preliminary results on superlow-frequency resonance were reported in LaminarEarly , and short version of this study was published in TPL-2001 and repoted in MSMW-2001 .
The main element of the phonon laser studied is a solid-state microwave acoustic Fabry-Pérot resonator (AFPR) made of a pink ruby crystal (with impurities of in , where ). This AFPR was made of ruby single crystal grown by the Verneuil method and cut to form of a round rod of 2.6 mm diameter and 17.6 mm length. Measured acoustic -factor of the AFPR is at 9–10 GHz.
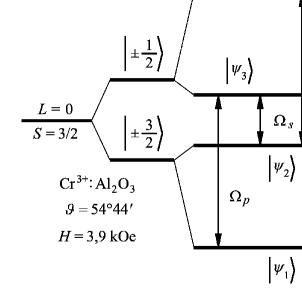
One of the resonator’s acoustic mirrors was coated with a textured piezoelectric thin film capable of detecting longitudinal acoustic () oscillations in AFPR. These oscillations were excited in the ruby crystal lattice due to the stimulated phonon emission at spin transitions of paramagnetic ions. Inversion of populations of spin-levels was provided by simultaneous (push-pull) pumping of the transitions and . Here are the ground spin multiplet levels.
The experiments were performed at 2–20 Hz with the ruby phaser having push-pull electromagnetic pumping at a frequency of Hz (see FIG. 1). The mode frequencies of the generated -phonons occur near a maximum of the inverted acoustic paramagnetic resonance (APR) line Hz. Since the longitudinal sound velocity in the system studied was cm/s, the wavelengths of the generated microwave acoustic modes were close to the optical-wavelength ones: m ( is the trigonal axis of ruby crystal lattice). The intermode spacing was Hz and the total number of modes reached at a nonmodulated pumping power of W and the quality factor of electromagnetic pumping cavity .
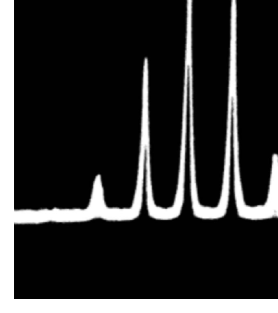
All the experiments were performed by measuring the microwave spectra of the -oscillations at temperatures of K in static magnetic fields within the interval , where , Oe, , Oe. The magnetic field vector was oriented at an angle of with respect to the axis of the ruby crystal, which was necessary to ensure the condition of the push-pull pumping (FIG. 1). A typical power spectrum of microwave phonon emission in autonomous ruby phonon laser is shown at FIG. 2.
A special feature distinguishing this experiment from those described in Chaotic was the use of a pulse lock-in method for detecting the microwave acoustic spectra. The essence of the method is as follows. A stimulated phonon emission generated in the crystal is converted by the piezoelectric film into an electromagnetic signal transmitted to a microwave spectrum analyzer. In the normal state, a beam of the input oscilloscope in the spectrum analyzer is shut off. The oscilloscope is periodically open by strobe pulses only within very short time intervals , with a strobing period being equal exactly to the period of external pumping modulation . At each lock-in time instant, the beam displayed a set of points on the oscilloscope screen indicating an instantaneous frequency distribution of the phonon mode intensity.
The shutter of a camera making photographs of the oscilloscope screen is open within a certain registration time interval , which is set as ( being an integer). Therefore, each camera shot represents a series of superimposed point sets. If the period of intensity oscillations for all of the generated phonon modes coincides with the external modulation period , a spectrum measured in this stroboscopic regime must contain a singe point representing each mode.
A different situation takes place when the intensity oscillations of the generated phonon modes are not in phase with the modulation factor. For example, if the oscillation period is doubled simultaneously for all the modes, the number of points on the image would double as well. An especially illustrative pattern observed for the stimulated emission periodicity breakage, whereby the distribution of points on the image becomes chaotic, the intermode correlation is lost, etc.
It is important to note that both qualitative and quantitative information can be obtained concerning the degree of spectral ordering, the character of regular and irregular detunings in the mode structure, etc. The pro-posed method is essentially a generalization of the well-known Poincaré cross-sections method (see, e.g., Schuster-1984 ) to the case of a multimode system. A highly illustrative character — one of the main advantages of the Poincaré method — is fully inherited in the proposed approach.
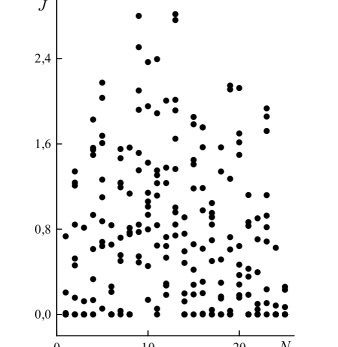
Figures 3 and 4 show typical stroboscopic spectra of the stimulated phonon emission measured at Hz (i.e., in the region of a low-frequency resonance ) and at Hz (at the maximum of the superlow-frequency resonance observed for the first time). The measurements were performed for . As is clearly seen, a low-frequency destabilization of the generation process is manifested primarily by a strong chaotic amplitude modulation of the phonon modes (FIG. 3). This is accompanied by certain broadening of the spectrum () as compared to that observed in the autonomous regime. The variation of from 70 to 200 Hz does not lead to qualitative changes of the general pattern (in agreement with the data reported previously for Chaotic ).
On the contrary, a superlow-frequency destabilization of the generation process is manifested by a pronounced (manifold) narrowing of the spectrum () on the background of a significantly lower mode amplitude automodulation (FIG. 4). However, a much more pronounced feature is the appearance of self-detunings in the microwave phonon spectrum for deviating from the maximum of the superlow-frequency resonance at Hz. The self-detuning process is manifested by motion of the region of localization of this relatively narrow mode cluster along the frequency axis at a retained localization (width) of each mode. In other words, new modes are sequentially “fired” on one side of the cluster and approximately the same number of modes are “extinguished” on the other side, up to a complete generation breakdown in a certain final portion of the frequency axis. This is usually followed by a short-time refractority, after which the generation is fired again in the opposite (starting) portion of the frequency axis and the entire process of collective motions is multiply repeated at a period of .
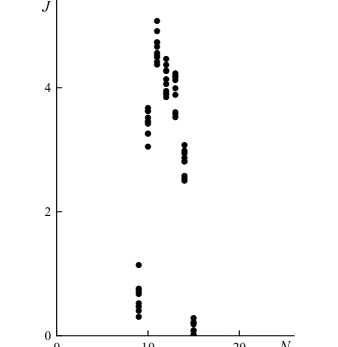
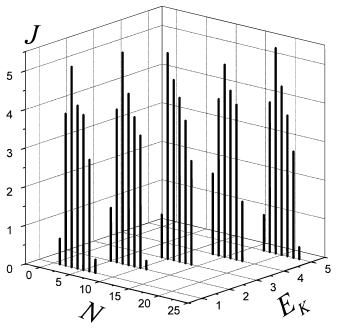
FIG. 5 shows a series of stimulated phonon emission spectra measured for Hz and . A time interval of s between sequential exposures in FIG. 5 is selected to be much greater than . For the value indicated above, the self-detuning period is s. The results of experiments showed that the value strongly depends on both absolute value and sign of and varies from a few tenths of a second for Hz up to very large values s for Hz. The direction of motion of the mode cluster is determined by the sign of : for the virtual cluster maximum position denoted by , the direction is such that .
An analogous character of self-detunings in the microwave phonon spectrum in the region of the super-low-frequency resonance is retained on the whole in a rather broad range of . Moreover, in the entire region of Oe, even the value remains virtually the same (close to 9.8 Hz). Only for a still greater detuning of the spin system with respect to the magnetic field (under these conditions, even an autonomous phonon laser may exhibit some insufficiently studied generation features TPL-1994 ), the resonance frequency begins to drop significantly (approximately by half for Oe). Here the stimulated phonon emission intensity drops by more than one order of magnitude because of a decrease in the level of pumping (which passes now via a wing of the paramagnetic resonance line). A change in the sign of does not modify the self-detuning process (in contrast to the case of changing the sign of considered above).
On the whole, the dynamics of the collective motions described above is somewhat analogous to that of autowaves Mikhailov-1990 . Indeed, the observed moving spectral structures (like the usual autowaves) are independent (within certain limits) of perturbations in the control parameters and probably result from a self-organization in the open dissipative system of a phonon laser. The energy of external excitation (in our case, a pumping field) is spent for maintaining this state, while selective external factors only switch on certain internal processes changing the system behavior. Although the motions observed in our experiments occur in the spectral “space”, these phenomena naturally reflect the corresponding processes in the real physical space of a distributed active system of the phonon laser studied.
It should be emphasized that the above-described self-detunings in the phonon spectra of a nonautonomous phaser, as well as the recently observed nonlinear phenomena in electromagnetic masers TP-1999 and autonomous acoustic quantum generators TPL-1994 ; RE-1999 , possess an essentially nonthermal nature. Although the lower characteristic frequencies of the motions observed in this study fall within a millihertz frequency range, all these motions are related to the microwave field self-action through a spin system of a paramagnet in the absence of the so-called phonon bottleneck effect Antipin-1978 (and of the resulting phonon avalanche Golenishchev ). Therefore, no overheating of the stochastic phonon subsystem takes place in the spectral range of Hz corresponding to the APR linewidth on the transition in pink ruby crystal at low temperatures. The observed frequencies of the chaotic amplitude modulation occur below Hz, while the microwave modes of the stimulated phonon emission remain very broad () for both and . In this respect, behavior of the studied system qualitatively differs from that of the optical quantum generators of class featuring a large-scale breaking of coherency (by the hydrodynamical turbulence type Weiss-1999 ) of the stimulated emission.
In conclusion, the revealed phenomenon is a kind of global spin-phonon self-organization, which is the result of superlow-frequency resonant destabilization of stationary phaser generation. All microwave modes of phonon laser oscillate with the same period, but with different, strongly determined phase shifts — as in optical class lasers with antiphase motions (see LaminarTheory and references therein). Several features of observed cooperative alternation of resonant modes in phonon laser may be described by simple balance model of active medium with spatial hole burning LaminarTheory , but detailed theory of the self-organization in phaser must include into consideration the electron-nuclear magnetic interactions Abragam-1982 . These interactions dramatically modify the processes of near-resonant energy transfer in ruby phaser JETP-1977 ; FTT-1982 due to nuclear spin polarization under conditions of electron spin-system saturation.
Acknowledgments. The author is grateful to E. D. Makovetsky (Physical Optics Chair, Kharkov V.N. Karazin National University) and S. D. Makovetskiy (Department of Computer Sciences, Kharkov National University of Radioelectronics) for their valuable help with computer processing of the experimental data.
References
- (1) C. H. Townes, Quantum Electronics (Columbia Univ. Press, New York, 1960), pp. 405-409; U. Kh. Kopvillem and V. D. Korepanov, Zh. Experim. Teor. Fiz. 41(1), 211 (1961), in Russian; C. Kittel, Phys. Rev. Lett. 6, 449 (1961).
- (2) E. B. Tucker, Phys. Rev. Lett. 6, 547 (1961); N. S. Shiren, Appl. Phys. Lett. 7, 142 (1965); P. D. Peterson and E. H. Jacobsen, Science 164, 1065 (1969); E. M. Ganapolskii and D. N. Makovetskii, Sov. Phys. – Doklady 19, 433 (1975) [translation of: Doklady AN SSSR 217(2), 303 (1974)].
- (3) A. E. Siegman, Microwave solid-state masers (McGraw Hill, New York etc., 1964).
- (4) D. N. Makovetskii and K. V. Vorsul, Sov. Phys. – Tech. Phys. 36, 50 (1991) [translation of: Zh. Tekh. Fiz. 61(1), 86 (1991)].
- (5) E. B. Tucker, Quantum Electronics: Proc. 3-rd Int. Congress, Vol. 2, edited by P. Grivet and N. Bloembergen (Dunod Editeur, Paris; Columbia Univ. Press, New York, 1964), pp. 1787–1800; E. B. Tucker, Physical Acoustics, Vol. 4A, edited by W. P. Mason (Academic Press, New York and London, 1966), p. 47;
- (6) E. M. Ganapolskii and D. N. Makovetskii, Solid State Commun. 15, 1249 (1974);
- (7) E. M. Ganapolskii and D. N. Makovetskii, Sov. Phys. – JETP 45, 106 (1977) [translation of: Zh. Experim Teor. Fiz. 72(1), 203 (1977)].
- (8) I. Camps and S. S. Makler, Solid State Commun. 116, 191 (2000), eprint cond-mat/0101041; I. Camps, S. S. Makler, H. M. Pastawski, and L. E. F. Foa Torres, eprint cond-mat/0101043; G. D. Sanders, C. L. Stanton, and C. S. Kim, eprint cond-mat/0101459; Yu. E. Lozovik, S. P. Merkulova, and I. V. Ovchinnikov, Phys. Lett. A 282, 407 (2001).
- (9) D. N. Makovetskii, Radiofizika i Elektronika (Proc. of Instute for Radiophysics and Electronics of Nat. Acad. Sci. of Ukraine) 6(1), 124 (2001), in Russian; E. M. Ganapolskii and D. N. Makovetskii, Sov. Phys. – Tech. Phys. 34, 1220 (1989) [translation of: Zh. Tekh. Fiz. 59(10), 202 (1989)]; E. M. Ganapolskii and D. N. Makovetskii, Sov. Phys. – Tech. Phys. 37, 218 (1992) [translation of: Zh. Tekh. Fiz. 62(2), 187 (1992)].
- (10) K. Wiesenfeld, C. Bracikowski, G. James, and R. Roy, Phys. Rev. A 65, 1749 (1990); B. A. Nguyen and P. Mandel, Opt. Commun. 138, 81 (1997); A. G. Vladimirov, E. A. Viktorov, and P. Mandel, Phys. Rev. E 60, 1616 (1999).
- (11) M. Georgiou, P. Mandel, and K. Otsuka, IEEE J. Quantum Electronics, 30, 854 (1994).
- (12) E. M. Ganapolskii and D. N. Makovetskii, Solid State Commun. 90, 501 (1994); E. M. Ganapolskii and D. N. Makovetskii, Ukrainian Phys. Journ. 38(2), 222 (1993) in Russian.
- (13) D. N. Makovetskii, Tech. Phys. Lett. 27(6), 511 (2001) [translation of: Pis’ma Zh. Tekh. Fiz. 27(12), 57 (2001)].
- (14) D. N. Makovetskii, Proc. 4-th Int. Symp.: Physics and Engineering of Millimeter and Submillimeter Waves — MSMW’2001 (June 4–9, 2001), Vol. 2 (Kharkov, 2001), pp.762–764.
- (15) H. G. Schuster, Deterministic chaos. An introduction (Physik-Verlag, Veinheim, 1984).
- (16) E. M. Ganapolskii and D. N. Makovetskii, Tech. Phys. Lett. 20(11), 854 (1994) [translation of: Pis ma Zh. Tekh. Fiz. 20(21), 65 (1994)].
- (17) A. S. Mikhailov, Foundations of Synergetics I. Distributed Active Systems (Springer, Berlin, 1994).
- (18) D. N. Makovetskii, A. A. Lavrinovich, and N. T. Cherpack, Tech. Phys. 44, 570 (1999) [translation of: Zh. Tekh. Fiz. 69(5), 101 (1999)].
- (19) D. N. Makovetskii, Radiofizika i Elektronika (Proc. of Instute for Radiophysics and Electronics of Nat. Acad. Sci. of Ukraine) 4(2), 91 (1999), in Russian.
- (20) A. A. Antipin, L. D. Livanova, and A. A. Fedii, Sov. Phys. – Solid State 20, 1030 (1978) [translation of: Fiz. Tverd. Tela (Leningrad) 20, 1783 (1978)].
- (21) V. A. Golenishchev-Kutuzov, V. V. Samartsev, N. K. Solovarov, and B. M. Khabibullin, Magnetic Quantum Acoustics (Nauka, Moscow, 1977), in Russian; V. A. Golenishchev-Kutuzov, V. V. Samartsev, and B. M. Khabibullin, Pulsed Optical and Acoustical Spectroscopy (Nauka, Moscow, 1988), in Russian.
- (22) C. O. Weiss, M. Vaupel, K. Staliunas, G. Slekys, and V. B. Taranenko Appl. Phys. B 68, 151 (1999).
- (23) A. Abragam and M. Goldman, Nuclear magnetism. Order and Disorder (Clarendon Press, Oxford, 1982).
- (24) E. M. Ganapolskii and D. N. Makovetskii, Sov. Phys. - Solid State. 24, 1119 (1982) [translation of: Fiz. Tverd. Tela (Leningrad) 24, 1960 (1982)].