Electronic structure, exchange interactions and Curie temperature in diluted III-V magnetic semiconductors: (GaCr)As, (GaMn)As, (GaFe)As.
Abstract
We complete our earlier (Phys. Rev. B, 66, 134435 (2002)) study of the electronic structure, exchange interactions and Curie temperature in (GaMn)As and extend the study to two other diluted magnetic semiconductors (GaCr)As and (GaFe)As. Four concentrations of the 3d impurities are studied: 25%, 12.5%, 6.25%, 3.125%. (GaCr)As and (GaMn)As are found to possess a number of similar features. Both are semi-metallic and ferromagnetic, with similar properties of the interatomic exchange interactions and the same scale of the Curie temperature. In both systems the presence of the charge carriers is crucial for establishing the ferromagnetic order. An important difference between two systems is in the character of the dependence on the variation of the number of carriers. The ferromagnetism in (GaMn)As is found to be very sensitive to the presence of the donor defects, like AsGa antisites. On the other hand, the Curie temperature of (GaCr)As depends rather weakly on the presence of this type of defects but decreases strongly with decreasing number of electrons. We find the exchange interactions between 3d atoms that make a major contribution into the ferromagnetism of (GaCr)As and (GaMn)As and propose an exchange path responsible for these interactions. The properties of (GaFe)As are found to differ crucially from the properties of (GaCr)As and (GaMn)As. (GaFe)As does not show a trend to ferromagnetism and is not half-metallic that makes this system unsuitable for the use in spintronic semiconductor devices.
I Introduction
The discovery of the ferromagnetism in (GaMn)As ohno_gaas with the Curie temperature of Ga0.947Mn0.053As as high as 110 K attracted much attention to the III-V diluted magnetic semiconductors. This attention was stimulated by both the possibility of deeper understanding of the fundamentals of long-range ferromagnetism in semiconductors and the practical need for the ferromagnetic diluted magnetic semiconductor (DMS) materials with high Curie temperature for the realization of the semiconductor spin-electronic devices.
On the theoretical side both the model-Hamiltonian approach (see recent reviews dietl_rev ; dms_mac ) and the parameter-free calculations within the density functional theory (see, e.g., a review sanvito_rev ) are intensively used to study the magnetism of the DMS. One of the important directions of the both theoretical techniques is the calculation of the exchange interactions and Curie temperature in the DMS systems (see, e.g., diofma ; mark01 ; bopa ; jukosi ; erpe ; sabr02_1 ).
In the previous paper sabr02_1 (hereafter referred to as I) we used the supercell and frozen-magnon approaches to study the exchange interactions and Curie temperature of (GaMn)As for four different Mn concentrations. The present work extends the study to the cases of Cr and Fe impurities. Since a Cr atom has one electron less and an Fe atom one electron more than a Mn atom, comparison of the results for three DMS systems allows the investigation of the trends in the variation of magnetic properties within the series of the DMS.
One of the issues attracting much attention is the dependence of the Curie temperature on the presence of nonmagnetic defects. Such defects can be introduced purposely, e.g., by co-doping, or appear in an uncontrolled manner during the sample preparation (e.g., AsGa antisites). Since these defects change the density of carriers they can strongly influence the magnetism of the DMS systems. dietl_rev ; dms_mac ; sanvito_rev This influence is also addressed in the paper.
The Cr and Fe impurities in GaAs were recently studied theoretically. mark01 ; sato_rev In Ref. mark01 the exchange interactions within small clusters of the 3d impurities have been studied. In Ref. sato_rev , the coherent potential approximation has been used to estimate the energy difference between the ferromagnetic and spin-glass states. In both works the authors came to the conclusion of the strong ferromagnetic exchange interactions in (GaCr)As. No trend to the ferromagnetism has been found in (GaFe)As. First attempts to synthesize these systems have been reported. sazaak ; mokata Although the dominant magnetic interactions between Cr atoms were found to be ferromagnetic no high Curie temperature in (GaCr)As was detected. sazaak Interestingly, the zinc-blende CrAs that has recently been successfully grown on GaAs is ferromagnetic with the Curie temperature higher than room temperature. akmash This system has been designed on the basis of the calculations within the framework of the density-functional theory (DFT) and its properties are is good agreement with theoretical predictions. akmash
The purpose of the present work is to provide detailed study of the exchange interactions and Curie temperature in the series of diluted magnetic semiconductors: (GaCr)As, (GaMn)As, (GaFe)As. Much attention is devoted to the comparative analysis of the systems. One of our aims is to further stimulate experimental interest to (GaCr)As and (GaFe)As systems.
The remainder of the paper is organized as follows. In Sect. II we discuss a simple two-band model studying the relation between the magnetic structure, the band occupation and the band energy. In Sect. III we briefly present the calculational approach. In Sect. IV we discuss the calculational results for (GaMn)As, (GaCr)As, and (GaFe)As systems. Our conclusions are given in Sect. V.
II Kinetic exchange and band occupation
It is common to treat the magnetism of the DMS in terms of the competition between the antiferromagnetic superexchange and ferromagnetic kinetic exchange through charge carriers (see, e.g., Refs. akai ; mark01 ) The definitions of different types of exchange interactions rely on different model Hamiltonians and their perturbative treatments. magnetism_anderson Since the DFT is not based on a model Hamiltonian approach and does not use a perturbative treatment, various exchange interactions appear in the calculational results in a mixed form. In this situation the studies of simple models of electron systems relevant to the problem provide information useful in qualitative interpretation of the DFT results.
Here we consider a simple two-band tight-binding model of itinerant electrons experiencing local exchange fields of atomic magnetic moments. We consider helical configurations of the atomic moments and study the dependence of the band energy of the system on the magnetic structure. Three cases are discussed: completely filled bands, almost empty bands and almost filled bands. The helical structures are defined by the formula
| (1) |
where are the lattice vectors, is the wave vector of the helix, is the unit vectors in the direction of the magnetic moment at site , polar angle gives the deviation of the moments from the axis. The helical structures allow to describe broad range of magnetic configurations from collinear ferromagnetism ( or ) to collinear antiferromagnetism ( and , is a reciprocal lattice vector).
The tight binding method for spiral structures was discussed in its general form in Ref. sand86 . By neglecting the difference in the spatial dependence of the basis functions with opposite spin projections and by preserving only the single-center matrix elements of the exchange potential we arrive at the following simple form of the secular matrix:
| (2) |
where , , and describes spin-degenerate bands of a non-magnetic crystal. The derivation of Eq. (2) is based on the special symmetry of the helical structures.adv This model describes one electron band with two opposite spin projections. At each lattice site the band-electron states experience a local exchange field of strength . The model neglects the effects of hybridization between magnetic and band electrons and therefore is not suitable for the description of the superexchange.magnetism_anderson It, however, takes into account interactions characteristic for the kinetic exchange through charge carriers.magnetism_anderson ; deGennes ; mrsafr ; comm2 We will study the dependence of the energy of the band electrons on the magnetic configuration.
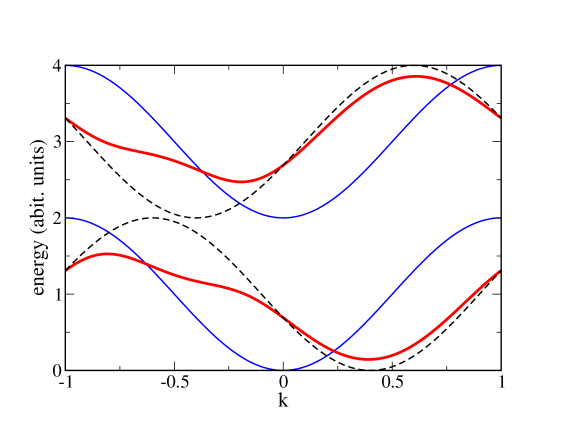
To understand the structure of the electron bands of the spiral it is important to notice that the ferromagnetic configuration of the local moments can be considered as a spiral with and arbitrary . The consideration of the ferromagnet as a spiral leads to a rigid shift of the spin-up subband to the right by and the shift of the spin-down subband to the left by . If now the angle becomes nonzero the shifted bands of the opposite spin hybridize because of non-zero off-diagonal elements of the secular matrix [Eq. (2)]. This leads to the repulsion of the states that are close in energy (e.g., the states at in Fig. 1). Additionally, there is an intraband mixing of the states separated by vector in the reciprocal space (see the diagonal elements of the secular matrix.
First, let us consider the case of completely filled bands. In this case the total energy equals to
| (4) |
and does not depend on the magnetic configuration. (In Eq. (4) the integration is carried out over the first Brillouin zone (BZ).) This means that the kinetic exchange taken into account by Eq.(2) does not influence the magnetic configuration in the system with filled bands. The superexchange not accounted for by Eq.(2) plays the main role in the case of completely filled bands.
Now let us consider almost empty bands. In this case the minimum of the electron energy corresponds to the ferromagnetic structure. To prove this we show that any deviation from the ferromagnetic structure increases the the minimal energy of the band states (see Fig. 1 for an illustration).
It is sufficient to consider the lower branch of the eigenvalues . Let us take an arbitrary k. If If than . If than . Therefore, in both cases the eigenstate of the helix is higher than one of the states of the ferromagnetic crystal. For the vector satisfying , . In the usual case of having minimum at the center or the boundary of the BZ, is not the minimal energy of the ferromagnetic structure.
Also for almost filled bands the configuration of lowest energy is ferromagnetic since any deviation from the ferromagnetic state increases the energy of the electrons. To show this we first notice that the maximal energy of the band states always decreases with deviation from ferromagnetism. The proof of this is similar to that given above for the minimal energy. Since the energy of the completely filled bands does not depend on the magnetic configuration, the highest energy of the hole states means the lowest energy of the system.
In the case of exchange splitting much bigger than the width of the nonmagnetic band the low-energy eigenvalue of the secular matrix given by Eq.(2) takes the form
It can be easily verified that this subband fulfills all three properties formulated above for the set of two bands.
These properties of the model agree qualitatively with those obtained within other models, e.g., within the model of two interacting impurities. mark01 We will refer to these properties in the discussion of the results of the DFT calculations in the following sections.
III Calculational approach
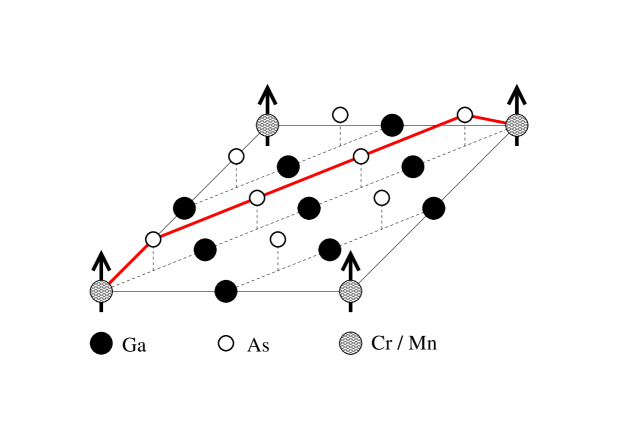
In the calculations we use the scheme discussed in I. This scheme is based on the supersell approach where one of the Ga atoms in a supercell of zinc-blende GaAs is replaced by the 3d atom. The calculations are performed for four values of the concentration : 0.25, 0.125, 0.0625, and 0.03125.
The calculations were carried out with the augmented spherical waves wikuge (ASW) method within the local density approximation (LDA) to the DFT. In all calculations the lattice parameter was chosen to be equal to the experimental lattice parameter of GaAs. Two empty spheres per formula unit have been used in the calculations. The positions of empty spheres are (0.5, 0.5, 0.5) and (0.75, 0.75, 0.75). Radii of all atomic spheres were chosen to be equal. Depending on the concentration of Mn, the super cell is cubic (x=25%, , and x=3.125%, ) or tetragonal (x=12.5%, and 6.25%, ).
The densities of states (DOS) presented in the paper are calculated for self-consistently determined ferromagnetic states of the corresponding systems.
To describe the exchange interactions in the system we use an effective Heisenberg Hamiltonian of classical spins
| (6) |
where is an exchange interaction between two 3d sites and is the unit vector pointing in the direction of the magnetic moments at site .
To estimate the parameters of the Mn-Mn exchange interaction we performed calculation for the following frozen-magnon configurations:
| (7) |
where and are the polar and azimuthal angles of vector , is the position of the th Mn atom. The directions of the induced moments in the atomic spheres of Ga and As and in the empty spheres were kept to be parallel to the axis.
It can be shown that within the Heisenberg model (6) the energy of such configurations can be represented in the form
| (8) |
where does not depend on q and is the Fourier transform of the parameters of the exchange interaction between pairs of Mn atoms:
| (9) |
In Eq. (8) angle is assumed to be small. Using one can estimate the energies of the spin-wave excitations:
| (10) |
where is the atomic moment of the Mn atom. Performing back Fourier transformation we obtain the parameters of the exchange interaction between Mn atoms:
| (11) |
The calculation of for different Mn concentrations has been performed for uniform meshes in the first BZ. Angle is selected in the proportionality region between and .
The Curie temperature was estimated in the mean-field (MF) approximation
| (12) |
We use rigid band approach to calculate the exchange parameters and Curie temperature for different electron occupations in each of the systems studied. This allows to simulate the influence of the As antisites and the nonmagnetic co-doping for a given concentration of 3d impurities. We assume that the electron structure calculated for a DMS with a given concentration of the 3d impurity is basically preserved in the presence of defects. The main difference is in the occupation of the bands and, respectively, in the position of the Fermi level. For each electron occupation we calculated the energy of the frozen-magnon states and the interatomic exchange parameters.
IV Calculational results
IV.1 (GaMn)As
The main body of the calculational results for (GaMn)As is presented in I. Here we discuss the dependence of the calculated Curie temperature on the number of carriers. The experimental studies show that the concentration of holes in (Ga,Mn)As is lower than the concentration of the Mn atoms. ohno_jmmm One of the important factors leading to the low concentration of holes is the presence of the As antisites. (See Refs. akai ; sanv_apl01 ; korz02 ; sabr02_1 for earlier DFT studies of the influence of the As antisites on the properties of the DMS.)
Since As has two more valence electrons compared with Ga, each As antisite compensate the holes produced by two Mn atoms. We study the influence of the number of electrons in the broad interval from (two electrons per supercell less) to (to electrons per supercell more). Concretely, for each frozen-magnon configuration studied we perform the total energy calculation for different and then for each the procedure of the evaluation of the exchange interactions described in Sec. III is used. Negative values of the Curie temperature in Fig.2 indicate an instability of the ferromagnetic state due to dominating antiferromagnetic interactions.
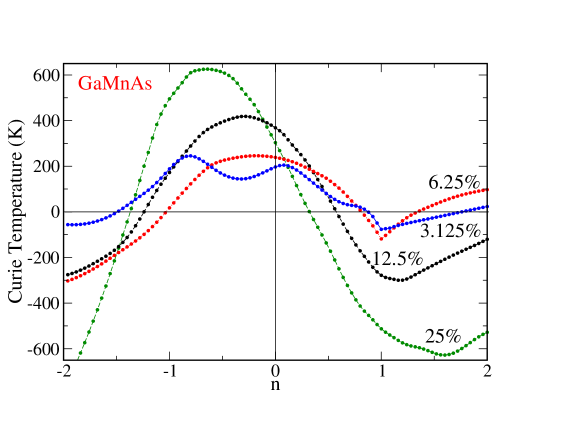
The following features are important. First, for all concentrations the value of the Curie temperature oscillates with occupation. It is negative for (two additional holes), increases with increasing occupation, changes sign and reaches the maximum in the interval between (one additional hole) and . Then it decreases again, changes sign in the interval between and (one additional electron) reaches minimum and increases again. The only deviation from this scenario is the case of where the curve has two maxima, one close to and another to . (The two-maxima shape of the curve can be related to the properties of the electron DOS presented in I in the energy region just below the Fermi level: the closeness of the top of the spin-down valence band to the Fermi level and a deep minimum in the spin-up DOS.) A remarkable feature in the dependences is the kink at for and . This value corresponds to a completely filled valence band and empty conduction band. Correspondingly, for the carriers are holes in the valence band and for the carriers are electrons in the conduction band. The abrupt change of the character of the carrier states at results in the discontinuity of the slope of . For and the kink is not obtained because of the overlap of the valence and conduction bands. Also the minimum for these concentrations is shifted to a non-integer value of that depends on the details of the band overlap and cannot be predicted without calculations.
The amplitude of the curves decreases with decreasing . Therefore, potentially the highest Curie temperature can be reached for the highest Mn concentration. This, however, needs large-scale tuning of the number of carriers. (Both, the growth of the samples with Mn concentration of the order of 20 and corresponding large-scale tuning of the number of carriers are technologically hardly possible.) It is interesting to consider the dependence of on concentration for various numbers of electrons . Since the form of the curves differs considerably for different they intersect (Fig. 2). The intersection of the curves influences the dependence of on concentration (Fig. 3). Indeed, if before intersection at some , for concentration is larger than for concentration after the intersection the relation is opposite. The last property is reflected in Fig. 3 where the value of as a function of is shown for different hole concentrations. Indeed, a monotonous dependence for n= is replaced by a nonmonotonous behavior for with the maximum at .
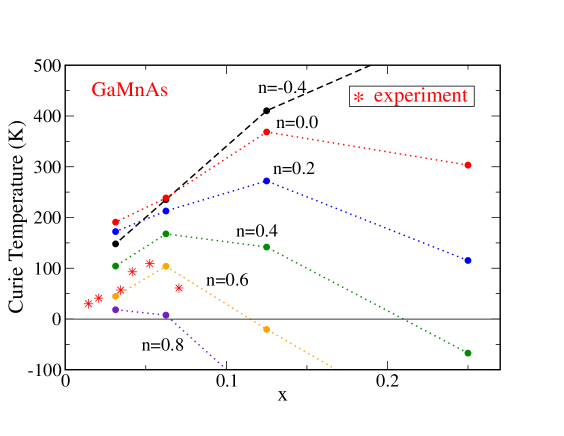
For and the maximum corresponds to . The experimental values obtained in Ref. matsukura are in good agreement with the values for . For the maximum value of the Curie temperature corresponds to the lowest Mn concentration.
Note that the mean-field approximation usually overestimates the Curie temperature and the comparison of with experiment should be made with caution. For example, the value of the Curie temperature of (GaMn)As obtained in I within the random phase approximation (RPA) is about 15-20% smaller than the . This means that good agreement with the experimental Curie temperatures just for might be accidental. The most important result of the calculation is the qualitative trends obtained with the variation of the number of carriers.
In general, Figs. 2,3 confirm the picture of the ferromagnetism in DMS as mediated by the charge carriers. Indeed, the decrease of the number of holes in the valence band () leads to a fast decrease in the trend toward ferromagnetism. However, because of the oscillating character of the curves , the increase of the number of holes to more than one per Mn () has only small potential for obtaining higher Curie temperature in (GaMn)As.
Figure 2 (and the corresponding Figs. 10 and 13 in the following) show that the contribution of the completely filled bands into exchange interaction is always antiferromagnetic. Indeed, in all cases of completely filled bands ( in Fig. 2 , and in Fig. 10 or in Fig. 13) the estimation of the is negative. On the other hand, the deviation from the completely filled bands to smaller (creating holes in the filled bands) or to larger (creating electrons in the empty bands) leads to increasing and, respectively, to increasing trend to ferromagnetism. The results of the study of the two-band model in Sect. II help to understand the physical mechanism of this property in terms of the changes in the band structure with the deviation of the magnetic configuration from the collinear ferromagnetic one. Indeed, we have seen that for completely filled bands the changes in the energy of different states compensate and no increase of the total energy is connected with the deviation from the collinear ferromagnetic structure. The antiferromagnetic superexchange obtained in Fig. 2 for is not described by the model of Sect. II since the hybridization between magnetic and band electrons is not taken into account. For the case there are partially field band with holes or electron present, the ferromagnetic state becomes energetically preferable. These properties correlate with the view of the magnetism of the DMS as governed by the competition between the antiferromagnetic exchange through completely filled bands and ferromagnetic exchange through charge carriers (holes or electrons).
IV.2 (GaCr)As
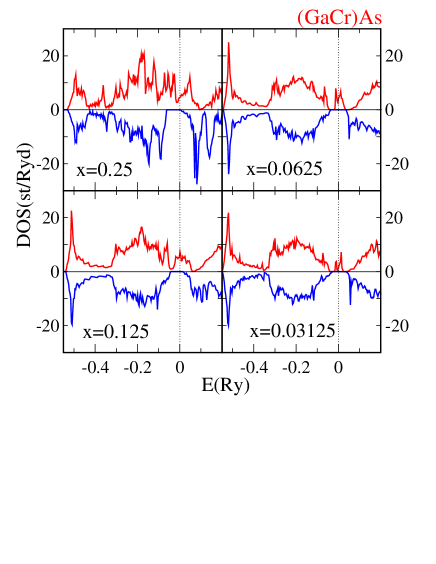
In Fig. 4 we show the DOS of (GaCr)As for four values of the Cr concentration. There is substantial difference between these DOS and the DOS of (GaMn)As presented in I. In particular, an important different feature is a higher energy position of the Cr 3d states relative to the GaAs states if compared with the position of the Mn 3d states in (GaMn)As. For the Cr concentration of this energy shift results in an impurity band lying within the semiconducting gap of GaAs and separated in energy from both the valence and the conduction bands. (In the case of (GaMn)As corresponding states lie at the top of the valence band.) The impurity band has spin-up character. The replacement of one Ga atom in the supercell of GaAs by a Cr atom does not change the number of the spin-down states in the valence band. In the spin-up channel there are, however, five additional energy bands which are related to the Cr 3d states. Two of them lie within the valence band and three in the semiconducting energy gap. Since there are five extra energy bands and only three extra electrons (the atomic configurations of Ga and Cr are 4s24p1 and 3d44s2) the impurity band is not filled. The integrated number of the occupied (electron) states in the impurity band is one per Cr atom (correspondingly, one electron per supercell). On the other hand, the integrated number of empty (hole) states in the impurity band is two per Cr atom (two holes per supercell).
With increasing , the impurity band becomes broader. At it touches the spin-down states of the conduction band still being separated by an energy gap from the valence band. At and the impurity band overlaps with both valence and conduction bands. For all concentrations the Fermi level lies in the energy gap of the spin-down DOS. Therefore for all the system is half-metallic and is characterized by a spin-polarization of the carriers at the Fermi energy. The latter property is very important for efficient spin-injection to semiconductors.
In Table 1 we present the magnetic moment of the Cr atom, the induced moment on the nearest As atom, and the magnetic moment per supercell.
| x | |||||
|---|---|---|---|---|---|
| 0.25 | 0.125 | 0.0625 | 0.03125 | ||
| Cr | 3.10 | 3.11 | 3.13 | 3.15 | |
| (GaCr)As | As | -0.09 | -0.08 | -0.07 | -0.07 |
| cell | 3.00 | 3.00 | 3.00 | 3.00 | |
| Fe | 3.18 | 3.29 | 3.40 | 3.46 | |
| (GaFe)As | As | 0.03 | 0.04 | 0.05 | 0.06 |
| cell | 3.61 | 3.87 | 4.15 | 4.39 | |
Both the Cr and As moments vary weakly with the change of . This is the result of the half-metalicity that leads to a fixed number of the spin-up and spin-down electrons in the system and, correspondingly, complicates the change of atomic moments.
Taking as an example the system with we find that the contribution of the 3d electrons into the Cr moment is 3.10 with the rest 0.05 coming from the 4s and 4p electrons. The total number of the 3d electrons in the Cr sphere is . The main contribution to the induced As moment comes from the 4p electrons.
Interestingly, the induced As moment in (GaCr)As is larger than in (GaMn)As though the Mn moment is larger than the Cr moment. The explanation of this fact is in the hybridization of the spin-up states of the 3d and As atoms. Because of this hybridization, part of the As spin-up states contributes to the hole states in the valence (GaMnAs) or impurity (GaCrAs) band and is unoccupied. The number of hole states in (GaCr)As is larger than in (GaMn)As, therefore the negative induced moment on the As atom is larger as well.
Since the ferromagnetism is expected to be mediated by carriers it is important to consider their localization about Cr atoms.
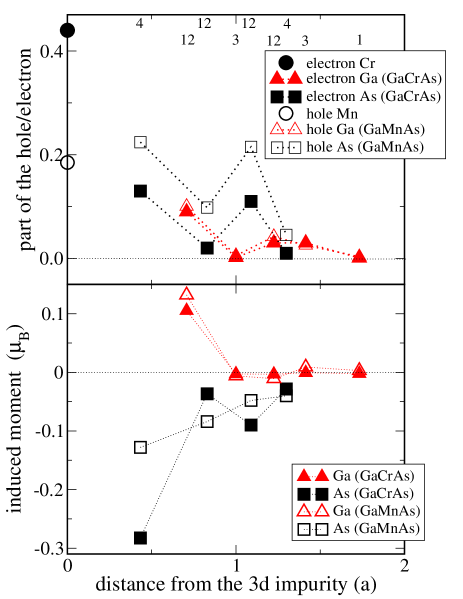
In Fig. 5 we show for the distribution in the supercell of the one electron in the occupied part of the impurity band. This distribution was calculated as follows. At first the distribution over atoms was found for each state of the occupied part of the impurity band. Then the summation over these states was performed. The number of electrons in the occupied part of the impurity band is exactly one per Cr atom (or, what is equivalent, per supercell). For comparison, we plot in Fig. 5 the data for one hole per Mn atom in (GaMn)As calculated similarly. About 44% of the electron is in the Cr sphere. The first coordination sphere of As contains 13% of the state. The third coordination As sphere with distance from the Cr atom contains 11% of the electron. We will show that the large portion of the electron states at the atoms of the third coordination sphere of the As atom is important for the magnetic ordering in the system. The first coordination sphere of Ga atoms contains 9% of the state. Each of the other coordination spheres contains less that 3% of the state.
Another important characteristic for establishing the exchange interaction between the Cr atoms is the value of induced moments (Fig.5). The induced moments on all As atoms are antiparallel to the Cr moment. The same feature was obtained in I for (GaMn)As (see Fig.5) and is explained by the contribution of the As spin-up states to the hole states in the impurity band discussed above. On the Ga atoms, the induced moments are parallel to the Cr moment. Note that the parts of the states corresponding to the Ga atoms and the induced moments on the Ga sites are very similar in both (GaCr)As and (GaMn)As. On the other hand, for the 3d and As atoms there is substantial difference between two systems.
For (GaCr)As, there is a clear correlation between the value of the induced moment and the part of the electron states in the impurity band corresponding to a given atom (Fig.5). In particular there is a sizable induced moment at the third coordination sphere of As atoms. Note that the hole states in (GaMn)As are less localized about Mn atom compared with the electron states localization about Cr atoms in (GaCr)As. On the other hand, the values of the induced moments are larger in (GaCr)As. Thus apriori it is not clear which of the two systems has potential for the ferromagnetism with higher Curie temperature.
In Fig. 6 we show calculated interatomic exchange parameters.
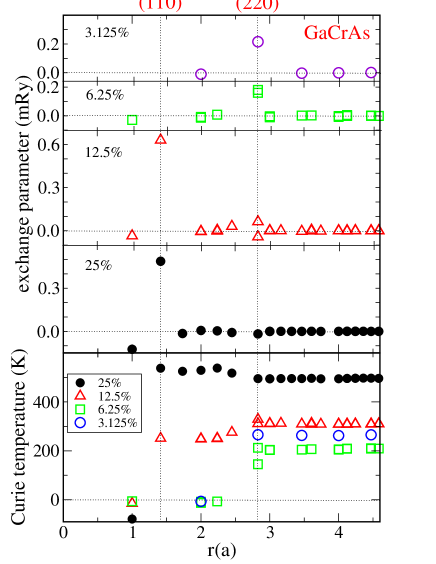
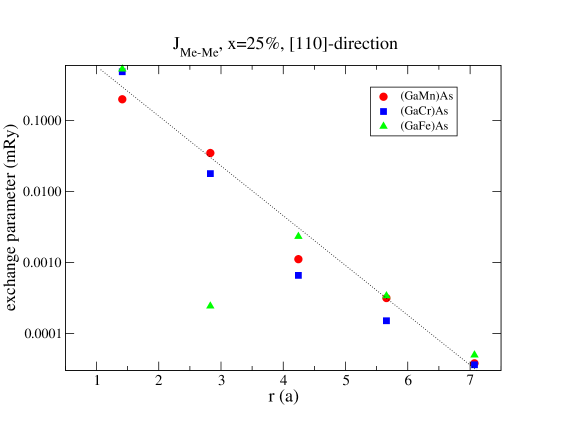
The quantitative comparison with the exchange parameters of (GaMn)As presented in I shows that they are substantially different. There is however a number of qualitative similarities. First, in both cases the Heisenberg model with the interaction between the first nearest neighbors only is not able to describe the magnetism of the system. Second, the exchange interactions are rather quickly decreasing with increasing distance between atoms. In Fig. 7 we plot the dependence of the absolute value of the exchange parameters for three different impurities on the interatomic distance using logarithmic ordinate axis. The decrease of exchange parameters is close to exponential that is expected for semiconducting and half-metallic systems.pakutu ; kudrn
In Fig. 6 we show the variation of the Curie temperature [Eq. (12)] with increasing number of the contributing coordination spheres. For instance, no noticeable contribution to the Curie temperature is obtained from the interactions between Mn atoms at the distances larger than 3. Third, the dependence of the exchange parameters on the distance between Cr atoms is not monotonous. Forth, the coordination spheres which contribute importantly into the magnetism of (GaMn)As provide, in most cases, such contribution also in (GaCr)As.
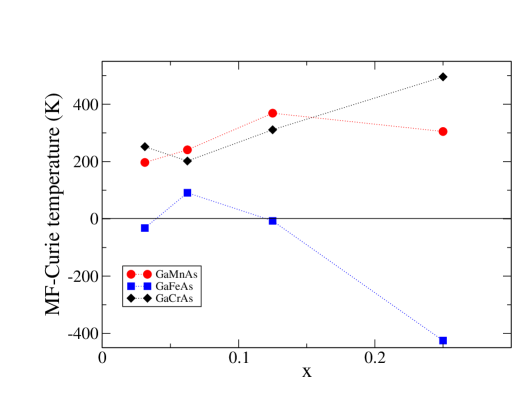
In Fig. 8 the Curie temperature of (GaCr)As for four values of the Cr concentration is presented. For and the Curie temperature is higher than in (GaMn)As, for and the relation is opposite. In general both systems give in the same temperature interval. Only for very large the Curie temperature of (GaCr)As becomes substantially larger.
The calculated exchange parameters combined with the information about the induced moments and spatial distribution of the states of the impurity band allow to suggest the exchange path responsible for the realization of the ferromagnetic state.
The analysis of the interatomic exchange interactions and their contribution into the Curie temperature (Fig. 6) shows that the main role for all concentrations of the Cr atoms is played by the exchange interaction between the Cr atoms separated by the vectors parallel to (1,1,0) (or to the vectors crystallographically equivalent to (1,1,0)). Indeed, for concentrations the main contribution to the Curie temperature comes from the atoms separated by (1,1,0). For lower concentrations the main role is played by the interaction between atoms separated by (2,2,0).
This result together with the information about the induced moments and the localization of the carrier states allow to propose the exchange path for the realization of the strong exchange interactions. Let us consider again the case of (Fig. 9).
On the straight line connecting the Cr atoms at (0,0,0) and (2,2,0) there are three Ga atoms at , , and . (The first and the third atoms are equivalent.) Since, according to Fig. 6, only very small portion of the carrier states corresponds to these atoms and the induced moments on these atoms are also very small they cannot efficiently mediate the exchange interaction between Cr atoms.
On the other hand a substantial part of the electron states in the impurity band is on the As atoms at and . Simultaneously, these atoms carry sizable induced moments. On the basis of this information we suggest the following exchange path: Cr(0,0,0)AsAs AsCr(2,2,0). Here As is equivalent to As and As is equivalent to As. The calculational information for (GaMn)As (see I) allows to suggest the same exchange path also for this system.
To get deeper insight into the magnetism of (GaCr)As we calculated the dependence of the Curie temperature on the electron occupation (Fig. 10).

Many qualitative features of these dependences are similar to those for (GaMn)As (Fig. 2). The dependences show oscillating behavior with the amplitude decreasing with decreasing Cr concentration. For there is a kink at similar to the kink at for (GaMn)As. The origin of the kink is also similar to that for (GaMn)As and consists in the transition from the occupation of the valence-band states at to the occupation of the impurity-band states at . At the valence band is completely filled and the impurity band is empty. The curves for and have another kink at which marks the end of the filling of the impurity band and beginning of the filling of the conduction band. The reason for the increase of the interatomic ferromagnetic interactions with appearance of holes in valence band or electrons in conduction band was discussed in Sect. II in terms of two-band model and consists in the increase of the energy of the system with deviation of the moments from the parallel directions.
An important conclusion from the comparison of the Figs. 10 and 2 is that the role played in the case of (GaMn)As by holes in the valence band is played in (GaCr)As by the electrons in the impurity band. In particular, the decrease of the number of electrons results in fast decrease of the Curie temperature similar to the behavior obtained in (GaMn)As with decreasing number of holes. On the other hand, the decrease of the number of holes in (GaCr)As (the region of positive in Fig.10) first leads to a moderate increase of the Curie temperature. Only for larger ( for ) a strong decrease of is observed. (Again, a similar behavior is obtained for (GaMn)As but with decreasing lower than .) Therefore the Curie temperature in (GaCr)As is less sensitive to the presence of the As antisites and other nonmagnetic donor defects. Since the formation of the As antisites is difficult to avoid this property is of technological importance.
IV.3 (GaFe)As
An Fe atom has one additional valence electron compared with a Mn atom. Thus no hole or electron carriers can be expected in (GaFe)As on the basis of the electron count. The system can be expected to be strongly antiferromagnetic. However, the calculations show that the electron structure of (GaFe)As differs strongly from the electron structure of both (GaMn)As and (GaCr)As and a simple consideration on the basis of the electron count does not apply. The origin of this difference is in the lower energy position of the Fe 3d states with respect to the GaAs states if compared with the position of the Mn states (Fig. 11).
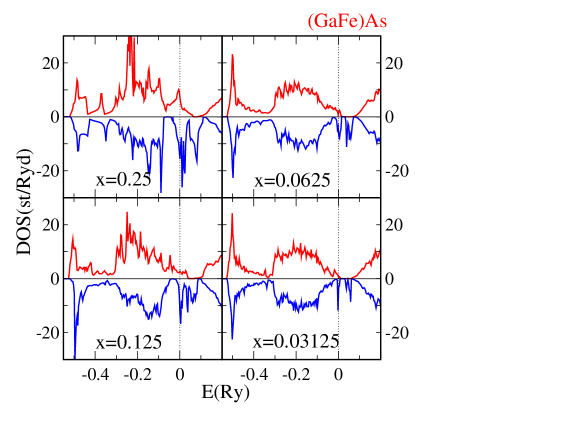
As a result, the spin-down impurity states lie at the top of the valence band and become partly occupied. Correspondingly, the spin-up impurity states at the top of the valence band are not completely filled. The presence of both spin-up and spin-down states at the Fermi level is disadvantageous for the realization of an efficient spin-injection that needs very high spin-polarization of the states at the Fermi level. With increasing the impurity bands broaden. For none of the concentrations the state of the system is half-metallic.
In Table 1 the Fe magnetic moment as well as the induced moment on the first As atom are shown. Compared with (GaCr)As, the moments strongly vary with concentration. This variation is a consequence of the presence of both spin-up and spin-down states at the Fermi level that leads to strong electron transfer between two spin channels. The induced moment is now positive and its value increases with decreasing . The reason for the change of the sign of the induced As moment is directly related to the increased number of 3d electrons in an Fe atom compared to Mn and Cr atoms. Indeed, in (GaFe)As the number of the hole spin-up states becomes very small. These hole states play a crucial role in the formation of the negative induced moments in (GaMn)As and (GaCr)As since they decrease the number of the As spin-up electron. Simultaneously, the number of the As spin-down electrons in (GaFe)As decreases since, because of a lower energy position of the Fe 3d spin-down states, the As spin-down states hybridize with empty impurity states.
The calculation of the exchange interactions shows (Fig. 12) that they are much more antiferromagnetic than for (GaMn)As and (GaCr)As.
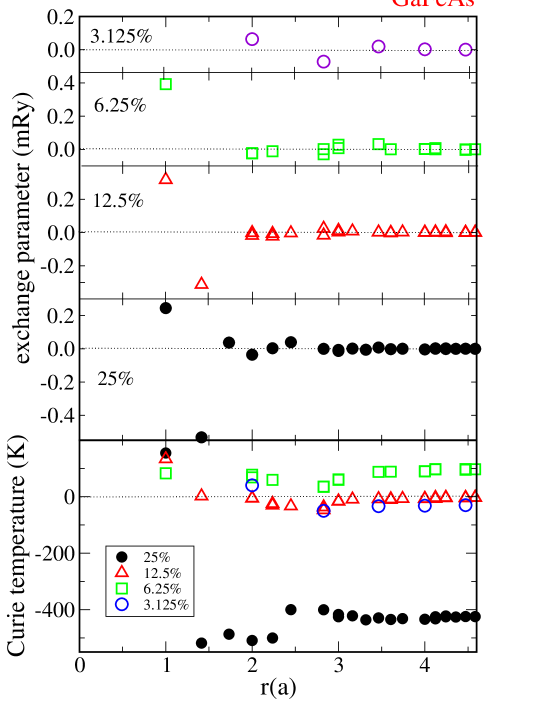
Correspondingly, the estimation of the Curie energy (Fig. 8) is negative for and and close to zero for . It is positive for but much smaller than the Curie temperature for the same concentration of the 3d element in (GaMn)As and (GaFe)As. The explanation for such behavior is in small number of the spin-up holes. The main number of the states at and above the Fermi level are of the spin-down type. The spin down hole states are strongly localized on the Fe atom (76.5%) and do not mediate ferromagnetic interactions efficiently. The curves of (Fig. 13)
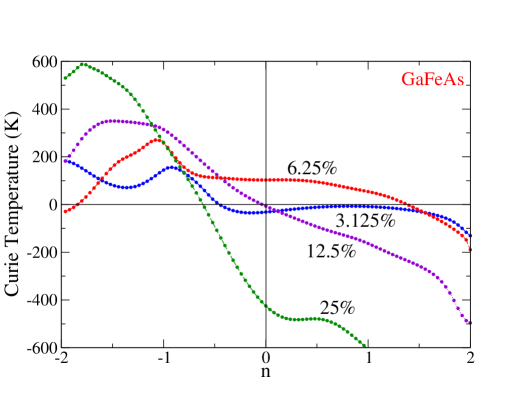
show that there is a general trend to further strengthening of the antiferromagnetic interactions with increasing . In this case the valence band is filled at . In agreement with the two-band model of Sect. II the curves have minimum at this point. Appearance of holes () leads to increasing ferromagnetic interactions. Although strong acceptor doping has some potential for increasing ferromagnetic interactions, (GaFe)As is not a good candidate for the application in the semiconductor spin-electronic devices.
V Conclusions
In the given paper we complete our study of the electronic structure, exchange interactions and Curie temperature of (GaMn)As started in I and report calculations for (GaCr)As and (GaFe)As. A different number of the valence electrons in Cr, Mn and Fe allows the investigation of the trends within the series. We find that there is a similarity in the character of the exchange interactions of (GaMn)As and (GaCr)As. The dependence of the exchange interactions and Curie temperature on the band occupation shows that the presence of the charge carriers is crucial for establishing of the ferromagnetism in (GaMn)As and (GaCr)As. We find that the role played in (GaMn)As by the holes in the valence band is played in (GaCr)As by the electrons in the impurity band. An important difference between two systems is in the character of the dependence on the variation of the number of carriers. The ferromagnetism in (GaMn)As is very sensitive to the presence of the donor defects, like AsGa antisites. On the other hand, the Curie temperature of (GaCr)As depends rather weakly on the presence of this type of defects but decreases strongly with decreasing number of electrons. The properties of (GaFe)As are found to differ crucially from the properties of (GaCr)As and (GaMn)As. (GaFe)As does not show a trend to ferromagnetism and is not half-metallic that makes this system unsuitable for the use in spintronic semiconductor devices.
We show that the sign of the induced moment on the As atoms and, correspondingly, the sign of the p-d exchange (often denoted as ) varies from negative in (GaMn)As and (GaCr)As to positive in (GaFe)As. There is a connection between the half-metalicity of the system and the negative sign of .
We show that the strongest exchange interactions in (GaCr)As and (GaMn)As are between the 3d atoms separated by the vector parallel to (1,1,0) or to a vector crystallographically equivalent to (1,1,0). On the basis of the calculated results we propose the exchange path over As atoms that is responsible for the mediating the ferromagnetic interactions between the Cr atoms.
Acknowledgements.
The financial support of Bundesministerium für Bildung und Forschung is acknowledged.References
- (1) H. Ohno, A. Shen, F. Matsukura, A. Oiwa, A. Endo, S. Kutsumoto,and Y. Iye, Appl. Phys. Lett. 69, 363 (1996).
- (2) T. Dietl, Semicond. Sci. Technol. 17, 377 (2002).
- (3) J. König, J. Schliemann, T. Jungwirth, and A.H. MacDonald, cond-mat/0111314 (unpublished).
- (4) S. Sanvito, G. J. Theurich and N. A. Hill, J. Superconductivity 15, 85 (2002).
- (5) T. Dietl, H. Ohno, and F. Matsukura, Phys. Rev. B 63 , 195205 (2001).
- (6) M. van Schilfgaarde, and O. N. Mryasov, Phys. Rev. B 63 , 233205 (2001).
- (7) G. Bouzerar and T. P. Pareek, Phys. Rev. B 65, 153203 (2002); G. Bouzerar, J. Kudrnovsky, and P. Bruno, cond-mat/0208596.
- (8) T. Jungwirth, J. König, J. Sinova, J. Kucera, and A. H. MacDonald, Phys. Rev. B 66, 012402 (2002).
- (9) S. C. Erwin and A. G. Petukhov, Phys. Rev. Lett. 22, 227201 (2002).
- (10) L. M. Sandratskii and P. Bruno, Phys. Rev. B 66, 134435 (2002).
- (11) K. Sato, and H. Katayama-Yosida, Semicond. Sci. Technol. 17, 367 (2002).
- (12) R. Moriya, Y. Katsumata, Y. Takatani, S. Haneda, T. Kondo, and H. Munekata, Physica E 10, 224 (2001).
- (13) H. Saito, W. Zaets, R. Akimoto, K. Ando, Y. Mishima, and M. Tanaka, J. Appl. Phys. 89, 7392 (2001).
- (14) H. Akinaga, T. Manago, and M. Shirai, Jpn. J. Appl. Phys., 39, L1118 (2000).
- (15) H. Akai, Phys. Rev. Lett. 81, 3002 (1998).
- (16) P. W. Anderson and H. Hasegawa, Phys. Rev. 100, 675 (1955); P. W. Anderson, in Magnetism I, edited by Rado and Suhl (Academic Press, New York and London, 1963).
- (17) L. M. Sandratskii, Phys. Stat. Solidi (b) 135, 167 (1986).
- (18) L. M. Sandratskii, Advances in Physics 47, 91 (1998).
- (19) P.-G. de Gennes, Phys. Rev. 118, 141 (1960).
- (20) O. N. Mryasov, R. F. Sabiryanov, A. J. Freeman, and S. S. Jaswal, Phys. Rev. B 56, 7255 (1997).
- (21) Note, that in Refs. magnetism_anderson ; deGennes the notion of ”double exchange” was used to study the ferromagnetic exchange interaction in mixed-valence systems. On the other hand, the same notion was used in Refs. mrsafr ; akai ; mark01 for the interpretaion of the DFT calculations where no mixed valency was present. The use of this notion is justified by the fact that the DFT calculations capture the same physics that is cosidered in the original definition of the double exchange: the lowest kinetic energy of the charge carriers for the ferromagnetic configuration of the strong local exchange fields.
- (22) A. R. Williams, J. Kübler, and C. D. Gelatt, Phys. Rev. B 19, 6094(1979).
- (23) H. Ohno, J. Magn. Magn. Mater. 200, 110 (1999).
- (24) S. Sanvito, and N. A. Hill, Appl. Phys. Lett. 78, 3493 (2001).
- (25) P. A. Korzhavyi, I. A. Abrikosov, E. A. Smirnova, L. Bergqvist, P. Mohn, R. Mathieu, P. Svedlindh, J. Sadowski, E. I. Isaev, Yu. Kh. Vekilov, and O. Eriksson, Phys. Rev. Lett. 88, 187202 (2002).
- (26) The data for x=6.25 was presented in I
- (27) F. Matsukura, H. Ohno, A. Shen, and Y. Sugawara, Phys. Rev. B 57, 2037 (1998).
- (28) M. Pajda, J. Kudrnovsky, I. Turek, V. Drchal, and P. Bruno, Phys. Rev. B 64, 174402 (2001).
- (29) An exponential decrease of the exchange parameters of half-metallic DMS was also obtained by J. Kudrnovsky (private communication) in the calculation within the coherent-potential approximation.