Absence of a True Vortex-Glass Phase above the Bragg Glass Transition Line in Bi2Sr2CaCu2O8+δ
Abstract
In magnetic measurements on Bi2Sr2CaCu2O8+δ (Bi-2212) single crystals, a general peak with a dynamical feature on both and curves was found with S the magnetic relaxation rate. At higher fields, the characteristic exponent becomes negative, together with the positive curvature of vs. and the scaling based on the 2D vortex glass theory or plastic creep theory, we conclude that the vortex motion above the second peak is plastic when and there is no vortex glass phase at finite temperatures in Bi-2212. The peak of S is then explained as the crossover between different meta-stable vortex states.
keywords:
vortex glass, vortex phase diagram, Bragg glassPACS:
74.60.Ge, 74.60.Ec, 74.72.Hs1 Introduction
One of the interesting phenomenon in the vortex system of high temperature superconductors (HTS) is the second-peak (SP) effect, which represents an anomalous increase of critical current with the increase of magnetic field. For the strong layered superconductor Bi-2212, it has already been pointed out that the SP may originate from the phase transition between a quasi-ordered Bragg glass (BG) and a disordered vortex phase[1]. The existence of BG has been supported by neutron scatting experiments[2], but it is a long standing question about what is the nature of the disordered vortex phase in high field region. Some literatures[3] reported that a 3D vortex glass (VG) exists above the second peak field and the flux dynamics is elastic with a diverging barrier in the small current limit. The vortex glass is assumed to melt into vortex liquid at a temperature [4, 5, 6], around which a scaling behavior of E-j curves is given. On the other hand it was predicted from numerical simulation that a plastic deformation will occur via the proliferation of vortex defects in high field region[8]. Similarly vortex dislocations are supposed to exist above the SP field[1, 9], and Kierfeld et al. concluded that the disordered vortex phase and vortex liquid will be thermodynamically indistinguishable after the critical endpoint of the first-order melting (FOT) line[10]. Experimentally Miu et al.[18] claimed the existence of plastic vortex creep above the second magnetization peak based on the data measured at a single temperature T = 25 K. It remains, however, unclear whether this plastic phase appears in the high field region for all temperatures. In this paper we will show clear evidence that the flux motion above the SP field is dominated by plastic motion with a finite barrier in the small current limit.
2 Experimental
Several Bi-2212 single crystals with typical size of and thickness of were used in the experiment. All of them are optimal doped or slightly overdoped with and determined in resistive measurement. The samples were measured by a vibrating sample magnetometer ( VSM 8T, Oxford 3001 ) and a superconducting quantum interfere device ( SQUID, Quantum Design, MPMS5.5 ). In all measurements the magnetic field H was applied parallel to the c-axis and the magnetization data were collected in the field descending process in order to eliminate the surface barrier. Each sample shows similar results, therefore we will not distinguish them for convenience.
3 Results and Discussion
Fig. 1 shows the relationship between the width of the magnetization-hysteresis-loops (MHL) and in double-logarithmic coordinates. An interesting feature is that each curve has a dip, as indicated by the dotted line in Fig. 1.

The dip field decreases with the increase of temperature and finally drops to the valley field associated with the SP at 22 K and keeps stable at higher temperatures. Recently we have pointed out that the SP field reappears and is independent of temperature well below 20 K[11], thus the dips at low temperatures must have no direct relation with the SP in respect that the dip fields ( Oe when K) are much higher than the SP field (about 280 Oe for this sample).

.
In order to find out the underlying physics corresponding to the dip on , we have measured the dynamical relaxation rate defined as by using different field sweep rates[12]. It has been proved that determined in the dynamical relaxation process is equivalent to the conventional relaxation rate defined as . The results are given in Fig. 2(a). Just like the dip on each curve, each curve shows a peak. For having a deeper insight to these features, we plot and vs. at 10 K together in Fig. 2(b). It is found that each curve can be divided into four parts marked as I, II, III and IV. In region I, both and are flat, i.e., independent of the magnetic field. In region II, increases monotonously with the increase of magnetic field, and begins to drop. While in region III, decreases with the increase of magnetic field, and the dropping rate of becomes slower and thus results in the dip in MHLs. Therefore, the dip on MHL is directly related to the peak on the curve. The inset of Fig. 2(b) gives the curves of another sample at 17 K and different field sweep rates. It is clear that the dip field moves to lower value when the field sweep rate decreases (corresponding to smaller current) and finally merges to the valley field of SP. Hence both of the dip on and the peak on have dynamical features and should disappear above the SP field in the small current limit in low temperature region. After decreasing in region III, upturns and increases monotonously with the field up to the irreversibility field ([13])in region IV. Due to the dynamical feature of the dip and peak mentioned above, it can be expected that the region IV will dominate the whole phase diagram above the SP field in long time or small current limit. After checking about 10 pieces of Bi-2212 single crystals, it is assured that the dip and peak feature appears in all samples without one exception. In fact, Cohen et al. have observed the same dip and peak phenomena in Bi-2212. They related the peak in to the penetration field[14]. Since the peak can still be found if we consider only the descending branch of MHLs, which strongly indicates that there is no relation between the peak and the penetration field.
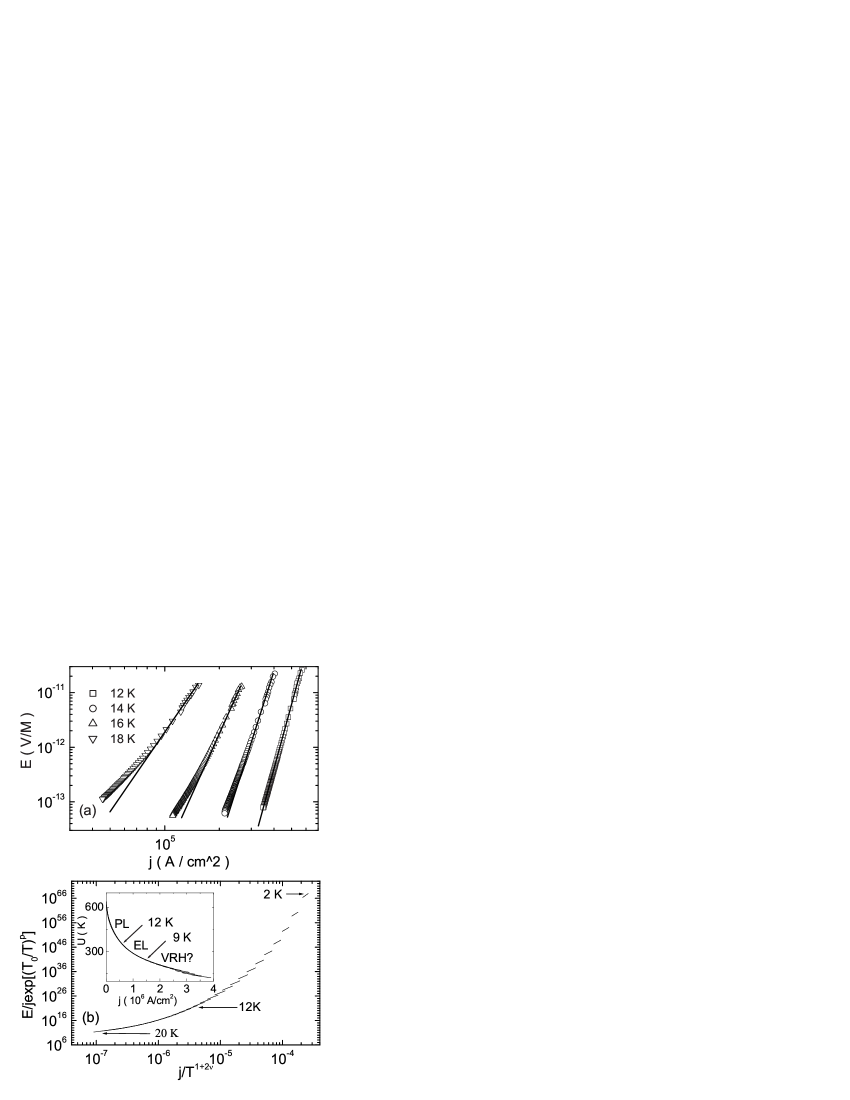
For Bi-2212 single crystals, it was found that the geometrical barrier plays an important role on the magnetization in the field ascending process[15]. The total irreversible magnetic moment of the sample is contributed by both the surface shielding current from the geometrical barrier and the bulk screening current in the field ascending process when the external field is not high. In this case local magnetic measurement using either the tiny Hall probe[16] or magneto-optical technique[17] were suggested. While when the external field is much higher than the second peak field, the contribution from the bulk current is much larger than that from the geometrical barrier and a quasi-Bean critical state model is assumed to be valid[17]. This is essentially true in the field descending process when H is decreased from a high field to a field which is still higher than the second peak field. No superposition of the magnetic moment due to the bulk current and the surface shielding current are expected here. As mentioned before our magnetization relaxation measurement was conducted in the field descending process with the external field above the second peak field. Therefore it is justified for us to derive the bulk screening current density from the magnetization. It has already been pointed out that the curve can be obtained by assuming and [21]. Fig. 3(a) shows the curves at 1 T based on this method. All the curves above 12 K are obvious concave, suggesting a finite linear resistance. Worthy of noting is that the irreversibility temperature at 1 T is about 30 K. This is a strong evidence that the vortex motion in region IV is not elastic. In order to check whether the vortex glass exists below 12 K, a naive idea is to treat 12 K as the vortex glass melting temperature and scale the curves using 3D or quasi-2D glass theory[22]. The scaled curve looks not good and the critical exponents are unreasonably large, e.g., , which is commonly believed to be less than 2[6]. Hence we fit it to the 2D VG theory[5, 23], which predicts . According to 2D VG theory the correlation length diverges at K, , where and are the 2D VG exponent and the spacing of the vortex lattice respectively; is the core energy of a vortex segment of length d. The linear resistivity due to thermal activation is given by , where is a characteristic temperature of the same order of magnitude as , and . Therefore we can scale the data as follows[24],
| (1) |
where g is an universal scaling function. The scaled result with , , is given in Fig.3(b). It is interesting to note that the values found here are very close to those found for very thin films and thin films at a high magnetic field.[24] Above 12 K, all data collapse onto one branch, while the deviation begins at about 12 K. This deviation accords with the behavior of ( shown below ) which turns from negative to positive around 12 K. In fact, we can find the same result if scaling the data based on plastic creep theory[25]. This is not strange if we recall that the plastic creep theory assumes also a correlation length diverging at 0 K, , and a linear resistivity when approaches zero, , where is the plastic pinning barrier[26]. Therefore, we conclude that the flux motion in region IV is plastic. This indicates that the vortex glass phase which is characterized by a diverging activation barrier in the small current limit may not exist in region IV. Actually, Miu et al. have also found the plastic vortex creep above SP, but their claim was made for only a single temperature ( T = 25 K ).
An important parameter characterizing the vortex dynamics is the exponent , which can be derived from the conventional magnetic relaxation measurement. Malozemoff et al.[19] assumed a general pinning barrier from which Thompson et al. gave an interpolation formula to obtain [20],
| (2) |
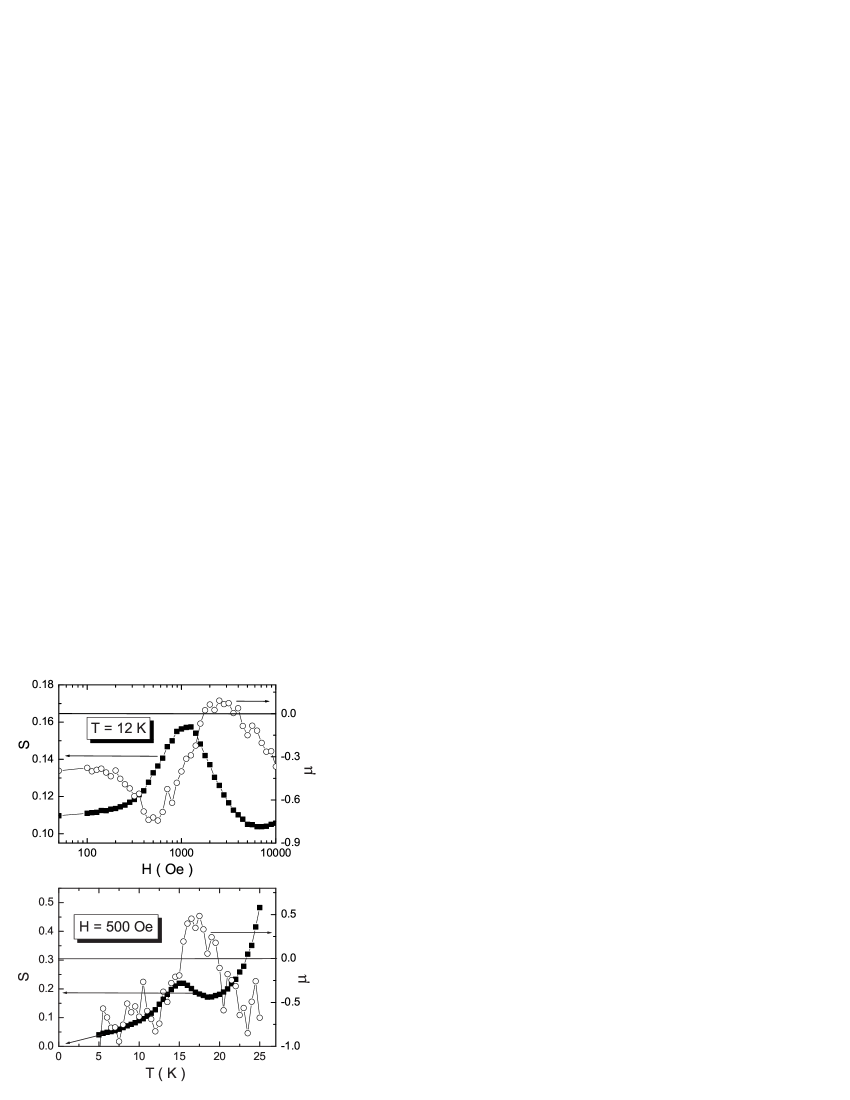
where and can be treated as constants approximately. To obtain values we have measured vs. time by SQUID and the calculated results at K and various fields are given in Fig. 4(a), in which the conventional magnetic relaxation rate is also given. To avoid the geometrical barrier in the field penetration process, each measurement was done as following: the field is raised to 5.5 T and then lowered to the expected field. It is clear that is negative in region IV. A negative indicates a finite when approaches to zero, thus conflicts with the vortex glass theory. The and curves have very similar feature as and , as shown in Fig. 4(b) for another sample with around 380 Oe[11]. The negative values found here corroborate the picture that the vortex motion in region IV is plastic.
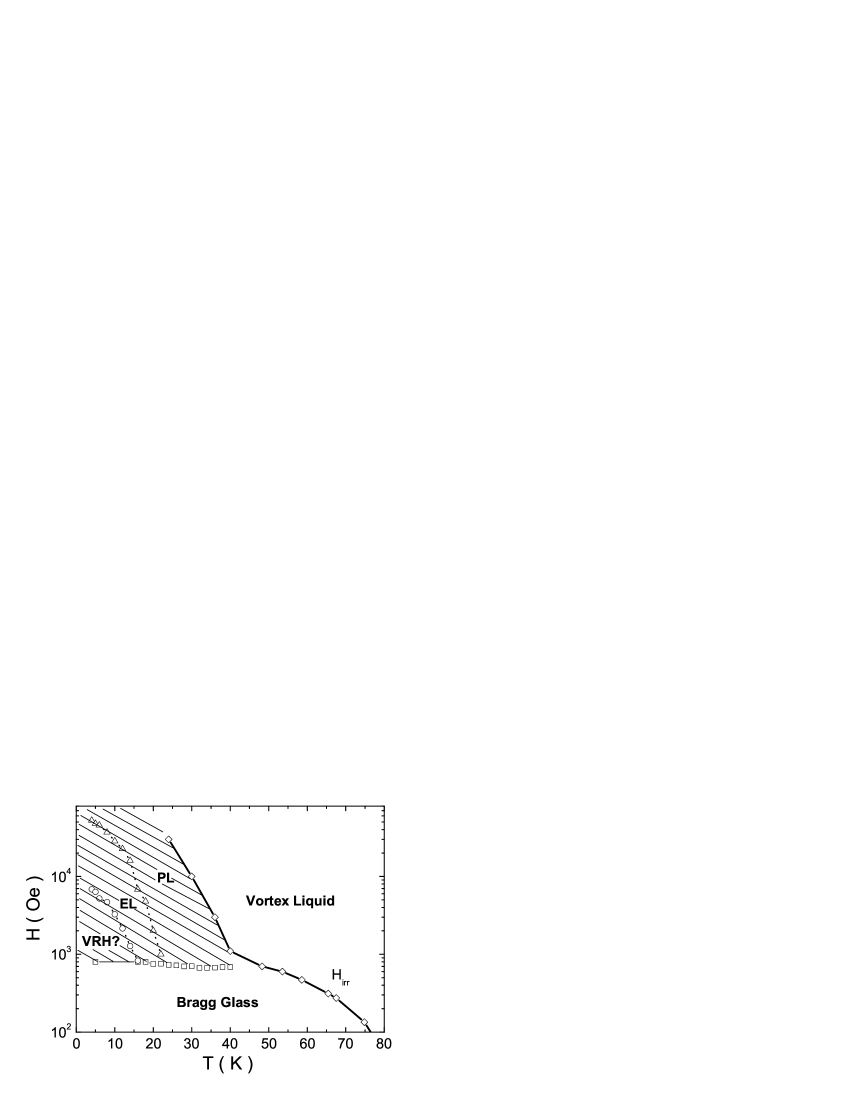
Next we try to clarify the origin of a positive value and the drop of with increasing field in region III. Joumard et al. have measured the ac susceptibility of and found the elastic (EL) creep in some part of the disordered phase[27], which is explained as , where is the dimension of the creeping vortex bundle and is the mean distance between two dislocations. Therefore, we attribute the vortex motion in region III to the 2D EL too. It was predicted that above the SP field[1, 9], where is the critical current separating the 2D EL creep and the variable-range-hopping regions (VRH). Assuming , taking , we have when . It is thus tempting to relate the positive value as an evidence of 2D EL creep. These regions are marked on the U(j) curves respecting to different current values in the insert of Fig.3(b). By further lowering T and/or H (increasing j) the optimal hopping distance will be smaller than eventually, and the VRH process will take place, leading to the fast increase of with H and T in region II. It is interesting to mention that in crystals with columnar defects Thompson et al.[29] found the similar peak on S(T) curve and dip on curve, which was also interpreted as the crossover from elastic creep to VRH. It is yet, however, to be understood why the values determined in region I and II are negative. There are two possibilities for the negative values in regions I and II: (1)The total magnetic moment in the time window we used varies too little for the program to fit and get a valid and physical meaningful value ( for region II ); (2)A superposition of the bulk current and the geometrical surface current may occur in region I. Although all these hypotheses about the dynamical processes in regions I, II and III need further clarification, it seems quite certain that the region IV has a feature of plastic creep (PL) and it will become dominant above the SP field throughout whole temperature region in the small current limit ( shown by the inset of Fig.2(b) ). Fig. 5 gives the phase diagram of Bi-2212. EL and VRH region will gradually reduce when decreases, and the whole region ( shown by the shaded area ) above SP field is dominated by plastic creep ultimately with .
4 Concluding Remarks
In conclusion, we have found a general dip on and curves and peak on and curves. They have dynamical features and are explained as the crossovers between different vortex phases. Plastic flux motion is found to be dominant far below the irreversibility line and takes over the whole region above the SP field in the small current limit.
5 Acknowledgments
This work is supported by the National Science Foundation of China (NSFC 19825111, 10274097), the Ministry of Science and Technology of China ( project: NKBRSF-G1999064602 ), the Knowledge Innovation Project of Chinese Academy of Sciences. We are grateful for fruitful discussions with Dr. Sean Ling in Brown University, Rhode Island, and Dr. Thiery Giamarchi in University of Geneva.
References
- [1] T. Giamarchi, P. Le Doussal, Phys. Rev. B 55 (1997) 6577; Phys. Rev. Lett. 72 (1994) 1530.
- [2] R. Cubitt, et al., Nature 365 (1993) 407; T. Klein, et al., Nature 413 (2001) 404.
- [3] H. Safar, et al., Phys. Rev. Lett. 68 (1992) 2672.
- [4] M. P. A. Fisher, Phys. Rev. Lett. 62 (1989) 1415.
- [5] D. S. Fisher, M. P. A. Fisher, D. A. Huse, Phys. Rev. B 43 ( 1991 )130; D. A. Huse, D. S. Fisher, M. P. A. Fisher, Nature 358 (1992) 553.
- [6] For a review see G. Blatter et al., Rev. Mod. Phys. 66 (1994) 1125.
- [7] R. H. Koch et al., Phys. Rev. Lett. 63 (1989) 1551.
- [8] S. Ryu, A. Kapitulnik, S. Doniach, Phys. Rev. Lett. 77 (1996) 2300.
- [9] J. Kierfeld, Physica C 300 (1998) 171.
- [10] J. Kierfeld, V. Vinokur, Phys. Rev. B 61 (2000) R14928.
- [11] S. L. Li, H. H. Wen, Phys. Rev. B 65 (2002) 214515.
- [12] M. Jirsa,et al., Physica C207 (1993) 85. H. H. Wen, et al., Physica C241 (1995) 353.
- [13] H. H. Wen, et al., Phys. Rev. Lett. 79 (1997) 1559.
- [14] L. F. Cohen, et al., Supercond. Sci. Technol. 10 (1997) 195.
- [15] E. Zeldov, et al., Phys. Rev. Lett. 73(1994 )1428. N. Morozov, et al., Physica C 291 ( 1997) 113.
- [16] E. Zeldov, et al., Europhys. Lett. 30 ( 1995) 367. B. Khaykovich, Phys. Rev. Lett. 76 (1996) 2555.
- [17] C. J. van der Beek, Phys. Rev. Lett. 84 (2000) 4196.
- [18] L. Miu, et al., Physica C 334(2000)1.
- [19] A. M. Malozemoff, Physica C 185-189 ( 1991 ) 264.
- [20] J. R. Thompson, et al., Phys. Rev. B 49 (1994) 13287.
- [21] G. Ries, et al., Supercon. Sci. Technol. 5 (1992) 81.
- [22] H. Yamasaki, et al., Phys. Rev. B 50 (1994) 12959.
- [23] M. P. A. Fisher, T. A. Tokuyasu et al., Phys. Rev. Lett. 66 (1991) 2931.
- [24] C. Dekker, et al., Phys. Rev. Lett. 69 (1992) 2717; H. H. Wen, et al., Phys. Rev. Lett. 80 (1998) 3859.
- [25] C. Reichhardt, A. van Otterlo, G. T. Zimányi, Phys. Rev. Lett 84 (2000) 1994.
- [26] V. M. Vinokur, et al., Phys. Rev. Lett. 65 (1990) 259.
- [27] I. Joumard, T. Klein, J. Marcus, Phys. Rev. Lett. 87 (2001) 167002.
- [28] M. P. Maley, et al., Phys. Rev. B 42 (1990) 2639.
- [29] J. R. Thompson, et al., Phys. Rev. Lett. 78 (1997) 3181.