Systematics in the superconducting and normal state properties in chemically substituted MgB2
Abstract
The superconducting transition temperature, TC, the residual resistivity and the slope of resistivity curve at high temperature, d/dT, have been measured in a series of MgB2 samples that have been chemically substituted to varying degree with Li or Cu at the Mg-site and by Li or Cu at the Mg-site along with C substitution at the B-site. DC resistivity and ac susceptibility measurements were employed to extract the above parameters. TC versus the electron count (estimated from simple chemical valence count arguments) shows a universal behaviour, with TC being constant at the MgB2 value for electron counts lower than in MgB2 but rapidly decreasing for larger electron counts. The temperature dependence of resistivity in the normal state fits to the Bloch- Gruneisen formula, from which the Debye temperature, , and the are extracted. variation with TC is not systematic, whereas versus TC shows a systematic variation that depends on the type of the chemical substituent. This dependence has a signature of the nature of the intraband/interband scattering affected by the chemical substitutions. d/dT increases with C substitution, but decreases with Li and Cu substitution, implying that C substitution leads to the domination of conductivity by the band, while in the Li/Cu substituted samples the band dominates conduction.
pacs:
74.25.Fy, 74.70.Ad, 74.62.-c, 74.62.DhI 1. INTRODUCTION
Starting with the discovery of superconductivity at 39K in MgB2 nagamatsu , there has been hectic activity both theoretical and experimental to unravel the origin of superconductivity in this system. The reduced isotope effectbudko ; hinks and the negative pressure coefficientlorentz ; tomita of TC seems to indicate that MgB2 falls in the category of conventional electron-phonon coupled superconductors with a large electron phonon coupling constantbudko ; hinks . Detailed band structure calculations performed on the system suggest that the Fermi surface consists of two cylinders arising from hole-like bonding bands and one electron like and another hole like 3-dimensional tubular network arising from the bonding and the antibonding bands.kortus ; an The phonon density of states has also been calculated for the system from which it is now clear that the E2g phonon couples non- linearly with holes in the band and that it is also anharmonic.yildrim ; kong The presence of both and bands at the Fermi surface and their different couplings with the phonons result in a k-dependent superconducting gapliu hitherto not observed in earlier superconductors. An effective two gap superconductivity seems sufficient to describe the anomalous specific heat and tunneling data in MgB2.bouquet ; giubileo Evidence for multigap superconductivity is now accruing from scanning tunneling microscopy , Raman scattering and point contact spectroscopy.iavorone ; schmidt ; chen
Various chemical substitutions have been carried out primarily to increase TC and to verify several of the early theoretical predictions. The substituents at Mg site that have been examined are Al,slusky ; postorino ; lorentz1 Si,cimberele alkali metals,zhao ; syli ; toulemonde 3d transition metalsmoritomo ; kazakov ; xu and 4d transition metals.gasporov ; kalavathi These substitutions have almost always resulted in a decrease in TC, irrespective of whether the substituent is an electron dopant or a hole dopant, with the exception of Zn substitution in which an increase in Tc of 0.2K was observed. This increase was found to correlate with an expansion of the lattice.moritomo ; kazakov A similar correlation of the volume expansion with a TC increase was also observed in our previous study on 4d- transition metal substitution in MgB2 where a small (0.5K) increase in TC was observed for 5% Nb substitution in MgB2.kalavathi One of the systems studied in detail has been Mg1-xAlxB2slusky in which TC shows a monotonic decrease with substitution in the x=0.0 to x=0.3 composition range, there is an abrupt decrease in TC at x=0.33, beyond which again a monotonic decrease in TC is observedpostorino . There is also an associated compression along the c-axis and along the a-axis resulting in a net decrease in the cell volume. Thermopower studies in this series showed that the charge carriers are holes and the decrease in TC correlates with the decrease in the hole density of states at the Fermi levellorentz1 as a result of electron doping in the system. Band structure calculations carried out in Al substituted MgB2 indicates a decrease in the area of the cylindrical part of the Fermi surface with substitution, which also correlates rather well with the decrease in TC with Al substitution.pena Be substitution in MgB2-xBex, results in a decrease in a- lattice parameter and in an increase in c- lattice parameter resulting in a net increase in volume, and phase stability in this system was observed upto x=0.6. Thermopower measurements showed an increase in hole concentration with Be substitution. Thus in the Be substituted samples despite an increase in cell volume and an increase in the hole concentration, TC decreases. It is reasoned that the decrease in TC is correlated with the decrease in ’a’ lattice parameter which leads to a depletion of charge at the B site, causing an increase in phonon frequency and decrease in electron phonon coupling.ahn1 ; ahn2 Carbon substitution at B site,zhang ; paranthaman ; jsahn ; mickelson ; takenobou ; bharathi reported by different groups showed a decrease in TC and cell volume with increase in C content. The decrease in TC is attributed to a decrease in hole density of states at the Fermi level due to electron doping. The small differences in the extent of decrease in TC among the various reports arise on account of the differences of C solubility into the MgB2 lattice. This variation in solubility has been attributed to the form of C employed in the synthesis and the method of sample preparation. We have reportedbharathi a C solubility upto x=0.30 in MgB2-xCx and a decrease in TC of upto 26K in these samples, made using a home built 50 bar pressure lock-in set-up. The decrease in TC with C concentration matches with that observed for Al substitution, possibly indicating that the additional electrons due to C/Al substitution fill the MgB2 bands in a rigid band manner. From the substitution studies, discussed above, it is clear that electron doping results in a decrease in TC, and an increase in TC due to hole doping has not been observed.
Calculationsmehl predicted an increase in TC by complete substitution of Mg by Cu and partial C substitution of B in the MgB2 lattice. The rationale behind the prediction was that C substitution for B would result in an increase in stiffness of B-C bond and hence the electron-phonon coupling strength. Since C substitution results in electron doping, known to deplete TC, it was thought that substitution of Cu for Mg would provide the compensating holes in the system. Search along similar lines led to the prediction of hole doped LiBC to be a high temperature superconductor,rosner in which the presence of the B-C network results in a large electron-phonon interaction. Early band structure calculationsan also point out that the hole DOS in MgB2 is 2-dimensional in character and that an increase in the hole concentration may not result in an increase in TC. It was shown that hole DOS is flat below EF, i.e:, will remain constant with hole doping but falls off slowly with a small increase in electron doping and rather precipitously beyond 0.2 electron addition per formula unit. In our earlier study on C doped MgB2, we indeed did see a large decrease in TC with large electron dopings, which could be attributed to a precipitous decrease in the hole DOS. In an attempt to check the hole DOS picture further, we started out on the synthesis of samples with differing hole concentration levels by suitable Li and Cu substitution and have examined the variation in TC in them with electron addition by C substitution. The two initial hole dopings we started out with were 20% Li substituted and 5% Cu substituted MgB2. These compositions were arrived at based on the determination of individual solubilities of Cu and Li in MgB2 by systematic chemical substitution studies of Cu and Li respectively.
The different series of samples that are examined in this work are, Li and Cu substitution at Mg site to study the effect of holes viz., Mg1-xLixB2 and Mg1-xCuxB2 and electron doping by C substitution at B site along with hole doping of 20%Li and 5%Cu at the Mg site, viz., Mg0.80Li0.20B2-xCx and Mg0.95Cu0.05B2-xCx. The experimental techniques employed in this study are ac susceptibility measurement for determining TC and resistivity measurement from 300K to 4.2K, to determine TC and normal state transport. The superconducting transition temperatures are extracted from the onset of the diamagnetic signal and from the zero resistance. The temperature dependent normal state resistivity is fitted to the Bloch- Gruneisen formula to extract the Debye temperature and residual resistivity . Using this and the measured TC in the McMillan equation, the electron-phonon coupling is extracted. The slope of the linear part of the resistivity curve in the 200K-300K temperature range has also been determined in each of the samples, in order to quantify the magnitude of the temperature dependence of resistivity. The various measured parameters on these samples have been compared with that in MgB2-xCx.bharathi The paper is organized as follows. In section.2 the experimental details are mentioned. In section.3 we present the various results along with the corresponding discussions in different subsections. Section.4 provides the summary and conclusions.
II 2. EXPERIMENTAL
Samples of nominal composition Mg1-xLixB2 [x=0.1, 0.2, 0.3], Mg1-xCuxB2 [x=0.01, 0.02, 0.025, 0.05], Mg0.80Li0.20B2-xCx [x=0.1, 0.2] and Mg0.95Cu0.05B2-xCx [x=0.025, 0.05, 0.15, 0.3] were prepared by the standard solid-vapour technique using Mg powder (99.9%), amorphous boron (99%), carbon soot (99%) obtained from fullerene synthesis, Li pieces (99%) and Cu powder (99.9%). The stoichiometric quantities are weighed, mixed and compacted into a Ta crucible and heat treated at 9000C for 1hour 30 minutes under a locked-in Ar pressure of 50 bar.bharathi Li was loaded inside a dry box under Ar atmosphere. Weight loss was consistently recorded to be less than 1% indicating that the nominal composition is preserved even after the heat treatment in all the samples. Samples so obtained were of 30% theoretical density and suitable for resistivity measurements by appropriate slicing. However some samples that were not compacted properly, resulted in porous powders, in which resistivity contacts could not be achieved. The samples were characterized by powder X-ray diffraction in a STOE diffractometer using Cu-Kα radiation in the Bragg-Brentano geometry. Susceptibility measurements were done by tracing the diamagnetic signal using an ac mutual inductance technique at a measuring frequency of 941 Hz for which 25 mg of finely powdered samples were used. The resistance measurements were done on 1mm thick sliced pieces in the standard four probe geometry using, 42 SWG Cu leads with silver paint as contact glue. The resistivity in each sample was measured in the Van der pauw geometry at room temperature, using which resistivity values at all the temperatures could be determined. For both susceptibility and resistivity measurements, the temperature variation from 300K to 4.2K was obtained by using a dipstick setup in the which the temperature was measured using a Si-diode thermometer with an excitation current of 10A and the data was collected through a PC, interfaced by IEEE 488 card.
III 3. RESULTS AND DISCUSSION
III.1 3.1 XRD measurements
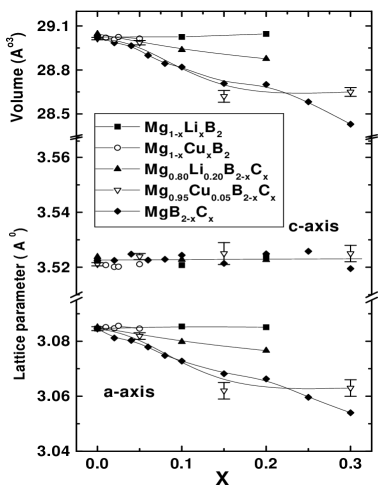
From the phase purity analysis of the XRD data it is clear that the Li solubility in MgB2 is at least 20% (x=0.2), while that of Cu is only 5% (x=0.05). Carbon substitutes upto a fraction of x=0.30 in a phase pure form in the cation substituted samples. The lattice parameters ’a’ and ’c’ and the cell volume obtained from an analysis of the XRD data using the STOE program are shown in Fig. 1, as a function of ’x’, where x is the fraction of the substituent whose concentration is varied in that particular series. It can be seen from the figure that ’c’ parameter remains more or less unchanged with substitution in all the series studied. For cationic substitutions, the ’a’ parameter also remains constant, resulting in no change in volume for samples that are substituted only at the Mg site. The lack of change in the lattice parameters with Li substitution in Fig. 1 is at variance with earlier studieszhao where a substantial decrease in ’a’ parameter was observed with Li substitution. From Fig. 1, it is seen that with C substitutions the lattice parameter along ’a’ decreases monotonically with increasing concentration with a corresponding decrease in the lattice volume. The extent of the decrease is the largest for the MgB2-xCx, intermediate in Mg0.95Cu0.05B2-xCx and small in Mg0.80Li0.20B2-xCx. The lattice constant remaining unchanged in the Li substituted samples can be rationalized based on the fact that the ionic radii of Li+ of Mg++ are not very different. The lack of change due to Cu substitution can be reconciled with, from the fact that Cu is soluble only to 5% and a difference in the ionic radii may not reflect as a measurable change in lattice constant. The decrease in the a-parameter with C content can result due to the smaller covalent radius of C in comparison with that of B. The smaller decrease in the a-parameter with C substitution in the Li and Cu substituted samples is surprising. The differences in these lattice parameter variations suggest that the electron concentration present in the sample also plays an important role in determining the equilibrium lattice constants.
III.2 3.2 TC from ac susceptibility and from dc resistivity
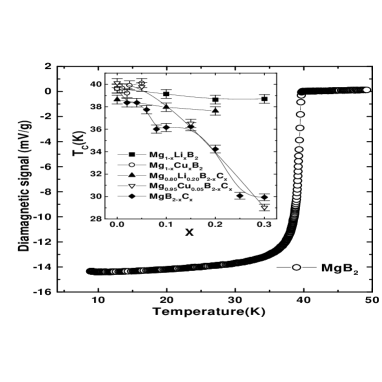
In Fig.2 is shown the variation of the diamagnetic signal for MgB2 in the 4.2K to 50K temperature range. The TC of 39.6K is deduced by reading off the value of temperature at 10% of the total diamagnetic signal determined from the onset. The transition width (TC), determined from the difference in temperatures at 90% and 10% of the total diamagnetic signal, was 1.75K. The variation of TC along each series is shown in the inset of Fig.2. The observed values of TC, TC and volume fraction of the net diamagnetic signal for the various samples are tabulated in Table.1.
[width=8cm,height=8cm]
| Mg1-yMyB2-xCx | M | y | x | Tc | Tc(K) | Vol.Frac.(mV/gm) |
|---|---|---|---|---|---|---|
| MgB2 | 0 | 0 | 39.6 | 1.75 | 14.0 | |
| MgB2-xCx | 0 | 0.02 | 38.3 | 2.41 | 12.9 | |
| 0 | 0.04 | 38.4 | 4.13 | 13.6 | ||
| 0 | 0.06 | 37.7 | 4.51 | 13.1 | ||
| 0 | 0.08 | 36.0 | 4.11 | 12.8 | ||
| 0 | 0.10 | 36.1 | 8.08 | 13.5 | ||
| 0 | 0.15 | 36.2 | 9.17 | 11.3 | ||
| 0 | 0.20 | 34.2 | 14.09 | 11.5 | ||
| 0 | 0.25 | 30.1 | 14.66 | 11.9 | ||
| 0 | 0.30 | 29.9 | 15.12 | 9.0 | ||
| Mg1-yLiyB2 | Li | 0.1 | 0 | 39.1 | 4.5 | 7.8 |
| 0.2 | 0 | 38.8 | 4.9 | 7.6 | ||
| 0.3 | 0 | 38.7 | 5.7 | 4.9 | ||
| Mg0.8Li0.2B2-xCx | 0.2 | 0.1 | 38.0 | 3.3 | 9.6 | |
| 0.2 | 0.2 | 37.6 | 5.9 | 10.1 | ||
| Mg1-yCuyB2 | Cu | 0.01 | 0 | 39.7 | 3.2 | 7.1 |
| 0.02 | 0 | 39.2 | 3.5 | 9.7 | ||
| 0.025 | 0 | 39.9 | 2.7 | 8.7 | ||
| 0.05 | 0 | 40.11 | 2.8 | 7.7 | ||
| Mg0.95Cu0.05B2-xCx | 0.05 | 0.05 | 39.8 | 3.4 | 8.5 | |
| 0.05 | 0.15 | 36.5 | 8.8 | 6.6 | ||
| 0.05 | 0.30 | 29.0 | 9.5 | 4.9 |
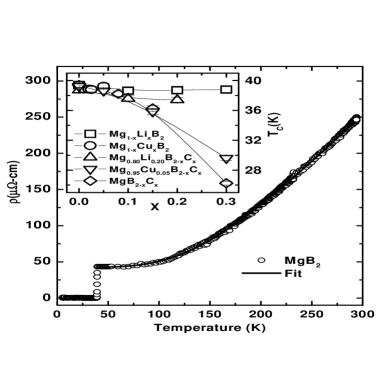
In Fig.3 is shown the temperature dependence of resistivity curve for pristine MgB2. The value of RR defined as the ratio of the resistivity at 300K to the resistivity at 40K ((300K)/(40K)), observed for MgB2 was 6 with a TC of 39.4K at zero resistance, and the transition width TC determined as the difference in the onset and downset temperature is 0.3K. The TC variation across the different series, is shown in the inset of Fig.3 and in Table. 2. The variation of TC as a function of substituent from the resistivity data is in general agreement with that observed by susceptibility measurements. It is clear from Fig.3 that in the series Mg1-xCuxB2, TC remains almost constant, whereas in Mg1-xLixB2 it shows a small decrease. The transition width is 0.3K for all these concentrations. In contrast, in all the carbon substituted samples a systematic decrease in TC is seen and the extent of decrease in TC is dependent on the amount of cation substituted. Across the series Mg0.95Cu0.05B2-xCx a decrease in the TC of 10K for a maximum carbon substitution of x=0.3 is observed, compared to a TC decrease of 14K in the MgB2-xCx series for a comparable carbon content. Whereas, in the Mg0.80Li0.20B2-xCx series only a decrease of 1K is observed and the transition width is also very small of 0.5K for all the samples in this particular series. For the other carbon substitutions, as in susceptibility measurements the transition width is seen to increase with the degree of substitution. The differences in the variation of TC for a similar extent of carbon substitution, therefore hints at the dependence of TC on other factors. We investigate one such possibility below.
III.3 3.4 TC versus electron count
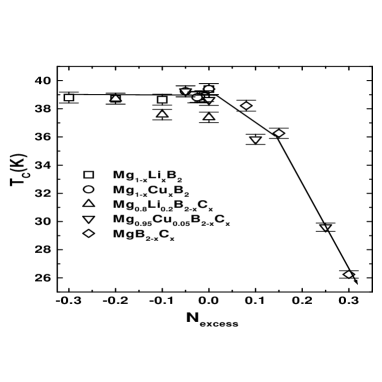
We define a parameter Nexcess, denoting the excess charge (electron/hole) with respect to MgB2 as
| (1) |
where, x is the fraction of the divalent anion substituent (assumed to donate one electron in excess of MgB2 for each atom substituted per formula unit) and y is the fraction of monovalent cation (which supplies one extra hole as compared to that in MgB2 for one atom substituted per formula unit). The general formula for a representative sample studied is given by Mg1-yMyB2-xCx, where M=Li or Cu. Nexcess can be taken as a qualitative measure of the valence electron concentration, with respect to that in MgB2. Nexcess is zero for MgB2, positive for electron doped MgB2 and negative for hole doped MgB2. A plot of Nexcess against TC is shown in Fig.4, from which it is clear that the TC remains almost constant for Nexcess 0 viz., with increase in the hole concentration in MgB2, whereas it decreases with increase in electron concentration viz., for Nexcess 0. The prominent feature in Fig.4 is that TC variation is the same for all the samples, albeit they belong to different series, depending purely on the electron count in the sample. To illustrate this point, focusing at Nexcess=0 in Fig.4, obtained from MgB2, Mg0.80Li0.20B1.80C0.20 and Mg0.95Cu0.05B1.95C0.05, one sees that the TCs are nearly the same. The TC versus Nexcess plot in Fig.4 holds a striking resemblance to the hole DOS versus energy curve shown by An and Pickett.an It was remarked in that paper that TC will not increase with hole doping whereas electron doping would result in a decrease in TC. From Fig.4 it appears that the TC remains fixed with hole doping, whereas it shows a decrease with electron doping, which is smooth upto an electron doping level of 0.2, beyond which TC drops faster in agreement with the calculation.an
| Mg1-yMyB2-xCx | Nexcess | TC | Cx103 | d/dT | ||||
|---|---|---|---|---|---|---|---|---|
| (x-y) | (K) | (K) | -cm | -cmK-2 | -cmK | |||
| MgB2 | 0 | 39.4 | 911.9 | 41.92 | 0.2536 | 3.6761 | 0.8408 | 1.2083 |
| MgB1.92C0.08 | 0.08 | 38.2 | 823.4 | 173.76 | 1.4118 | 2.4189 | 0.8784 | 1.3238 |
| MgB1.70C0.30 | 0.30 | 26.2 | 528.8 | 948.2 | 3.339 | 1.2801 | 0.9123 | 2.2609 |
| Mg0.90Li0.10B2 | -0.10 | 38.6 | 992.7 | 30.079 | 0.5079 | 1.9901 | 0.8015 | 0.7683 |
| Mg0.80Li0.20B2 | -0.20 | 38.7 | 920.1 | 22.651 | 0.2011 | 0.9223 | 0.8335 | 0.3779 |
| Mg0.80Li0.20B1.90C0.10 | -0.10 | 37.6 | 851.9 | 99.569 | 0.2705 | 1.5426 | 0.8545 | 0.6343 |
| Mg0.80Li0.20B1.80C0.20 | 0 | 37.4 | 674.4 | 271.69 | 1.3174 | 2.6158 | 0.9755 | 1.6238 |
| Mg0.99Cu0.01B2 | -0.01 | 38.9 | 936.5 | 20.550 | 0.2587 | 1.1867 | 0.8280 | 0.4510 |
| Mg0.98Cu0.02B2 | -0.02 | 38.8 | 963.4 | 34.245 | 0.4864 | 1.8878 | 0.7594 | 0.7715 |
| Mg0.975Cu0.025B2 | -0.025 | 38.8 | 928.7 | 16.971 | 0.2625 | 1.0823 | 0.8305 | 0.4480 |
| Mg0.95Cu0.05B2 | -0.05 | 39.2 | 852.6 | 27.226 | 0.2506 | 1.4668 | 0.8780 | 0.6276 |
| Mg0.95Cu0.05B1.95C0.05 | 0 | 38.6 | 800.1 | 43.603 | 0.3159 | 1.3653 | 0.8979 | 0.6455 |
| Mg0.95Cu0.05B1.85C0.15 | 0.10 | 35.8 | 785.9 | 137.64 | 0.2789 | 1.1841 | 0.8698 | 0.5686 |
| Mg0.95Cu0.05B1.70C0.30 | 0.25 | 29.6 | 851.9 | 235.43 | 0.4922 | 0.8002 | 0.7594 | 0.4978 |
III.4 3.5 Analysis of normal state resistivity
The temperature dependence of the normal state resistivity in MgB2, suggests the dominance of phonon scattering.finnemore ; canfield ; putti The normal state resistivity for each of the data from the different series investigated could be fitted to the Bloch-Gruneisen formula, in the 40K and 300K rangeputti using
| (2) |
where (T) is given by
| (3) |
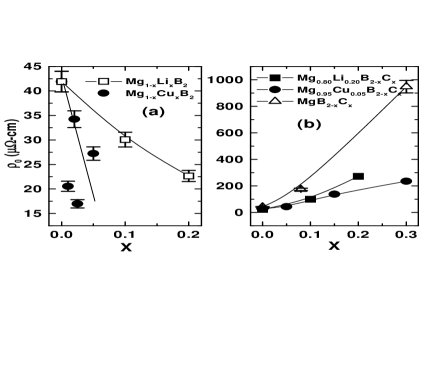
is the impurity scattering contribution to resistivity, denotes the magnitude of the electron-electron interaction parameter, m=5, is the Debye temperature and C is a constant. The fit obtained for MgB2, is shown in Fig.3 along with the experimental data, from which it is apparent that the fit is excellent. A similar quality of fit has been obtained for each of the (T) data in all the series. From the fit, the value of , , C and were extracted, which are shown in Table 2. The small values of suggest that the contribution from electron-electron scattering to the transport is negligible in the system. The obtained from the Bloch-Gruneisen fits are in close agreement with (40K), the measured resistivity prior to the superconducting transition. It can be seen from Table. 2 that decreases with C substitution, but the extent of the observed decrease is very large in comparison to that expected from mass considerations alone. In the case of Li and Cu substitutions viz., Mg1-xMxB2 (M=Li,Cu), is seen to remain constant, even though a large increase in in the former and decrease in the latter is expected. Carbon substitution on Li substituted samples also shows a similar decrease in as in MgB2-xCx. But with Carbon substitution, in the 5% Cu substituted samples remains constant in contrast to the decrease observed in MgB2-xCx and Mg0.80Li0.20B2-xCx samples. These variations versus the observed TC are shown in Fig.5, from which it is apparent that a systematics does not emerge. It should however be mentioned that the lack of systematics could have its origin on the fact that the Bloch-Gruneisen fits have been made assuming that the conductivity arises from a single dominant band; which is known to be true for pristine MgB2. The good fits to this formula would imply the dominance of single band in the substituted samples also, excepting for the fact that the dominant band could be different as will become apparent from the sections to follow. From the McMillan equation,
| (4) |
using the measured TC and the extracted , the electron phonon coupling constant, is computed with =0.15. The calculated values (cf. Table 2) for the entire series falls in the range of 0.7 and 1.0, which is in general agreement with values reported from theoretical calculations and specific heat measurements.
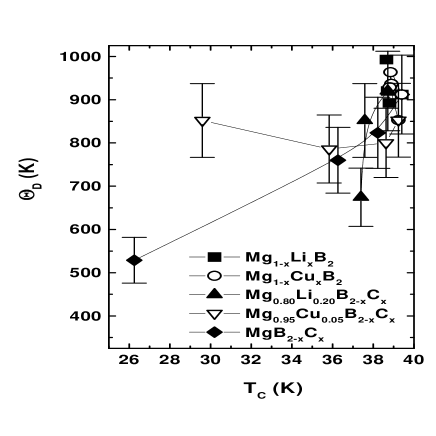
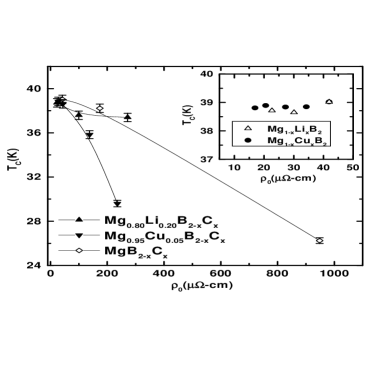
III.5 3.6 versus TC correlation
In the MgB2 system Matthiesen’s rule is violated in that samples that have a large residual resistivity also show a stronger temperature dependence of resistivity.mazin2 Further, despite the fact that impurity scattering is detrimental to superconductivity in a multiband system,golubov TC is robust to the residual resistivity variations in MgB2. These issues have been discussed in a recent calculationmazin , which suggest that the absence of interband scattering between the and bands in MgB2 and the dominance intraband - and - scattering is primarily responsible for this unusual behaviour. It has been shown that the unique electronic structure of MgB2 makes - hybridization unfavourable, an important pre-requisite for the occurrence of an interband scattering event. Further it has also been demonstrated that by introduction of scattering sites in the Mg sublattice, - hybridization is not significantly altered. Calculating the TC for different intraband/interband scattering ratios, it has been shown that the slope of the plot of versus TC which is negligible for large intraband scattering cross section increases progressively with increase in interband scattering. These results have been compared with the experimental TC values that have been obtained for pristine MgB2 from different laboratories.
Since in our present study the TC and the resistivity behaviour has been examined for a variety of chemical substitutions at the Mg-site, B-site and both Mg and B sites, it appears appropriate to see if any systematics in the variation of with TC can be discerned from our data. In Fig.6 is shown the plot of versus TC for the different series examined in this work. From Fig.6 it is clear that there is a systematic variation of TC with within each series. In the inset of Fig.6 is shown the variation of TC with by monovalent cation substitution, which appears almost flat. Taking the cue from calculationsmazin , these results suggest that the electronic conduction in the cation substituted samples is dominated by intraband scattering.mazin In the C substituted series the variation of TC with is much larger for similar extents of substitution. For example in Mg0.95Cu0.05B2-xCx, the fall of TC with is largest, followed by that in MgB2-xCx, and it is smallest for the Li substituted system viz., Mg0.80Li0.20B2-xCx. Comparing this with the calculated variation of TC with , mazin clearly suggests that the interband scattering starts playing a role in determining in the carbon substituted samples. This increase in interband scattering could arise from the presence of an excess pz electron at the C in the B layer, resulting in the an enhanced - hybridization. This hybridization may get further accentuated in the Cu substituted samples due to the presence of 3d orbitals of Cu, leading to an increased interband scattering and consequently in the pronounced variation of with TC in these samples (cf. Fig. 6).
III.6 3.7 Slope of high temperature resistivity
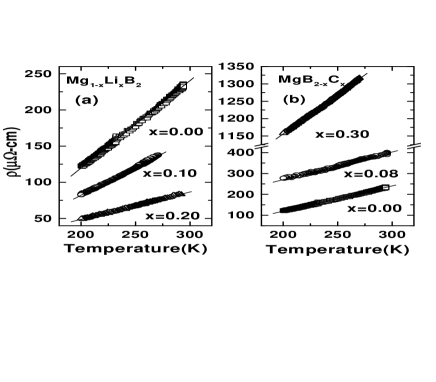
In order to obtain a quantitative measure of the temperature dependence of resistivity in the various samples, the magnitude of d/dT from the linear regime of (T) can be extracted. In Fig.7a and Fig.7b are shown the (T) data in the 200K-300K temperature range for two representative series viz., Mg1-xLixB2 and MgB2-xCx. It is clear from the Figure that in the Li substituted samples the slope decreases, while in the C substituted samples the d/dT increases with substitution.
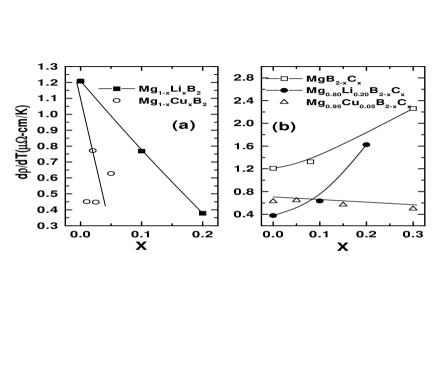
Similarly the slopes are obtained from a linear fit of the (T) data in all the samples and are tabulated in Table.2, and also shown in two panels for the cation substituted samples and carbon substitutions in Fig.8a and Fig.8b respectively. A feature that clearly emerges from the data is that the slope decreases by a large extent due to Mg substitution, implying the temperature dependence of (T) decreases in these samples with substitution. In contrast, in the carbon substituted samples i.e., in MgB2-xCx and in Mg0.80Li0.20B2-xCx the slope increases with the level of C substituted (cf. Fig. 8b), indicating that the temperature dependence of (T) increases with substitution. The degree of increase in d/dT is also high in both the series. In the Mg0.95Cu0.05B2-xCx series, however, d/dT shows a small decrease. Plotted in Fig.9a and Fig.9b in two panels is the variation of in the different series with substitution. The variation in d/dT and with the concentration of the substitutent are very similar excepting in the Mg0.95Cu0.05B2-xCx series.
In order to obtain a qualitative understanding of the variation in and d/dT in the various series we take recourse to an analysis of the conductivity in terms of the two band model thought to be most appropriate to understand normal state transport in MgB2.mazin The expression for conductivity in a two band modelmazin is given by
| (5) |
where is the plasma frequency for the band ’n’ and Wn(0,T) for n= band is given by
| (6) |
where and is the transition probability for an electron to scatter from band index n to n’ and are the transport Eliashberg functions. The expression Wπ(0,T) can be obtained by substituting for in Eq. (6). It is clear from the Eq. (5) that if the band i.e; if the first term in Eq. (5) dominates, the temperature dependence of conductivity will be large, since this band is known to couple strongly with phonons in MgB2. On the other hand if the band dominates conduction, the temperature dependence of conductivity will be small as the band couples less effectively with phonons in this system. The reduced d/dT in the cation substituted samples(cf. Fig.8a) and the enhanced d/dT in the C substituted samples (cf. Fig. 8b) therefore imply that the band dominates conduction in the former and the band dominates conduction in the latter.
The domination of the band in the carbon substituted samples (MgB2-xCx and Mg0.80Li0.20B2-xCx) would be possible if either the plasma frequency for that band is large or if the is large in Eq.5. Since it has been inferred from band structure calculations that the mazin2 ; mazin is small in MgB2, it appears that is large in the C substituted samples. This increase in the scattering, could arise due to the presence of disorder along the C-axis as a result of the proximity of the pz electrons of carbon to this region. The increase in the d/dT with increase in C content would naturally follow due to the progressive increase in consequent to an increase in the number of such scattering centres. The increase in with C substitution which is clearly seen from panels showing the C substitutions in Fig. 9b could arise due to increase in , which is also apparent from Fig.6. In the Mg0.95Cu0.05B2-xCx series the interband scattering term is very large (cf. Fig.6). This could make both the and channels of conduction in Eq.5 equally probable, because of which drawing inferences about the behaviour of either or d/dT becomes difficult. The behaviour of d/dT in the cation substituted samples shows that despite substitution in Mg sublattice the observed temperature dependence of is smaller than in MgB2, contrary to the findings of the theoretical calculationsmazin which indicate that the would be large, leading to the domination of the conductivity by the band. However the larger contribution to conductivity from the band (term2 Eq.5), observed in the cation substituted samples (cf. Fig. 8a) could occur if the relative magnitudes of the plasma frequencies from the and bands get strongly affected due to these substitutions. This is highly plausible as it has been demonstrated from band structure calculations of LiB2mazin2 that the band disposition and dispersion are strongly altered with respect to that in MgB2. It can be seen from Fig. 9a that decreases with substitution in the cation substituted samples, a result rather surprising. These would imply that the intraband scattering is progressively reduced due to these substitutions. Band structure calculations would be necessary to verify these experimental observations. Measurements of the normal stste resistivity in the Mg1-xAlxB2 in which detailed band structure calculations exists are in progress.
IV 4. SUMMARY and CONCLUSION
The variation of TC has been studied as a function of the variation in electron and/or hole concentration by appropriate chemical substitutions. A plot of TC versus the electron count estimated from the different series studied shows a universal behaviour, remaining flat for electron counts lesser than the MgB2 value whereas it steeply decreases with electron count in excess of that in MgB2. This has a striking similarity with the variation of hole DOS with energy. The ratio of the interband/intraband scattering seems to be strongly affected by the nature of the chemical dopant. The addition of C to the Boron layer seems to increase resulting in an increase in the residual resistivity and to the depletion of TC, which gets further enhanced due to Cu substitution in the Mg sub-lattice. The slope of the resistivity curve in the 200K-300K, gives an indication of the magnitude of the temperature dependence. The larger temperature dependence in the C substituted samples indicates that the -band dominates conduction in this system. The temperature dependence of resistivity in the monovalent cation substituted samples are lowered with respect to that in MgB2, suggesting an enhanced participation in conductivity due to the -bands. These results clearly demonstrate that by selective chemical substitutions conductivity from certain bands can be probed.
References
- (1) Jun Nagamatsu, Norimasa Nakagawa, Takahiro Muranaka, Yuji Zenitani, Jun Akimitsu , Nature 410, 63 (2001)
- (2) S.L.Bud’ko, G.Lapertot, C.Petrovic, C.E.Cunningham, N.Anderson and P.C.Canfield Phys. Rev. Lett. 86, 1877 (2001)
- (3) D.G.Hinks, H.Claus, J.D.Jorgensen, Nature 411, 457 (2001)
- (4) B.Lorentz, R.L.Meng, C.W.Chu, cond-mat/0102264
- (5) T.Tomita, J.J.Hamlin, J.S.Schilling, D.G.Hinks, J.D.Jorgensen, Phys. Rev. B 64, 092505 (2001)
- (6) J.Kortus, I.I.Mazin, K.D.Belashchenko, V.P.Antropov, L.L.Boyer Phys. Rev. Lett. 86, 4656 (2001)
- (7) J.M.An, W.E.Pickett, Phys. Rev. Lett. 86, 4366 (2001)
- (8) T.Yildirim, O.Gulseren, J.W.Lynn, C.M.Brown, T.J.Udovic, Q.Huang, N.Rogado, K.A.Regan, M.A.Hayward, J.S.Slusky, T.He, M.K.Haas, P.Khalifah, K.Inumaru, R.J.Cava, Phys. Rev. Lett. 87, 37001 (2001)
- (9) Y.Kong, O.V.Dolgov, O.Jepsen, O.K.Andersen, Phys. Rev. B 64, 020501R (2001)
- (10) Amy.Y.Liu, I.I.Mazin, Jens Kortus, Phys. Rev. Lett. 87, 087005 (2001)
- (11) F.Bouquet, R.A.Fisher, N.E.Philips, D.G.Hinks, J.D.Jorgensen, Phys. Rev. Lett. 87, 047001 (2001)
- (12) F.Giubileo, D.Roditchev, W.Sacks, R.Lamy, D.X.Thanh, J.Klein, S.Miraglia, D.Fruchart, J.Marcus, Ph.Monod, Phys. Rev. Lett. 87, 177008 (2001)
- (13) M. Iavarone, G. Karapetrov, A.E. Koshelev, W. K. Kwok, G. W. Crabtree and D. G. Hinks, Phys. Rev. Lett. 89 187002 (2002)
- (14) H. Schmidt, J. F. Zasadzinski, K. E. Gray and D. G. Hinks, Phys. Rev. Lett. 88, 127002 (2001)
- (15) X. H. Chen, M. J. Konstantinovic, J. C. Irwin, D. D. Lawrie and J. P. Franck, Phys. Rev. Lett. 87 157002 (2001)
- (16) J.S.Slusky, N.Rogado, K.A.Regan, M.A.Hayward, P.Khalifah, T.He, K.Inumani, S.M.Loureiro, M.K.Haas, H.W.Zanderbergen, R.J.Cava , Nature 410, 343 (2001)
- (17) P.Postorino, A. Congeduti, P. Dore, A. Nucara, A.Bianconi, D. Di Castro, S. De Negri and A. Saccone, Phys. Rev. B 65 020507(R) (2001)
- (18) B.Lorentz, R.L.Meng, Y.Y.Xue, C.W.Chu, Phys. Rev. B 64, 052513 (2001)
- (19) M.R.Cimberle, M.Novak, P.Manfrinetti and A.Palenzona, Supercond. Sci. Technol. 15, 43-47 (2002)
- (20) Y.G.Zhao, X.P.Zhang, P.T.Qiao, H.T.Zhang, S.L.Jia, B.S.Cao, M.H.Zhu, Z.H.Han, X.L.Wang, B.L.Gu, Physica C 361, 91-94 (2001)
- (21) S.Y.Li, Y.M.Xiong, W.Q.Mo, R.Fan, C.H.Wang, X.G.Luo, Z.Sun, X.T.Zhang, L.Li, L.Z.Cao, X.H.Chen, Physica C 363, 219-223 (2001)
- (22) P.Toulemonde, N.Musolino, H.L.Suo, R.Flukiger, cond-mat/0207033 Superconductivity Science and Technology 17-19, (2002)
- (23) Y.Moritomo, Sh.Xu , cond-mat/0104568
- (24) S.M.Kazakov, M.Angst, J.Karpinski, I.M.Fita, R.Puzniak, cond-mat/0103350
- (25) Sheng Xu, Yutaka Moritomo, Kenichi Kato, Arao Nakamura, cond-mat/0104534
- (26) Vitaly A.Gasparov, N.S.Sidorov, I.I.Zver’kova, M.P.Kulakov, cond-mat/0104323 JETP Letters, April 12 (2001)
- (27) S.Kalavathi, A.Bharathi, S.Jemima Balaselvi, G.L.N.Reddy, V.S.Sastry, Y.Hariharan, T.S.Radhakrishnan, Solid State Physics (India) 44 (2001)
- (28) O. dela Pena, A. Aguayo and R. des Coss Phys. Rev. B 66 012511 (2002)
- (29) J.S.Ahn, Young-Jin Kim, M.-S.Kim, S.-I.Lee, E.J.Choi, cond-mat/0202415
- (30) J.S.Ahn, E.S.Choi, W.Kang, D.J.Singh, E.J.Choi, cond-mat/0202457
- (31) Shao-ying Zhang, Jian Zhang, Tong-yum Zhao, Chuan-bing Rong, Bao-gen Shen, Zhao-hua Cheng, cond-mat/0103203
- (32) M.Paranthaman, J.R.Thompson, D.K.Christen, cond-mat/0104086
- (33) Jai Seok Ahn, Eun Jip Choi, cond-mat/0103169
- (34) W.Mickelson, John Cumings, W.Q.Han, A.Zettl, Phys. Rev. B 65, 052505 (2002)
- (35) T.Takenobu, T.Ito, Dam.H.Chi, K.Prassides, Y.Iwasa, cond-mat/0103241
- (36) A.Bharathi, S.Jemima Balaselvi, S.Kalavathi, G.L.N.Reddy, V.Sankara Sastry, Y.Hariharan, T.S.Radhakrishnan, Physica C 370, 211-218 (2002)
- (37) M.J.Mehl, D.A.Papaconstantopoulos, D.J.Singh, Phys. Rev. B 64, 140509R (2001)
- (38) H.Rosner, A.Kitaigorodsky, W.E.Pickett, Phys. Rev. Lett. 88, 127001 (2002)
- (39) D.K.Finnemore, J.E.Ostenson, S.L.Bud’ko, G.Lapertot, P.C.Canfield, Phys. Rev. Lett. 86, 2420 (2001)
- (40) P.C.Canfield, D.K.Finnemore, S.L.Bud’ko, J.E.Ostenson, G.Lapertot, C.E.Cunningham, C.Petrovic, Phys. Rev. Lett. 86, 2423 (2001)
- (41) M.Putti, E.Galleani d’Agliano, D.Marre.F.Napoli, M.Tassisto, P.Manfrinetti, A.Palenzona, C.Rizzato, S.Massidda, Eur. Phys. J. B, 25, 439-443 (2002)
- (42) I. I. Mazin and V. P. Antropov, Physica C 385, 49 (2003)
- (43) I.I.Mazin, O.K.Andersen, O.Jepsen, O.V.Dolgov, J.Kortus, A.A.Golubov, A.B.Kuz’menko, D.van der Marel, Phys. Rev. Lett. 89, 107002 (2002)
- (44) A.A. Golubov and I. I. Mazin, Phys. Rev. B 55 15146 (1997)