Dimensional Crossover of Vortex Dynamics Induced by Gd Substitution on Bi2212 Single Crystals
Abstract
The vortex dynamics of Bi2Sr2Ca1-xGdxCu2O8+δ single crystals is investigated by magnetic relaxation and hysteresis measurements. By substituting with , it is found that the interlayer Josephson coupling is weakened and the anisotropy is increased, which leads to the change of vortex dynamics from 3D elastic to 2D plastic vortex creep. Moreover, the second magnetization peak, which can be observed in samples near the optimal doping, is absent in the strongly underdoped ( with 2D vortex ) region.
keywords:
Vortex phase diagram: Bragg glass; DimensionalityPACS:
74.60.Ge , 74.60.Jg , 74.72.Hs, ,
1 Introduction
For high temperature superconductors ( HTSC ), the hole concentration is an essential parameter that controls many properties. Enormous efforts have been contributed to investigate the doping dependence of the electronic properties and the mechanism of high temperature superconductors. While a very interesting question is that how the vortex dynamics is influenced by the doping effect.
For highly anisotropic HTSC, such as Tl and Bi compounds, it has been found that the vortex dynamics can be driven from 3D to 2D at relatively high fields and high temperatures[1, 2]. Though it is generally believed that the doping will strongly affect the coupling between the Cu-O layers and further influence the vortex dynamics, there is few such research[3].
In order to see the effect of hole doping on the vortex dynamics, we have done magnetic relaxation and hysteresis measurements in a series of Bi2Sr2Ca1-xGdxCu2O8+δ single crystals. By substituting with , the hole concentration of the samples has been changed from near the optimal doping to the underdoped regime. It has been found that in the same series of samples, the substitution strongly reduces the Josephson coupling between CuO2 layers[4]. The weaker interlayer coupling will lead to higher anisotropy. We will present evidence of the change of vortex dynamics from 3D elastic to 2D plastic creep by Gd substitution.
2 Experiment
The Bi2Sr2Ca1-xGdxCu2O8+δ single crystals with x=0.09, 0.19, 0.32, 0.41 ( named by sample 1, 2, 3, 4 respectively ) were grown by the self-flux method. Details about the sample preparation were published elsewhere[5]. The in-plane and c-axis resistivity were measured using the standard four-probe method. Rather sharp superconducting transitions are observed indicating a good quality of the samples. The magnetic hysteresis and relaxation measurements were carried out on a vibrating sample magnetometer ( VSM 8T, Oxford 3001 ) and a superconducting quantum interference device ( SQUID, Quantum design, MPMS5.5 ) respectively with the external magnetic field parallel to c-axis.
To obtain the magnetic relaxation, we first cooled a sample from above to a desired temperature at zero field ( ZFC ). After that, the magnetic field was applied to a high value and then back to the measured field. The data acquisition ( magnetization vs time ) started when the field sweep was stopped. It is known that in the field descending process the vortex escapes from the sample without facing the geometrical barrier[6]. Thus only the magnetization signal induced by the bulk current was measured. For the relaxation at each point of T and H, the data collection lasted for about 3000 seconds.
3 Results
3.1 Doping state and resistivity
It’s well known that a parabolic relationship holds between the superconducting transition temperature and the hole concentration [7, 8]. So the in the underdoped region can be determined with from the measured values of . Because sample 1 is near the optimal doping, here we use its transition temperature 87K as . The dependence of vs. of the four crystals is shown in Fig.1(a). Other three samples are in the underdoped regime with = 84, 79, 63 K. Samples 3 and 4 are heavily underdoped. From the inset of Fig.1(a), it can be seen that also shows a nearly parabolic relationship with the Gd concentration . This indicates that the Gd substitution influences the hole concentration and reduces the carrier density. Though it is hard for us to measure the oxygen content of the four crystals precisely, by the fact that the c-axis resistivity increases with the Gd substitution, it is clear that the oxygen content decreases with [9, 10, 11].
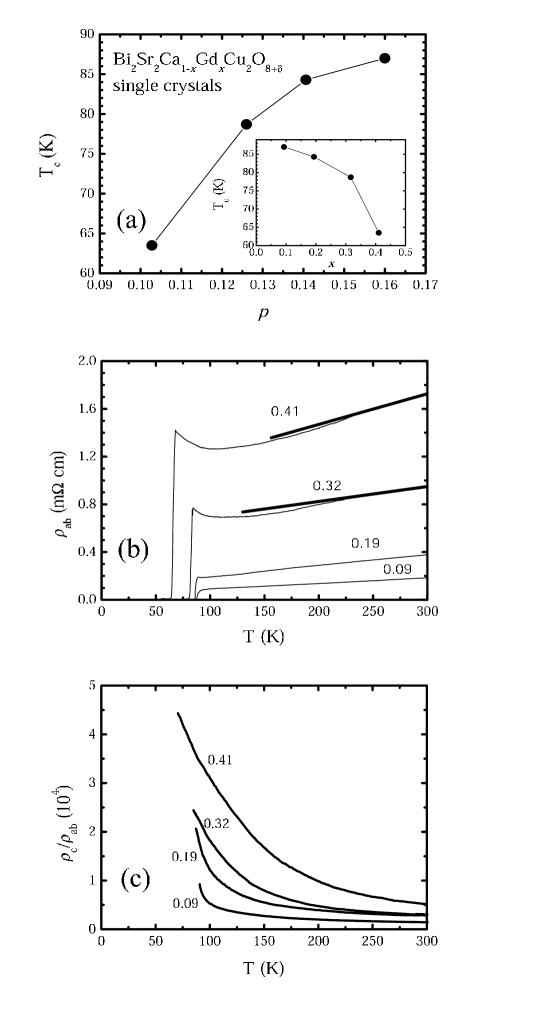
The in-plane resistivity is presented in Fig.1(b). With increasing the amount of Gd, the normal state resistivity of four samples varies greatly. Near , the resistivity of the lightly substituted samples 1 and 2 decreases linearly with lowering temperature and shows metallic behavior. While, for the heavily substituted samples 3 and 4, the resistivity rises up quickly when the temperature decreases showing a behavior more like a semiconductor or insulator. The different temperature dependence of resistivity between the lightly and heavily substituted samples reflects the underlying different electronic ground states and may strongly influence the dissipation process in these samples. In Fig.1(c), we show the ratio of c-axis to in-plane resistivity. The anisotropy can be estimated from the resistivity ratio near . The enhancement of resistivity ratios indicates that the anisotropy is enlarged by Gd substitution.
3.2 Second peak
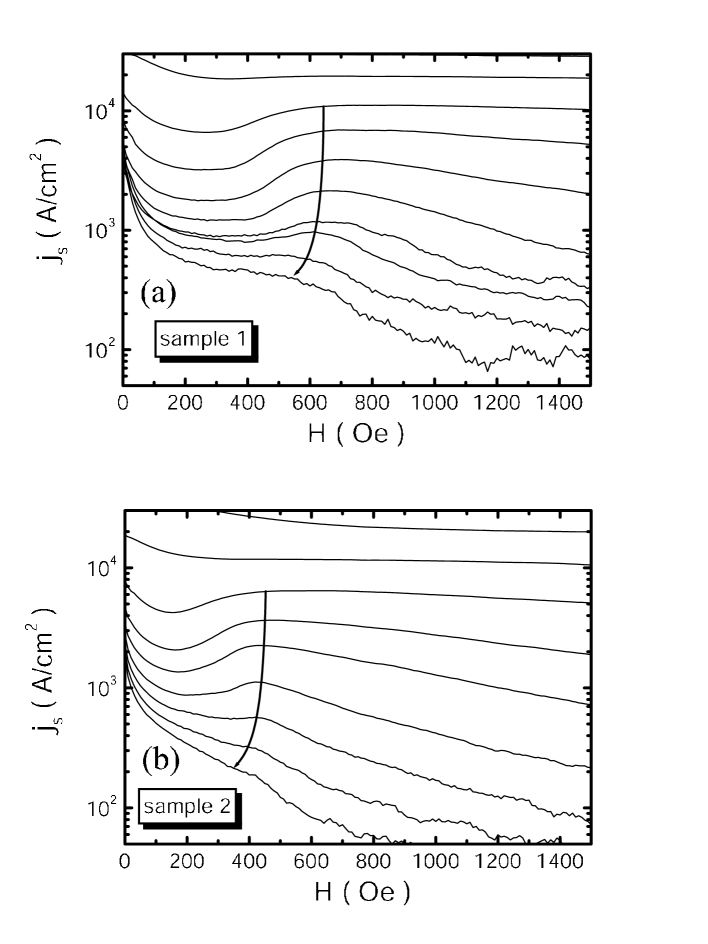
In samples 1 and 2, a second peak ( SP ) can be observed on the magnetic hysteresis loop ( MHL ) when temperature is at about 20 - 40 K. However, no second peak is observed in samples 3 and 4 at any temperatures. Following previous studies, we referred the second peak in the descending branch of a hysteresis loop as . Because the total magnetic moment M is dependent on the sample volume and shape, it is better to use the current density as a basic quantity in comparing the property between different samples. The current density can be determined by using based on the extended Bean critical state model[12, 13], where M is the total magnetic moment of the sample measured in field descending branch and V, a and b are the volume, width and length ( ) of the sample, respectively.
In Fig.2(a) and Fig.2(b), we show the magnetic field dependence of of samples 1 and 2. The crossing points of the arrowhead line with the curves indicate the positions of second peaks. At temperatures below about 45 K, the second peak is weakly dependent on the magnetic field, which in sample 2 is near 450 Oe, being lower than 600 Oe in sample 1. Moreover, the magnitude of second peak in sample 2 is also smaller than that in sample 1.
All these facts indicate that with increasing the amount of Gd, the magnitude of second peak decreases, its position moves to lower fields and finally disappears completely in the heavily underdoped samples 3 and 4. Similar results on Bi2Sr2Ca1-xGdxCu2O8+δ single crystals are reported by other authors[11].
3.3 Magnetic relaxation
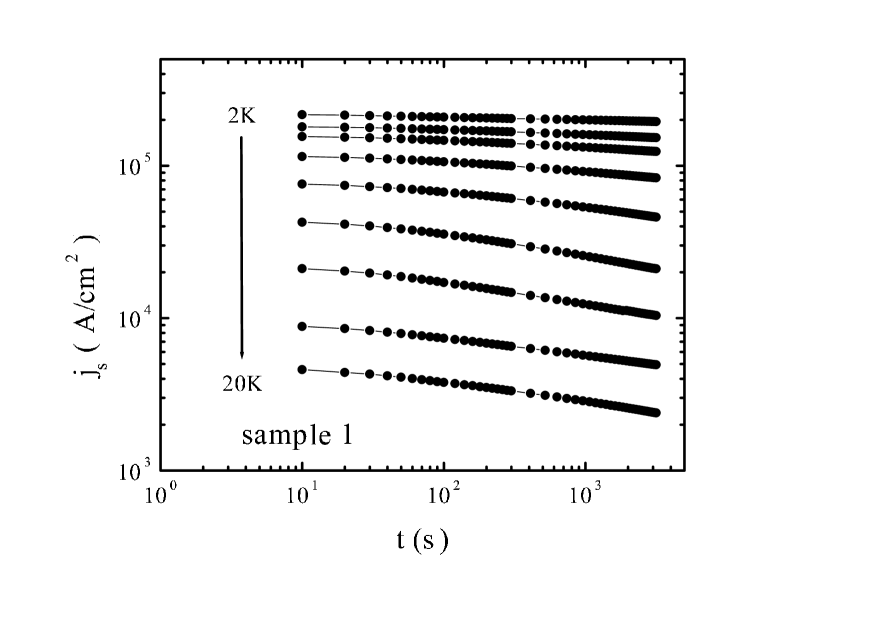
In Fig.3, the time dependence of the superconducting current density of sample 1 at 0.1 T is shown at temperatures ranging from 2 K to 40 K. It is clear that the magnetic relaxation can be described by a double-logarithmic relation in the low temperature region.
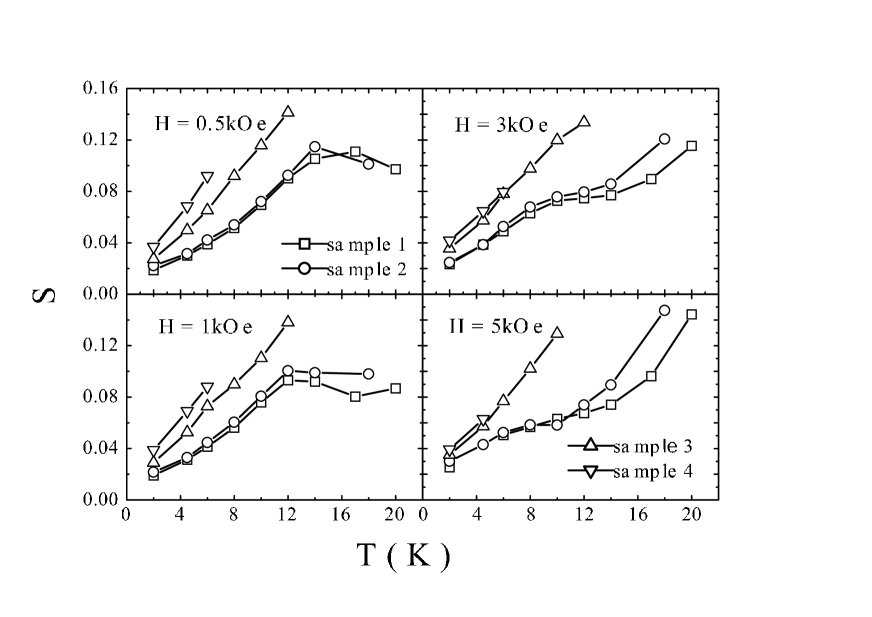
In our experiment, the magnetic relaxation measurements were carried out at the magnetic fields of 0.5k, 1k, 3k to 5k Oe. The conventional relaxation rate is showed in Fig.4. To investigate the influence of doping, the data of four samples is plotted together at the same magnetic field.
According to the Thermally Activated Flux Motion ( TAFM ) model, the flux creep should entirely stop at 0 K. However, there is a residual relaxation rate in the vanishing temperature limit at all fields for all four samples. This is commonly explained by the vortex quantum tunnelling creep[14]. For Bi2212 single crystals, the quantum tunnelling effect is significant below only about 4 K[15].
When the temperature is increased above 4 K, S(T) appears linear with T. This is predicted by the Anderson-Kim Model[16], which assumes a linear activation energy . Actually this model is always valid when is close to the critical current density , since for any kind of relation one can make a Taylor’s expansion with as the variable.
Generally, the linear temperature dependence of S(T) will not exist at higher temperatures. For samples 1 and 2, when the temperature increases up to a higher value, a plateau appears at all of the applied fields. With increasing magnetic fields, the plateau exhibits an interesting evolution. One can see that at fields of 0.5k Oe and 1k Oe, the plateau appears at about 14 K and 10 K and extends to some temperature higher than 20 K. But at higher fields 3k Oe and 5k Oe, the width of the plateau reduces quickly and the onset points move down to 8 K and 6 K. Clearly, at a much higher field, the plateau will disappear completely. This behavior is very similar to what happens in the highly anisotropic Tl2212 film[2]. However, it differs significantly from that in the weakly anisotropic YBCO, where the plateau extends more widely and exists at least up to 7T[17].
For samples 3 and 4, however, no plateau is observed at any field used here. Because of the very low irreversibility lines in these two samples, we are not able to obtain the relaxation rate at higher temperatures due to small signals and rapid relaxation of magnetization. The contrast of the existence and nonexistence of the plateau of relaxation rate S for samples 1, 2 and samples 3, 4 clearly demonstrate a change a vortex dynamics due to the Gd substitution. In the following, we will show that this difference is actually correlated with the dimensional transition of vortex dynamics.
4 Discussion
4.1 Second peak and anisotropy
The second peak has been interpreted with many models, e.g. effect of surface barrier[18], dimensional crossover[19], vortex and defect matching[20]. For the strongly layered superconductor Bi-2212, it has been argued that the SP is originated from a phase transition from a quasi-ordered Bragg glass ( BG ) in low field region to a disordered vortex glass ( VG ) in high field region[21]. This picture has been supported by many experiments[22, 23, 24, 25]. According to this theory, dense disorders will strongly distort the vortex lattice leading to the disappearance of the Bragg glass state. Meanwhile the transition / crossover between a Bragg glass and a vortex glass is predicted for a 3D or quasi-2D vortex system. When the anisotropy is increased, the disappearance of the SP is expected[26].
In our present experiment, the Gd substitution introduces more defects into the samples and also increases the anisotropy. Both will lead to the disappearance of SP. This has been indeed observed in the experiment. However, from present study, it is hard to judge whether the disappearance of SP in the heavily underdoped region is due to the increase of disorders or the vortex system changing from 3D to 2D, or by both.
4.2 The plateau of S-T
The plateau on the curves has been found in a variety of HTSC. Commonly it is ascribed to a nonlinear relationship predicted by the Vortex Glass ( VG )[27] and Collective Pinning ( CP ) models[14, 28]. According to both theories, the activation barrier U depends on the current density as , where is the glassy exponent. This relation naturally explains the divergence of in the small current limit of and predicts a state with zero linear resistivity. Later on, an interpolating expression was proposed by Malozemoff et al.[29]
| (1) |
where is the characteristic pinning energy and is the critical current density. The are dependent on temperature and external field. This relation is rather general in respect that it describes different relations based on various models.
In the conventional magnetic relaxation process, is assumed to be proportional to the electric field E induced by the TAFM
| (2) |
Here is the attempting velocity of the flux motion.
Combining the eq.(1), eq.(2) and the definition of relaxation rate , a simple relation was derived by Wenet al.[30]
| (3) |
where is a parameter independent of T. For four samples studied here, the value of C estimated by Maley’s method is about 10 to 15[2, 31].
From eq.(3), it can be seen that the shape of curve is mainly determined by two terms in the denominator. When is much larger than , the eq.(3) produces the linear temperature dependence. While, if prevails over , this equation will give a result as
| (4) |
If is not strongly dependent on T, this formula predicts that S(T) will have a plateau, just like what appears on the curves of samples 1 and 2.
The ability to explain the plateau in S(T) found from experiment has been regarded as a major success of the VG or CP theory[6]. Now, let us concentrate on the detailed character of the plateau.
(i)The sharp crossover from a linear dependence to a plateau with increasing T. —– From Fig.4, it can be seen that the crossover from a linear dependence to a plateau is rather sudden, especially at lower fields, 0.5k and 1 k Oe. Since a plateau will only appear when exceeds , the sharp transition may manifest that there is a rapid variation of either or . Considering is independent of T as stated above, and is weakly dependent on temperature in the temperature region studied here[2], the only possibility is that rises suddenly at a certain temperature.
In the CP model, is predicted to have different values in various creep regions[14]: it is 1/7 in the single vortex creep region, and with increasing temperature it will become 3/2 in the small bundles creep region and then 7/9 in the large bundles region. From 1/7 to 3/2, the enlarges about 10 times. Such a variation is large enough to result in a sudden rise of relaxation rate. So it is reasonable to regard the crossover from a linear dependence to a plateau as a proof of the vortex dynamics transferring from the single vortex to the small bundles creep region. Furthermore, when the vortex dynamics transfers from the small to large bundle pinning region, will vary between 3/2 and 7/9, which gives rise to a relatively stable value of S, being consistent with the existence of a plateau. Taking and , eq.(4) gives Splateau = 10%, which is near the value found in our experiment. All these analyses above are based on 3D elastic flux dynamics[14]. For 2D in the high field region, the pinning to pancake vortex is weak and it can easily jump out of the pinning wells. The relaxation rate rises quickly with increasing temperature and field. Therefore, there will be no plateau in the curves just like what happens to samples 3 and 4.
(ii) The variation of onset point and width of a plateau with increasing fields.—– One can easily see that the onset point of a plateau moves down to a lower temperature with increasing field. A straightforward explanation is that increasing field will lead to the reduction of , so the crossover to a plateau occurs at a lower temperature (see from eq(3)). It is known that increasing the magnetic field tends to suppress the coupling between superconducting layers. The Gd substitution can also weaken the interlayer coupling. Thus it can be expected that will decrease with more substitution.
In addition, the width of the plateau decreases at higher fields. That indicates that the ending point of a plateau moves down to a lower temperature with increasing field. As soon as the plateau ends at a certain temperature, the S(T) begins to rise quickly toward the irreversibility line. This drastic rise can be understood as due to the plastic vortex creep, which will be discussed in next subsection.
4.3 and plastic creep
The moving vortices in type-II superconductors are under the action of Lorentz force and pinning force. According to the CP theory, to balance the elastic and pinning energy, the collectively pinned vortex ( bundle ) has a length with the collective pinning energy [14]
| (5) |
| (6) |
where is the depairing current density, Lc and Uc are both inversely proportional to the anisotropy .
To determine from relaxation data, we rewrite eq.(3) in the form
| (7) |
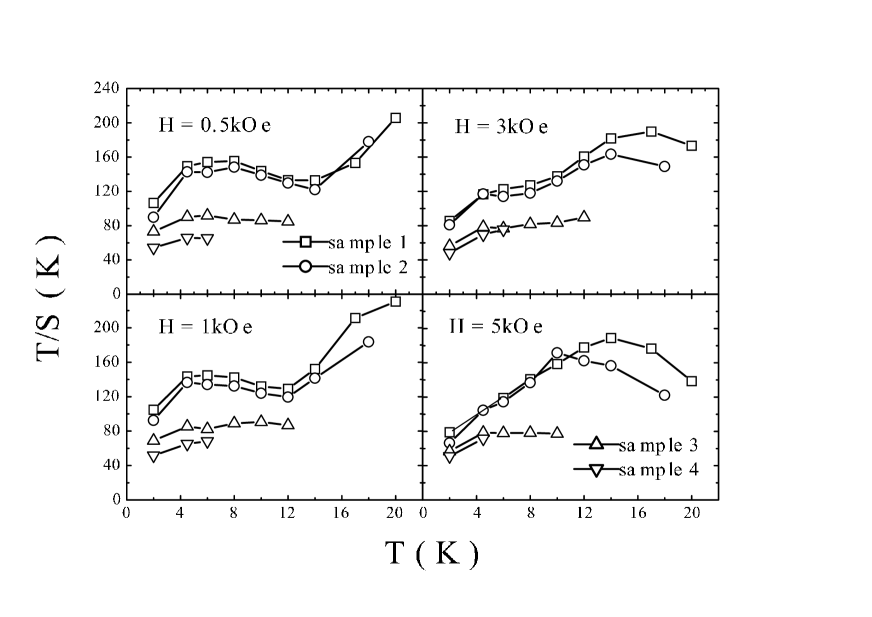
From this equation, one can see that . Since is weakly temperature dependent when in highly anisotropic superconductors[2], we can get the general from the low temperature limit of T/S.
The T/S vs. T curves are showed in Fig.5 with the same arrangement in Fig.4. Due to vortex quantum tunnelling creep, S has a residual value in the vanishing temperature. Thus T/S begins to drop to zero when the quantum effect dominates. This crossover occurs in our samples is at about 4 K. To determine the , we extrapolate the curve from above 4 K to 0 K. Being limited by few data points, we can only obtain some semi-quantitative values of . These data, however, can still show the underlying characters of vortex dynamics induced by the Gd substitution.
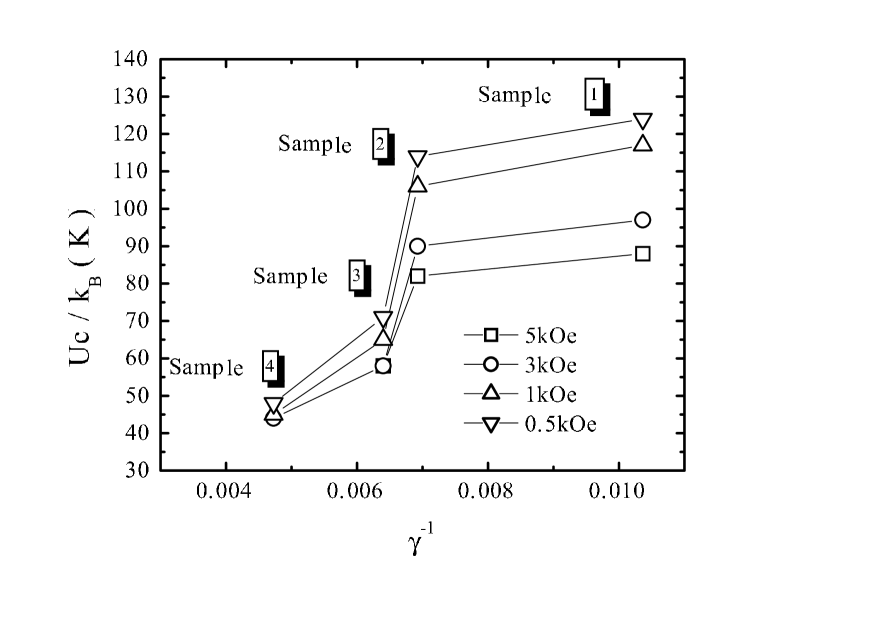
The relation of vs. anisotropy is presented in Fig.6. For samples 1 and 2, it is clear that decreases with increasing field. This accords with the fact that the onset point of a plateau moves down to lower temperatures at higher fields. While, for samples 3 and 4, only weakly depends on magnetic fields, that coincides with 2D character of flux dynamics in these heavily underdoped samples. Another remarkable feature in Fig.6 is that increases with , just as what the CP theory predicts. Also according to the CP, the decrease of with increasing fields and dopants can only be induced by reducing the collective pinning length . So this is another proof that the vortex dynamics in heavily underdoped sample 3 and 4 tends to be 2D.
Besides , from eq.(7) one can also qualitatively determine , at least for its sign. Since the is positive, the will be positive when T/S is larger than and be negative when T/S is less than . For the VG and CP theories, the elastic flux motion is expected and must be positive. For a negative , eq.(1) can be written in the form
| (8) |
where and are both positive. Eq.(8) predicts that will not diverge when approaches zero. This indicates that there is always a finite linear resistivity which is a character of the dislocation mediated plastic motion[2, 32]. It is different from the situation in the elastic flux motion, where is positive and the will diverge when approaches zero.
From Fig.5, no negative was found at all temperatures and fields investigated here. However, the trend of transferring from positive to negative is obvious. For sample 1 and 2, at the fields of 3k and 5k Oe, the T/S begins to decrease quickly after a rise. The crossover corresponds to the ending point of the plateau on S vs T curves. So the fast rising of S after a plateau can be understood as the vortex system entering the region dominated by plastic vortex creep. For samples 3 and 4, T/S is stable and doesn’t drop in the measured narrow temperature range. But, in fact because the irreversibility temperatures of sample 3 and 4 are very low, S will take a fast rise at higher temperatures. Thus it can be expected that T/S of sample 3 and 4 will drop quickly with further increasing temperatures. Therefore, we can conclude that the plastic vortex motion not only tends to occur at high temperatures and high fields for samples 1 and 2 but also should be more pronounced in highly anisotropic systems like samples 3 and 4. In our experiment, it is the Gd substitution that increases the anisotropy and leads to the plastic flux motion.
5 Concluding remarks
In summary, we have investigated the vortex dynamics in a series of Bi2Sr2Ca1-xGdxCu2O8+δ single crystals. By weakening the interlayer coupling and increasing the anisotropy, the Gd substitution has significantly influenced the vortex dynamics of Bi2212. The second peak is only observed near the optimal doping ( samples 1 and 2 ), but in the heavily underdoped region ( samples 3 and 4 ), the increase of disorders and/or anisotropy causes the second peak to disappear. Moreover, with increasing Gd concentration, the plateau of S-T disappears and the collective pinning energy decreases, which indicates that the vortex system changes from 3D to 2D and the vortex tends to creep plastically.
References
- [1] D. S. Fisher, M. P. A. Fisher, and D. A. Huse, Phys. Rev. B 43(1991)130.
- [2] H. H. Wen, A. F. Th. Hoekstra, R. Griessen, S. L. Yan, L. Fang, and M. S. Si, Phys. Rev. Lett. 79(1997)1559; H. H. Wen, H. A. Radovan, F. M. Kamm, P. Ziemann, S. L. Yan, L. Fang, and M. S. Si, Phys. Rev. Lett. 80(1998)3859; H. H. Wen, Z. X. Zhao, S. L. Yan, L. Fang, and M. He, Physica C 312(1999)274.
- [3] Z. Sefrioui, D. Arias, M. Varela, J. E. Villegas, M. A. Lopez de la Torre, C. Leon, and J. Santamaria, Phys. Rev. B 60(1999)15423.
- [4] X. G. Li, X. Zhao, X. J. Fan, X. F. Sun, W. B. Wu, and H. Zhang, App. Phys. Lett. 76(2000)3088.
- [5] X. Zhao, X. F. Sun, L. Wang, Q.F. Zhou, W.B. Wub, X. G. Li, Physica C 336(2000)131.
- [6] Y. Yeshurun, A. P. Malozemoff and A. Shaulov, Rev. Mod. Phys. 68(1996)911.
- [7] M.R. Presland, J.L. Tallon, R. G. Buckley, R. S. Liu, N. E. Flower, Physica C 176(1991)95.
- [8] J. L. Tallon, C. Bernhard, H. Shaked, R. L. Hitterman, and J. D. Jorgensen, Phys. Rev. B 51(1995)12911.
- [9] X. G. Li, X. Sun, W. Wu, Q. Chen, L. Shi, Y. Zhang, Y. Kotaka, and K. Kishio, Physica C 279(1997)241.
- [10] T. Watanabe, T. Fujii, and A. Matsuda, Phys. Rev. Lett. 79(1997)2113.
- [11] G. Villard, D. Pelloquin, and A. Maignan, Phys. Rev. B 58(1998)15231.
- [12] T. Higuchi, S. I. Yoo, and M. Murakami, Phys. Rev. B 59(1999)1514; E. M. Gyorgy, R. B. van Dover, K. A. Jackson, L. F. Schneemeyer, and V. Waszcazk, App. Phys. Lett. 55(1989)283.
- [13] C. P. Bean, Rev. Mod. Phys. 36(1964)31.
- [14] G. Blatter, M. V. Feigel’man, V. B. Geshkenbein, A. I. Larkin, and V. M. Vinokur, Rev. Mod. Phys. 66(1994)1125.
- [15] D. Monier and L. Fruchter, Phys. Rev. B 58(1998)R8917
- [16] P. W. Anderson and Y. B. Kim, Rev. Mod. Phys. 36(1964)39.
- [17] A. P. Malozemoff and M. P. A. Fisher, Phys. Rev. B 42(1990)6784
- [18] N. Kopylov, A. E. Koshelev, and I. F. Schegolev, Physica C 170(1990) 291.
- [19] V. M. Vinokur, P. H. Kes, and A. E. Koshelev, Physica C 168(1990)29.
- [20] G. Yang, P. Shang, S. D. Sutton, I. P. Jones, J. S. Abell, and C. E. Gough, Phys. Rev. B 48(1993)4054.
- [21] T. Giamarchi and P. Le Doussal, Phys. Rev. B 55(1997)6577; Phys. Rev. Lett. 72(1994)1530.
- [22] R. Cubitt, E. M. Forǵan, G. Yang, S. L. Lee, D.McK. Paul, H. A. Mook, M. Yethiraj, P. H. Kes, T. W. Li, A. A. Menovsky, Z. Tarnawski, and K. Mortensen, Nature 365(1993)407.
- [23] B. Khaykovich, M. Konczykowski, Z. Zeldov, R. A. Doyle, D. Majer, P. H. Kes, and T. W. Li, Phys. Rev. Lett. 76(1996)2555; Phys. Rev. B 56(1997)R517.
- [24] C. J. van der Beek, S. Colson, M. V. Indenbom, and M. Konczykowski, Phys. Rev. Lett. 84(2000)4196.
- [25] M. B. Gaifullin, Yuji Matsuda, N. Chikumoto, J. Shimoyama, and K. Kishio, Phys. Rev. Lett. 84(2000)2945.
- [26] C. Zeng, P. L. Leath, and D. S. Fisher, Phys. Rev. Lett. 82(1999)1935.
- [27] M. P. A. Fisher, Phys. Rev. Lett. 62(1989)1415
- [28] M. V. Feigel’man, V. B. Geshkenbein, A. I. Larkin, and V. M. Vinokur, Phys. Rev. Lett. 63(1989)2303; M. V. Feigel’man and V. M. Vinokur, Phys. Rev. B 41(1990)8986.
- [29] A. P. Malozemoff, Physica C 185-189(1991)264.
- [30] H. H. Wen, H.G. Schnack, R. Griessen, B. Dam, J. Rector, Physica C 241(1995)353.
- [31] M. P. Maley, J. O. Willis, H. Lessure and M. E. McHenry, Phys. Rev. B 42(1990)2639.
- [32] C. J. van der Beek and P. H. Kes, Phys. Rev. B 43(1991)13032; Y. Abulafia, A. Shaulov, Y. Wolfus, R. Prozorov, L. Burlachkov, and Y. Yeshurun, D. Majer and E. Zeldov, H. Wuhl,V. B. Geshkenbei, and V. M. Vinokur, Phys. Rev. Lett. 77(1996)1596.