address=Physics Department, Lehigh University, Bethlehem, PA 18015
Condensation and Slow Dynamics of Polar Nanoregions in Lead Relaxors
Abstract
It is now well established that the unique properties of relaxor ferroelectrics are due to the presence of polar nanoregions (PNR’s). We present recent results from Neutron and Raman scattering of single crystals of PZN, PZN-PT, and PMN. Both sets of measurements provide information on the condensation of the PNR’s and on their slow dynamics, directly through the Central Peak and, indirectly, through their coupling to transverse phonons. A comparative analysis of these results allows identification of three stages in the evolution of the PNR’s with decreasing temperature: a purely dynamic stage, a quasi-static stage with reorientational motion and a frozen stage. A model is proposed, based on a prior study of KTN, which explains the special behavior of the transverse phonons (TO and TA) in terms of their mutual coupling through the rotations of the PNR’s.
0.1 Introduction
For many years, relaxor materials (mostly, lead-based Pb(R1/3Nb2/3)O3, where R = Mg2+ or Zn2+ PMN and PZN respectively), have been a focus of research in the ferroelectrics community. Growing attention has been given to their industrially-promising solid solutions with PbTiO3 (PT) Kuwata-etal:1981 ; Shrout-etal:1990 ; Park-etal:1997 , especially at concentrations near the morphotropic phase boundary (MPB), where their remarkable piezoelectric and electrostrictive properties are enhanced Park-etal:1997 ; Liu-etal:1999 ; Viehland-etal:2001 . However, the fundamental origin of these properties remains a puzzle, and the development of their low-temperature state is still not well understood.
The difficulties in understanding originate from the high complexity of these materials, characterized by chemical, compositional and orientational disorder that coexists with the presence of short-range order Yokomizo-etal:1970 ; Randall-Bhalla:1990 . As relaxors are cooled from high temperature, the major structural changes are preceded by the nucleation of polar nanoregions (PNR’s) Viehland-etal:1992 ; Burns-Dacol:1983 . These PNR’s are the consequence of ion off-centering which is commom in many perovskites. By analogy with KTa1-xNbxO3 (KTN) at sufficient Nb concentrations Svitelskiy-Toulouse:2003 , one could expect that their development would lead to the appearance of a long-range order. However, unlike KTN where Nb5+ is the only off-centered positive ion, lead relaxors present a much more difficult case Bonneau-etal:1991 ; Mathan-etal:1991 ; Verbaere-etal:1992 ; Uesu-etal:1996 ; Vakhrushev-etal:1994 ; Iwase-etal:1999 ; Matsushima-etal:2000 . It is often assumedHusson-etal:1990 ; Egami-etal:1998 ; Chen:2000 ; Blink-etal:2001 that Nb5+, due to its position in the cell and small radius, acts as the main ferroelectric agent. But, the PNR’s in the lead compounds, develop in the presence of random fields, that prevent the formation of long-range order Blink-etal:2001 ; Krainik-etal:1971 . The frustrating effects of these fields can be compensated by an electric field applied in a direction Ye-Schmid:1993 ; Mulvihill-etal:1997 .
The complexity of the lead relaxor materials has resulted in the co-existence of several mutually-excluding interpretations of its light scattering spectrum (for review see Svitelskiy-Toulouse:2003 ; Siny-Rev ). Not only is the phonon assignment of particular lines in question, but also the very existence of first-order light scattering in a cubic crystal remains unaccounted. The absence of a Raman analogy to the ”waterfall” phenomenonGehring-etal:2001 ; Wakimoto-etal:2002 ; Naberezhnov-etal:1999 ; Koo-etal:2002 is also puzzling. First-principle calculations of the lattice modesProsandeev , can be very helpful in answering these questions.
In order to shed some light on the development of the low-temperature phase and to resolve the above mentioned contradictions, we decided to carry out a detailed study of the relaxor behavior in PZN, PZN-PT ( = 4.5 and 9%), and PMN single crystals (for growth technology see Zhang-etal:2000 ; Chen-etal:2001 ; Ye-etal:1990 ) using neutron and light scattering spectroscopy. The purpose of this article is to present a brief summary of the work completed La-Orauttapong-etal:2001 ; La-Orauttapong-etal:2003 ; Svitelskiy-etal:2003 ; Svitelskiy-Toulouse:2003 .
0.2 Neutron scattering studies and their results
The neutron scattering experiments were carried out on BT9, HB-1, and 4F-2 triple-axis spectrometers at the NIST Center for Neutron Research (NCNR), at the High Flux Isotope Reactor (HFIR) of Oak Ridge National Laboratory, and at the Orphée reactor of the Laboratoire Léon Brillouin (LLB), respectively. The spectrometer was operated in the final neutron energy fixed at 14.7 meV ( Å) at NCNR, at 13.6 meV ( Å) at HFIR, and in the final neutron wavevector fixed with either at 1.97 Å-1 (8.04 meV, = 3.19 Å) or at 1.64 Å-1 (5.57 meV, =3.83 Å) at LLB. The (002) reflection of a highly oriented pyrolytic graphite (HOPG) crystal was used to monochromate and analyze the incident and scattered neutron beams. To suppress contamination by higher order neutrons, a HOPG filter was installed in the scattered beam. The crystal was mounted onto an aluminum sample holder or a boron nitride and oriented with either in the [100]-[011] or [100]-[010] scattering planes.
Constant- scans were used to collect data by holding the momentum transfer = - fixed, while scanning the energy transfer = . Using this scan, the central peak (=0) (CP) and the transverse acoustic (TA) phonon mode were obtained upon cooling.
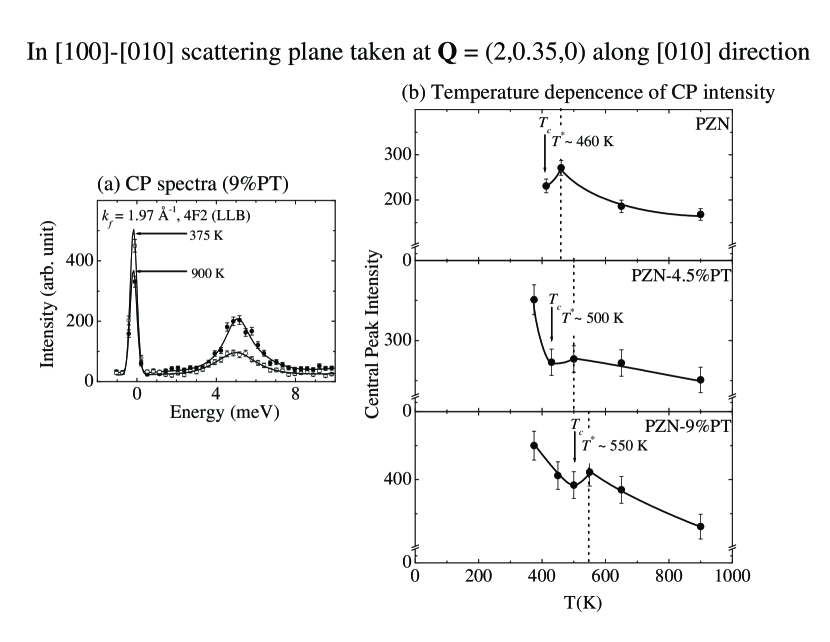
The central peak is a consequence of the relaxational motion in the crystal. So when this motion is fast, the CP is broad and its intensity is small. With decreasing temperature, the life time of the clusters increases and their reorientational motion is slowing down. This should lead to the growth of the central peak as shown in Fig. 1 (a). This figure show the CP spectra are shown taken at = (2,0.35,0) at 900 K and 375 K (, where is the momentum transfer relative to the = (2,0,0) Bragg point, measured along the [010] symmetry direction). The CP spectra (solid lines) were fitted to a delta function.
The temperature dependencies of the CP intensity of PZN, 4.5%, and 9%PT at = (2,0.35,0) are presented in Fig. 1 (b). The CP intensity initially increases with decreasing temperature until , and goes through a minimum at the transition before increasing at lower temperatures. Since the central peak is attributed to the relaxation of the precursor ferroelectric clustersBruce-Cowley:1981 ; MichelA , the presence of a maximum provides supportive evidence for a temperature at which the polar regions start to condense. The condensation temperatures (PZN : K, 4.5%PT : K, and 9%PT : K) found are in agreement with our previous neutron elastic diffuse scattering studies La-Orauttapong-etal:2001 ; La-Orauttapong-etal:2003 . It is important to note that, with addition of PT, the PNR’s condense at a higher temperature above the transition than in pure PZN . This fact is due to stronger correlations between the PNR’s in the presence of PT.
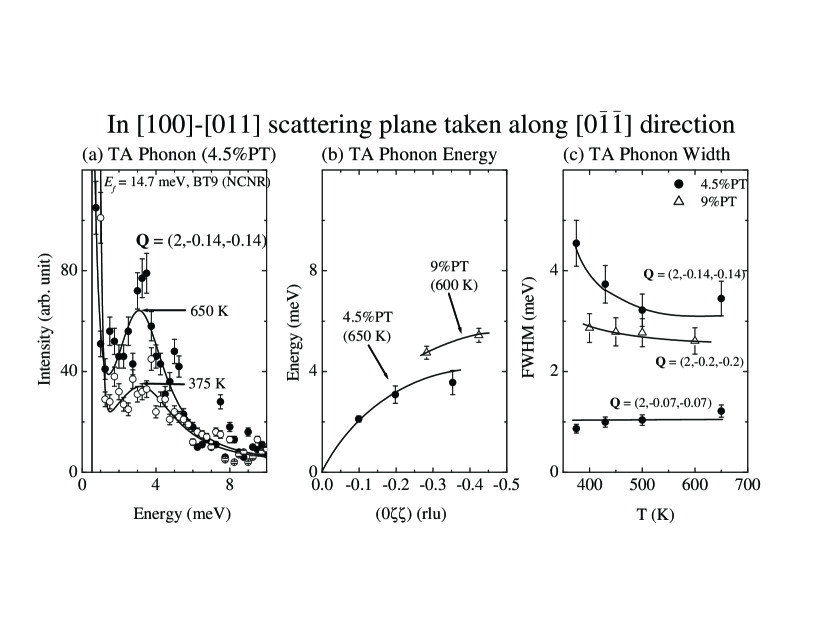
When investigating the polarization dynamics of relaxors, it is also important to examine the TA phonons, since these should couple to the reorientation of the localized strain fields that are known to accompany the polar regions Rowe-etal:1979 . One might expect to observe increased damping of the TA phonons when the polar regions condense. In Fig. 2 (a) we show the TA phonon spectra of 4.5%PT crystal measured at the scattering vector = (2,-0.14,-0.14) (or 0.20 rlu)1111 reciprocal lattice unit (rlu) along [0] = rlu = ( = 2.19 Å-1, where 4.05 Å. at 650 K and 375 K. The TA spectra (solid lines) were fitted to a Lorentzian function. These profiles suggest that the TA mode damping increases with decreasing temperature. The peak position () of the scattered neutron intensity as a function of is shown in Fig. 2 (b). This figure shows that the frequency of the TA phonon in 9%PT is higher than in 4.5%PT. However, the width or damping of the phonon is smaller for the 9%PT than for the 4.5%PT one as shown in Fig. 2 (c). This observation suggests that with increasing PT concentration, the TA damping decreases but the TA phonon frequency increases.
Our measurements of PZN-PT, the TA phonon damping is seen to increase, starting at temperatures far above the transition, at a large first and at a smaller later with decreasing temperature. In other words, we find that, at a given temperature, the larger the , the higher the damping. In fact, we do expect such a trend from the coupling to smaller polar regions at higher temperatures and to larger and slower ones at lower temperatures. As seen from Fig. 2 (c) for 4.5%PT, the phonon damping begins to increase at 500 K (or ) and = (2,-0.14,-0.14) (or 0.20 rlu), which corresponds to about 5 unit cells (). This result is consistent with the size of the polar regions derived from our neutron elastic diffuse scattering data La-Orauttapong-etal:2003 . Such an agreement provides evidence that the increase in TA phonon damping is connected to the appearance of the polar regions. In 9%PT, the TA phonon damping is significant lower than in 4.5%PT but shows a similar trend. It is important to note that the measured TA phonon corresponds to the C44 elastic modulus, which can couple to the reorientations of a strain field with rhombohedral symmetry between different [111] directions. The higher frequency of the TA phonon in 9%PT than in 4.5%PT indicates that C44 is higher in 9%PT. Both observations, lower damping and higher TA phonon frequency, suggest that, with increasing PT, the polar regions are less able to reorient and the lattice becomes more rigid. In PMN and PMN-20%PTNaberezhnov-etal:1999 ; Koo-etal:2002 , the TA phonon starts to broaden at at temperatures far above the transition or near the wavevector, , at which the TO phonon has been reported to disappear (“waterfall”) Gehring-etal:2001 ; Wakimoto-etal:2002 .
0.3 Raman scattering studies and their results
We have investigated several lead ferroelectric relaxor crystals. In this paper we briefly report on the results obtained on PMN 100-cut single crystalline sample (for details see Svitelskiy-etal:2003 ). Such a sample represents the simplest case and may serve as a model.
The scattering was excited by propagating in a direction, 514.5 nm light from a 200 mW Ar+-ion laser, focused to a 0.1 mm spot. The scattered light was collected at an angle of 90∘ with respect to the incident beam (i.e., in direction) by a double-grating spectrometer. For most of the measurements, the slits were opened to 1.7 cm-1. However, in order to acquire more precise data in the central peak region, at temperatures close to the maximum of the dielectric constant ( K), the slits were narrowed to 0.5 cm-1. Each polarization of the scattered light, (VV) and (VH), was measured separately. In order to exclude differences in sensitivity of the monochromator to different polarizations of the light, a circular polarizer was used in front of the entrance slit. For control purposes, we also took measurements without polarization analysis. Finally, to protect the photomultiplier from the strong Raleigh scattering, the spectral region from -4 to +4 cm-1 was excluded from the scans. The data were collected in the temperature range from 1000 to 100 K. The cooling rate was 0.5-1 K/min. Every 50-20 K the temperature was stabilized and the spectrum recorded.
The measured spectra were consistent with those from Refs.husson and ohwa and shown in Svitelskiy-etal:2003 . In the high temperature region, a typical spectrum consists of two strong lines centered approximately at 45 cm-1 and 780 cm-1 and of three broad bands between them. The line at 45 cm-1 exhibits a triplet structure. Lowering temperature leads to the splitting of the broad bands into a number of narrower lines and to the appearance of new lines.
To analyze the data, we decomposed the measured spectra using a multiple peak fitting procedure. Satisfactory fits could be achieved with the assumption that the central peak has a Lorentzian shape and that each of the other peaks is described by the spectral response function of damped harmonic oscillator, modified by a population factor:
| (1) |
where and are the damping constant and the mode frequency and the Bose population factor is given by:
| (2) |
where
As all of the peaks are much better resolved at low temperatures, the fitting procedure was started at the low-temperature end of the data set (at 110 K) and, the evolution of the peaks was then followed with increasing temperature (i.e., in the opposite order of the measurements). At the same time, the number of peaks necessary to achieve a reasonably good fit was minimized. The control data set (measured without polarization analysis) was used to calibrate the positions and widths of the weak and poorly resolved peaks from the VV and VH data sets. Since a large number of parameters is involved, the results of a particular fit may depend on their initial values. To stabilize the results, the best-fit values of the parameters obtained at one temperature were used as initial values for the fit at the next temperature. In this manner, several sets of fits were obtained and analyzed. It is remarkable that, in all of them, the major parameters showed the same trends. Below, we show the most interesting results obtained from the analysis of the central peak and tripet line located at 45 cm-1. For clarity, we describe the observed phenomena from high to low temperatures, following the same order as in measurements (unless stated otherwise).
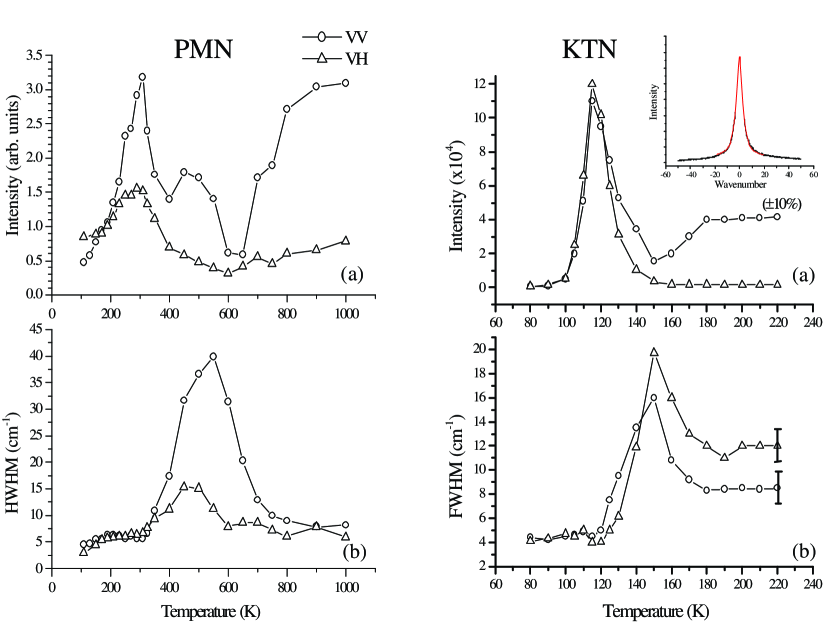
The temperature dependencies of the fitting parameters for the central peak in the PMN crystal (CP) are presented in Fig. 3 (left-hand side). Circles correspond to the VV and triangles to the VH component of the peak. The existence of the CP is a direct consequence of the lattice fluctuation relaxations, which are very sensitive to the restrictions imposed by the low-symmetry clusters. If the relaxations are fast MichelA , the CP is low-intense and broad, whereas their slowing causes growth and narrowing of the peak.
We should point out a striking similarity of the temperature behavior of the CP in PbMg1/3Nb2/3O3 (Fig. 3 (left-hand side)) and in KTa0.85Nb0.15O3 (right-hand side) crystals. We have shownSvitelskiy-Toulouse:2003 that the temperature behavior of the CP in KTN can be explained by a model involving the collective relaxational motion of off-centered Nb ions and its progressive restriction with decreasing temperature. In the cubic phase, Nb ions are allowed to reorient amongst eight equivalent 111 directions. The appearance of the PNR’s, followed by a sequence of phase transitions down to a rhombohedral phase, limits the ion motion to four, two and, finally, locks it in only one site. This model is in agreement with the neutron scattering studies of similar systems grace . The similarity of the CP behavior in PMN and KTN, suggests that the temperature evolution of the polar clusters in PbMg1/3Nb2/3O3 passes through similar stages as those in KTa0.85Nb0.15O3 (KTN). However, it is not accompanied by the appearance of long-range order.
Starting from high temperature, the first important feature is the strong and narrow scattering in the VV geometry, accompanied by relatively weak scattering in the VH geometry. This indicates the presence of a symmetric slow relaxational motion, most likely involving 180o reorientations of ions. Starting from K, the cessation of this motion causes a decrease in intensity of the CP, which reaches a minimum near the Burns temperature K. The prohibition of 180o reorientations indicates the loss of inversion symmetry in the lattice, caused by onset the distinguishability between Mg and Nb occupied sites and the formation, in the 1:1 ordered areas, of a superstructure with average symmetry harmer ; boulesteix . It also imposes the first restrictions on the reorientational motion of the dynamical polar nanoregions. Now, they can reorient only amongst four neighboring 111 directions, forming, on average, tetragonal-like distortions. These processes are accompanied by the appearance of large (of the order of wavelength of light) dynamic fluctuations that cause worsening of the optical quality of the sample (which is also reflected on the whole spectrum Svitelskiy-etal:2003 ).
With further decrease of the temperature, the optical quality of the crystal improves again. Below K, the four-site reorientational motion of the PNR’s slows down, which is marked by the narrowing of the VV component of the CP and the increase of its VV and VH intensities. Simultaneously, the VH component broadens and reaches a maximum at K. This indicates rearrangements in the crystalline structure leading to the appearance of new restrictions on the ion motion. The analogy with KTN suggests that, below K, the motion of the clusters becomes restricted to two neigboring 111 orientations, giving an average monoclinic-like distortion. Such a rearrangement causes some decrease in intensity of the VV component (with minimum at K), while the VH intensity keeps growing. Below K, the slowing down of the two-site relaxational motion causes a narrowing of the CP and an increase in the intensities of both components. Below K, these effects become especially dramatic. Further decreasing the temperature below K, leads to the complete prohibition of intersite reorientational motion of the clusters, i.e. to appearance of static clusters. This is marked by a sharp decrease in intensity of both components of the CP. At K (which is the temperature of an electric field-induced phase transition), the freezing process of the PNR’s from dynamic to static is complete. Below this temperature, the central peak is narrow and its intensity is small in both scattering geometries.
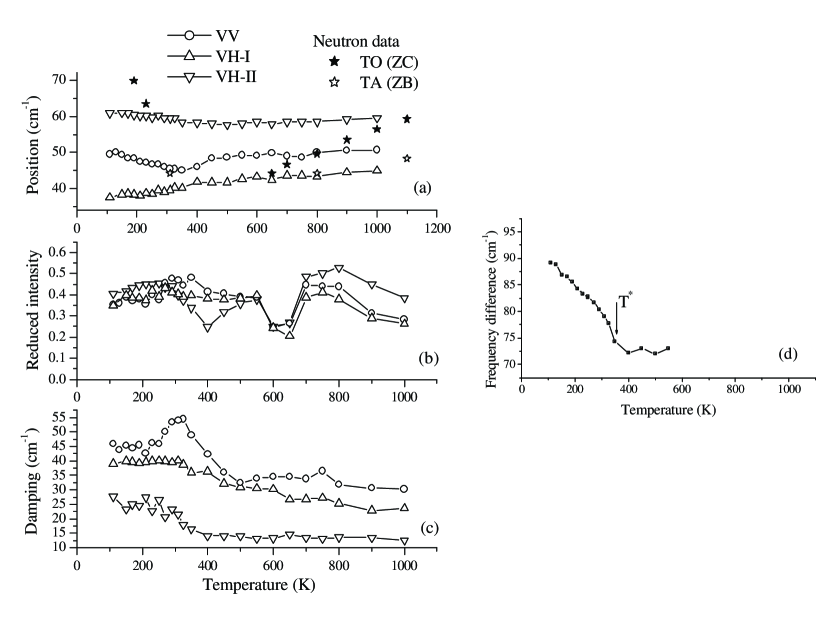
(d): Magnitude of splitting between components of the broad band located at 500-600 cm-1.
Figure 4(a-c) presents the temperature evolution of the fitting parameters for the peak located at 45 cm-1, showing its position (a), reduced intensity (b) and damping constant (c). This peak has a triplet structure, containing one component in VV (circles) and two components in VH (up and down triangles) geometries. The fitting parameters for this peak exhibit changes at the above mentioned temperatures , and , confirming their significance in the structural evolution of the crystal. However, the origin of this peak (see Table I in Ref. Svitelskiy-etal:2003 ) requires clarification. From a comparison with the frequencies of the phonon modes measured by neutron spectroscopy, it is clear that this peak cannot be due to the zone center soft TO1 mode (black stars in Fig. 4). On the other hand, the lower frequency VH component, and possibly the VV component could be due to disorder-induced scattering TA phonon from the zone boundary (white stars in Fig. 4). However, the higher frequency VH component would still not be accounted for.
In an attempt to account for both VH components simultaneously, we have tried to make use of a coupled oscillator model Svitelskiy-etal:2003 . Results of the fit confirmed the importance of coupling processes in the formation of this line. These processes, however, occur without a significant contribution from the zone center TO1 phonons, but more likely under the influence of the zone boundary TA phonons, with different polarizations propagating in different directions Prosandeev . Interaction between such phonons is possible if mediated by relaxational motion of the polar nanoregions.
The importance of the temperature is emphasized by the temperature dependence of the splitting between components of the band located at 500-600 cm-1 (Fig.4(d)), which is analogous to the one observed in KTN. The work to explain this phenomenon is currently in progress.
0.4 Conclusions
By means of neutron and light scattering spectroscopy, we have carried out an investigation of the development of the low temperature phase in relaxor ferroelectric materials (PZN-PT and PMN). Our results show that the formation of this phase is preceded by appearance of the precursor clusters. These clusters nucleate at very high (several hundred degrees higher than the maximum of the dielectric constant) temperatures as highly dynamic objects. With lowering of the temperature, their motion becomes progressively more restricted, starting from Burns temperature . The appearance of the static polar regions is marked by the temperature . Finally, the reorientational motion freezes out. The process of slowing down is strikingly similar to the one in KTN. However, in the case of lead relaxors, due to the presence of frustrating fields, it does not result in the establishment of the long-range order. Phonon-related peaks appear in the light scattering spectrum, due to the coupling between phonons of different polarizations, mediated by the relaxational motion of the PNR’s.
0.5 Acknowledgements
This research has been supported by DOE under Contract No. DE-FG02-00ER45842 and by ONR under Grant No. N00014-99-1-0738 (Z.-G. Ye).
References
- (1) J. Kuwata, K. Uchino, and S. Nomura, Ferroelectrics 37, 579 (1981).
- (2) T. Shrout, Z.P. Chang, N. Kim, and S. Markgraf, Ferroelectric Letters, 12, 63 (1990).
- (3) S.-E. Park and T.R. Shrout, J. Appl. Phys. 82, 1804 (1997).
- (4) S-F. Liu, S-E. Park, T.R. Shrout, and L.E. Cross, J. Appl. Phys. 85, 2810 (1999).
- (5) D. Viehland, A. Amin, and J. F. Li, Appl. Phys. Lett. 79, 1006 (2001).
- (6) Y. Yokomizo, T. Takahashi, and S. Nomura, J. Phys. Soc. Jpn. 28, 1278 (1970).
- (7) C.A. Randall and A.S. Bhalla, Jpn. J. Appl. Phys. Part 1 29, 327 (1990).
- (8) D. Viehland, S.J. Jang, L.E. Cross, and M. Wuttig, Phys. Rev. B 46, 8003 (1992).
- (9) G. Burns and F.H. Dacol, Solid State Commun. 48, 853 (1983) and Phys. Rev. B 28, 2527 (1983).
- (10) O. Svitelskiy and J. Toulouse, J. Phys. Chem. Solids 64, 665 (2003).
- (11) P. Bonneau, P. Garnier, G. Calvarin, E. Husson, J. R. Gavarri, A. W. Hewat, and A. Morell, J. Solid State Chem. 91, 350 (1991).
- (12) N. de Mathan, E. Husson, G. Calvarin, J.R. Gavarri, A.W. Hewat, and A. Morell, J. Phys.: Condens. Matter 3, 8159 (1991).
- (13) A. Verbaere, Y. Piffard, Z.-G. Ye, and E. Husson, Mat. Res. Bull. 27, 1227 (1992).
- (14) Y. Uesu, H. Tazawa, K. Fujishiro, and Y. Yamada, J. Korean Phys. Soc. 29, S703 (1996).
- (15) S. Vakhrushev, S. Zhukov, G. Fetisov, and V. Chernyshov, J. Phys.: Condens. Matter 6, 4021 (1994).
- (16) T. Iwase, H. Tazawa, K. Fujishiro, Y. Uesu, and Y. Yamada, J. Phys. Chem. Solids 60, 1419 (1999).
- (17) Y. Matsushima, N. Ishizawa, N. Wakiya, and N. Mizutani, J. Ceram. Soc. Jpn. 108, 617 (2000).
- (18) E. Husson, L. Abello, and A. Morell, Mat. Res. Bull. 25, 539 (1990).
- (19) T. Egami, W. Dmowski, M. Akbas, and P.K. Davies, First Principles Calculations for Ferroelectrics, ed. by R.E. Cohen, Fifth Williamsburg Workshop, Williamsburg, VA February 1998, AIP Conf. Proc. 436, p.1 (1998).
- (20) I.W. Chen, J. Phys. Chem. Solids 61, 197 (2000).
- (21) R. Blinc, A. Gregorovic, B. Zalar, R. Pirc, V.V. Laguta, M.D. Glinchuk, Phys. Rev. B 63, 024104 (2001).
- (22) N. N. Krainik, L. S. Gokhberg, and I. E. Myl′nikova, Sov. Phys. -Solid State 12, 1885 (1971).
- (23) Z.-G. Ye and H. Schmid, Ferroelectrics 145, 83 (1993).
- (24) M. L. Mulvihill, L. E. Cross, W. Cao, and K. Uchino, J. Am. Ceram. Soc. 80, 1462 (1997).
- (25) I.G.Siny, S.G.Lushnikov, R.S.Katiar, V.H.Schmidt, Ferroelectrics, 226, 191 (1999).
- (26) P. M. Gehring, S. Wakimoto, Z.-G. Ye, and G. Shirane, Phys. Rev. Lett. 87, 277601 (2001).
- (27) S. Wakimoto, C. Stock, Z.-G. Ye, W. Chen, P.M.Gehring, and G.Shirane, Phys. Rev. B 66, 224102 (2002).
- (28) A.Naberezhnov, S.Vakhrushev, B.Dorner, D.Strauch, and H.Moudden, Eur.Phys.J. B 11, 13 (1999).
- (29) T.-Y. Koo, P.M. Gehring, G. Shirane, V. Kiryukhin, G. Lee, and S.-W. Cheong, Phys. Rev. B 65, 144113 (2002).
- (30) S.A. Prosandeev, Eric Cockayne and B.P.Burton, First principles calculations of lattice dynamics in some PMN supercells, This Proceedings.
- (31) L. Zhang, M.Dong and Z.-G. Ye, Mater. Sci. Eng. B 78, 96 (2000).
- (32) W. Chen and Z.-G. Ye, J. Mater. Sci. 36, 4393 (2001).
- (33) Z.-G. Ye, P. Tissot, and H. Schmid, Mater. Res. Bull., 25, 739 (1990).
- (34) D. La-Orauttapong, J. Toulouse, J.L. Robertson, and Z.-G. Ye, Phys. Rev. B. 64, 212101 (2001).
- (35) D. La-Orauttapong et al., e-print: cond-mat/0209420.
- (36) O. Svitelskiy et al., e-print: cond-mat/0301501.
- (37) A.D. Bruce and R.A. Cowley, Structural Phase Transitions (Taylor and Francis, London, 1981).
- (38) K.H.Michel, J.Naudts, B.De Raedt. Phys. Rev. B, 18, 648 (1978).
- (39) J. M. Rowe, J. J. Rush, D. G. Hinks, and S. Susman, Phys. Rev. Lett. 43, 1158 (1979).
- (40) E.Husson, L.Abello, A.Morell, Mat. Res. Bull., 25, 539 (1990).
- (41) H.Ohwa, M.Iwata, N.Yasuda, Y.Ishibashi, Ferroelectrics, 229, 147 (1999); 218, 53 (1998).
- (42) G.Yong, J.Toulouse, R.Erwin, S.M.Shapiro, B.Hennion, Phys.Rev. B 62 (2000) 14736.
- (43) J.Chen, H.M.Chan, M.P.Harmer, J. Am. Ceram. Soc., 72, 593 (1989).
- (44) C.Boulesteix, V.Varnier, A.Llebaria, E.Husson, J. Sol. State Chem., 108, 141 (1994).
- (45) P.M.Gehring, S.B.Vakhrushev, G.Shirane, AIP Conf. Proc. Fundamental Physics of Ferroelectrics 2000. Aspen. Winter Workshop, 314 (2000).