(submitted to Phys. Rev. B)
Composition and structure of the RuO2(110) surface in an
O2 and CO environment: implications for the catalytic formation of CO2
Abstract
The phase diagram of surface structures for the model catalyst RuO2(110) in contact with a gas environment of O2 and CO is calculated by density-functional theory and atomistic thermodynamics. Adsorption of the reactants is found to depend crucially on temperature and partial pressures in the gas phase. Assuming that a catalyst surface under steady-state operation conditions is close to a constrained thermodynamic equilibrium, we are able to rationalize a number of experimental findings on the CO oxidation over RuO2(110). We also calculated reaction pathways and energy barriers. Based on the various results the importance of phase coexistence conditions is emphasized as these will lead to an enhanced dynamics at the catalyst surface. Such conditions may actuate an additional, kinetically controlled reaction mechanism on RuO2(110).
pacs:
PACS: 82.65.Mq, 68.35.Md, 68.43.BcI Introduction
A prerequisite for analyzing and understanding the electronic properties and the function of surfaces, is the detailed knowledge of the atomic structure, i.e., the surface composition and geometry. In this respect the experimental techniques of ultra-high vacuum (UHV) Surface Science have significantly helped to build our current understanding,masel96 and sometimes these UHV results can be related to high-pressure applications, like catalysis or corrosion. Often, however, such extrapolation is not straightforward and may even be impossible.stampfl02 This is due to the fact, that some surface structures that can be stabilized in UHV - sometimes by sophisticated preparation, annealing, and post-dosing procedures - may not exist at high temperature, , and high pressure, . And structures that exist at high pressure may be hard or even impossible to identify or stabilize under UHV conditions. Obviously, knowing what structures dominate the high-pressure application one is interested in, is crucial for finding a way to prepare the same or a similar situation under UHV conditions, in order to then perform controlled, atomistic experiments. Thus, the determination of a () phase diagram, covering the surface phases from UHV to realistic conditions appears to be critical for a meaningful and safe bridging of the pressure gap, enabling a Surface Science study relevant to the high-pressure problem.
The concept of first-principles atomistic thermodynamics weinert86 ; scheffler88 ; kaxiras87 ; qian88 enables us to calculate such surface phase diagrams, and for metal oxides this approach has recently proven to be most valuable (see for example Refs. wang98, ; wang00, ; reuter02a, ; reuter03, ). Using density-functional theory, one calculates the free energies of all plausible surface compositions and geometries, in order to identify the lowest-energy structure for a given condition of the thermodynamic reservoirs for the atoms and electrons. In Ref. reuter02a, we described the approach in detail for a one-component gas phase, and we now extend it to a multi-component environment also employing the concept of a “constrained thermodynamic equilibrium”; at the end we will also analyze (and emphasize) the role of kinetic effects. A short paper on this study already appeared.reuter03
We believe that the below discussion is relevant to oxidation catalysis at a ruthenium catalyst, but the applicability of the methodology is much wider. From the calculated surface phase diagram, a number of conclusions on the experimentally reported high efficiency of this oxide surface cant78 ; peden86 ; boettcher97 ; boettcher99 ; over00 ; kim01b ; fan01 ; wang01 ; wang02 can already be drawn. Most notably, we emphasize that gas phase conditions, that correspond to a coexistence of different surface phases, may lead to an enhanced dynamics and be particularly important for catalytic applications. For the specific example of the RuO2(110) surface we find that such phase coexistence conditions at high partial pressures enable a reaction mechanism, that does not play a role otherwise. Interestingly, the energy barrier is found to be even lower than that of other mechanisms considered so far.over00 ; liu01
II Theory
Our approach connects density-functional theory (DFT) total-energy calculations and atomistic thermodynamics. weinert86 ; scheffler88 ; kaxiras87 ; qian88 In a preceding publication the procedure was described for an oxide surface in equilibrium with a one-component gas phase reuter02a . We will therefore recapitulate it here only briefly, concentrating now on the extension to a multi-component gas phase and a “constrained thermodynamic equilibrium”. For clarity we will stick to the specific example of a RuO2(110) surface in contact with a gas phase environment formed of O2 and CO. The generalization to other surfaces in contact with arbitrary multi-component gas or even liquid phases is straightforward.
II.1 Surface free energy
For a surface in equilibrium with atomic reservoirs (defined by a gas or liquid phase environment, or a macroscopic bulk phase), the most relevant structures are characterized by a low surface free energy, which is defined as
| (1) |
Here, is the Gibbs free energy of the solid with the surface we like to study. If a slab is used, there are two surfaces (the top and the bottom side), both of which are then, of course, to be considered in the (total) surface area, . is the chemical potential of the species of th type (here: Ru, O2, CO), and is the number of atoms (or molecules) of the th species in the considered solid. and are the temperature and the partial pressures of the various species. Considering the presence of two independent reservoirs of O2 and CO implies that O2 and CO molecules, though their mix forms the environment, are not in equilibrium with each other: From energy considerations alone, CO2 would result as the most stable gas phase molecule for almost all temperature and pressure conditions, if the environment were able to attain thermodynamic equilibrium with itself. However, the large free energy barrier for the gas phase reaction CO + 1/2 O CO2 prevents that this reaction plays any role on the time scales of interest. Thus, our treatment ignores (because of good reasons) CO2 formation in the gas phase, and only at the end of our study (sections III D-F) we will consider that such a reaction may take place between species that are adsorbed on the surface. As a consequence, the oxygen and CO chemical potentials in this “constrained thermodynamic equilibrium” situation are given by the expressions discussed in the next paragraph.
With respect to the Ru chemical potential we note the other constraint of the present study, namely the presence of macroscopic quantities of bulk RuO2. If the temperature is not too low, this RuO2 material is in equilibrium with the O2 environment which implies
| (2) |
where is the Gibbs free energy of the bulk oxide (per formula unit). Inserting this into eq. (1) to eliminate and rewriting it for a slab calculation with two equivalent surfaces leads to a surface free energy, which is now a mere function of the chemical potentials determined by the equilibrium with the gas phase reservoirs, namely and ,
Here we also used that and . The Gibbs free energies of the slab and of the RuO2 bulk can be calculated by density-function theory, evaluating the total energies and the vibrational spectra.reuter02a As apparent from eq. (II.1), depends only on the difference of the Gibbs free energies of the bulk and the slab results. In our previous work we could show that for RuO2 the vibrational energy and entropy contributions to this difference of Gibbs free energies cancel to a large extentreuter02a , and we will therefore replace the slab and bulk Gibbs free energies by the corresponding total energies. We note, however, that for other systems this procedure can cause a noticeable error. Furthermore, we note (details are discussed in the appendix) that some surface phases may be disordered which gives rise to configurational entropy. On the energy scale relevant to the present study, this configurational-entropy contribution is negligible (cf. the appendix).
II.2 Chemical potentials
The chemical potentials of O and CO, that enter eq. (II.1), are determined by the condition of thermodynamic equilibrium with the surrounding gas phase reservoirs. Thus, their temperature and pressure dependence is
| (4) |
and
| (5) |
The temperature dependence of and includes the contributions from vibrations and rotations of the molecules, as well as the ideal gas entropy at 1 atmosphere. It can be calculated, but in this paper we will simply use the experimental values from thermodynamic tablesreuter02a ; JANAF , given in Table 1.
The K values of the O2 and CO chemical potentials, and , are the total energies of the isolated molecules (including zero point vibrations), and for these we will use our DFT results. We note that state-of-the-art DFT total energies of the O2 molecule are subject to a noticeable error. Again, for the present study this error is not crucial and can partially be circumvented reuter02a , however for other systems it maybe important to treat differently (see, for example, the case of silver oxide discussed in Ref. Li03, ).
| 100 K | -0.16 eV | -0.14 eV | 600 K | -1.22 eV | -1.18 eV |
|---|---|---|---|---|---|
| 200 K | -0.34 eV | -0.33 eV | 700 K | -1.46 eV | -1.40 eV |
| 300 K | -0.54 eV | -0.53 eV | 800 K | -1.70 eV | -1.64 eV |
| 400 K | -0.76 eV | -0.73 eV | 900 K | -1.98 eV | -1.88 eV |
| 500 K | -1.00 eV | -0.95 eV | 1000 K | -2.20 eV | -2.12 eV |
In the following we will present the resulting surface energies as a function of the chemical potentials, i.e. in -space. Equations (4) and (5) describe how these chemical potentials can be converted into pressure scales at any specific temperature. We will exemplify this below by showing pressure scales at K and K in order to elucidate the physical meaning behind the obtained results.
II.3 DFT computations
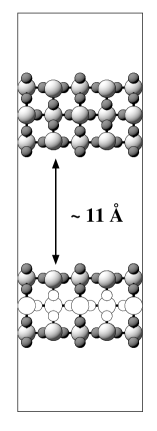
The total energies entering eq. (II.1) are obtained by DFT calculations using the full-potential linear augmented plane wave method (FP-LAPW) blaha99 ; kohler96 ; petersen00 together with the generalized gradient approximation (GGA) for the exchange-correlation functional perdew96 . The RuO2(110) surface is modeled in a supercell geometry, employing a symmetric slab consisting of three rutile O-(RuO)-O trilayers as shown in Fig. 1. All atomic positions within the outermost trilayer were fully relaxed. A vacuum region of 11 Å ensures the decoupling of the surfaces of consecutive slabs as described previously.reuter02a
The FP-LAPW basis set parameters are: 1.8 bohr, 1.1 bohr, 1.0 bohr, wave function expansion inside the muffin tins up to , potential expansion up to . For the RuO2(110) slabs the Brillouin zone (BZ) integration was performed using a Monkhorst-Pack grid with 50 (15) k-points in the full (irreducible) part of the BZ. The energy cutoff for the plane wave representation in the interstitial region between the muffin tin spheres was = 20 Ry for the wave functions and = 169 Ry for the potential. With one notable exception this is exactly the same basis set as used in our preceding work on RuO2(110) in contact with a pure O environment reuter02a . The calculated short CO bondlength of 1.15 Å (exp: 1.13 Å) forced us to reduce the oxygen muffin-tin radius from 1.3 bohr to 1.1 bohr, so that we had to increase from 17 Ry to 20 Ry to achieve the same high level of convergence as detailed before.
With this basis set, the computed binding energies for the free O2 ( eV), for the CO ( eV), and for the CO2 ( eV) molecule are in very good agreement with previously reported DFT values, while still showing the known overbinding with respect to experiment ganduglia99 ; eichler99 ; CRC95 . Note, that the above values contain zero-point vibrations that were estimated as 0.09 eV, 0.13 eV and 0.30 eV respectively. By comparison with test calculations performed at 24 Ry, we conclude that the absolute binding energies of O and CO at the RuO2(110) surface are converged within 0.15 eV/atom, which translates into surface free energy variations below 10 meV/Å2. For the differences between the computed of different surface phases, which are the quantities actually entering into the construction of the phase diagram presented here, the error cancellation is even better. As a consequence, the numerical uncertainty of results discussed below is meV/Å2 (with respect to the basis set and the supercell approach). While this error bar does not affect any of the physical conclusions drawn, we note that it does not include the errors introduced by the more basic deficiency of density-functional theory, namely the approximate nature of the employed exchange-correlation functional, the effect of which will be discussed in section III C.
III Results
III.1 Stability range of RuO2
As we are interested in the adsorption of reactants on a stable RuO2 substrate, we first analyze the stability range of rutile RuO2 bulk. In our previous work reuter02a we had already shown that in a pure oxygen environment, the -variations may be restricted to a finite range: Below the so-called “O-poor limit” the oxide will decompose into Ru metal and oxygen, i.e., the oxide is only stable if
| (6) |
i.e., if
| (7) |
Here is defined as . For K the right hand side equals half of the low temperature limit of the heat of formation, , for which our DFT calculations give eV (the experimental result is eV CRC95 ). Thus, despite the mentioned error in , for there is a fortuitous error cancellation. We note in passing that for the bulk phases the and dependence of the Gibbs free energies is small. Thus, replacing the right side of eq. (7) by is a good approximation.
The “O-rich limit” refers to conditions where oxygen will condense, and this gives the other restriction:
| (8) |
Combining the above two equations gives the range of we will consider in the later discussion as
| (9) |
RuO2 can also be destroyed (reduced) by carbon monoxide. In a pure CO environment the stability condition for the oxide is
| (10) |
This can be written as
| (11) |
Here is defined as . For the right hand side of eq. (11) (at K) our DFT result is eV (the experimental result is eV JANAF ).
Let us now consider that O2 and CO are both present in the gas phase. However, as mentioned earlier, we will consider the oxide (and its surface) in what we call a “constrained equilibrium”, i.e. we consider that RuO2 is in thermodynamic equilibrium with O2 and with CO individually, while the O2 and CO in the gas phase are not equilibrated. Combining eqs. (7) and (11) defines a line in -space:
| (12) |
with eV (theory) and eV (experiment)JANAF . Above the line, i.e. for , RuO2 decomposes into Ru and below the line the oxide is stable. The situation close to the line will be discussed, also for other oxides, in a subsequent publication.
Let us add a comment on the above treatment of the CO2 molecules. As mentioned above, CO2 is assumed to be not in thermodynamic equilibrium with any reservoir or any other species. A dynamical treatment of the CO2 gas flow is outside the scope of this paper, and as a first estimate we therefore use the single-molecule internal energy (total energy plus vibrations and rotations) in eq. (10) and in the following.
Corresponding to the thus derived stability conditions we will only show our computed surface free energies in the limited range eV 0.0 eV and eV eV, and mark the instability line, eq. (12), by a white dotted line. Finally, we also note that under very reducing conditions (low , high ) CO will transfrom into graphite, which then determines the C chemical potential and which e.g. occurs for eV for any eV. The corresponding region will be marked by extra hatching in our graphs, although it corresponds to gas phase conditions where RuO2 is already only metastable with respect to the aforedescribed CO-induced decomposition.
III.2 Adsorption of O and CO on RuO2(110)
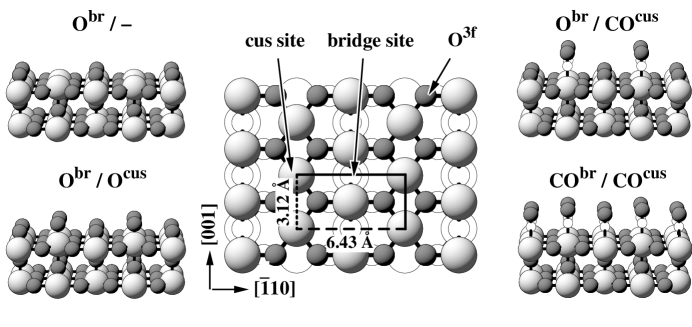
In the rutile RuO2 bulk structure, every Ru atom has six oxygen neighbors and every oxygen atom three metal neighbors reuter02a ; sorantin92 . The RuO2(110) surface structure is conveniently explained on the basis of the mixed (RuO) plane termination exhibiting threefold coordinated O3f lattice oxygen atoms, cf. the middle panel in Fig. 2. The computed lattice constants for the rectangular surface unit-cell are (6.43 Å 3.12 Å), which compare well with the experimentally reported values of (6.35 Å 3.11 Å) sorantin92 ; atanasoska88 . The surface exhibits two distinct adsorption sites, namely the so-called coordinatively unsaturated (cus) site atop of fivefold coordinated Ru atoms (Rucus), as well as the bridge site between two fourfold coordinated Ru atoms (Rubr), cf. Fig. 2. The bulk stacking of the oxide would be continued by oxygen atoms first occupying all bridge sites (Obr), this way yielding the stoichiometric surface termination (upper left panel of Fig. 2) that also arises naturally when cutting the bulk between two of the subsequent O-(RuO)-O trilayers shown in Fig. 1. Occupying also all cus sites (Ocus) then leads to the third possible termination of a rutile (110) surface shown in the lower left panel of Fig. 2.reuter02a
Adsorption of either O or CO is in principle also conceivable at other sites on the surface. However, extensive calculations with O and CO in such low-symmetry sites showed significantly lower binding energies compared to adsorption at the cus and bridge sites, which is why we will restrict our discussion to these two prominent sites in the following. We also performed a large number of calculations in larger supercells up to and periodicity to assess the importance of lateral interactions between the adsorbates. The obtained binding energies for both adsorbates varied by less than 150 meV reuter02c , reflecting rather weak lateral interactions beyond the direct first neighbor cus-br interaction (implicitly contained within our DFT-computed total energies of phases). Correspondingly, only the latter phases will be considered in the following.
| Species | Phase | Binding Energy |
|---|---|---|
| Obr | Obr/– | -2.44 eV/atom |
| Obr | Obr/Ocus | -2.23 eV/atom |
| Obr | Obr/COcus | -2.37 eV/atom |
| Ocus | Obr/Ocus | -0.99 eV/atom |
| O3f | Obr/– | -3.59 eV/atom |
| COcus | Obr/COcus | -1.38 eV/atom |
| COcus | CObr/COcus | -1.39 eV/atom |
| CObr | CObr/COcus | -1.58 eV/atom |
Depending if the bridge and cus site within a cell is either occupied by O or CO or empty, nine different adsorption geometries result. For these we introduce a short-hand notation indicating first the occupancy of the bridge and then of the cus site, e.g. Obr/– for O adsorption at the bridge site, the cus site being empty. Having computed the total energies of all nine combinations, we only find the four depicted in perspective views in the side panels in Fig. 2 to be relevant in the context of a high pressure gas phase and will consequently dedicate ourselves to them for clarity.
From our calculations we obtain a number of K binding energies, which are given in Table 2. Good agreement for CO is obtained with other DFT calculations kim00 ; kim01 ; seitsonen01 ; liu01 . Also the value for Obr agrees nicely with the value reported by Liu et al. liu01 . On the other hand, all oxygen binding energies are eV stronger than those reported by Seitsonen and coworkers kim00 ; kim01 ; seitsonen01 . We are unable to explain this discrepancy, but note that our Ocus binding energy of about -1 eV (with respect to ) is consistent with the thermodesorption temperature of K reported for this species.boettcher99
From the numbers listed in Table 2 we see that O adsorption at bridge sites is in general significantly stronger than adsorption at the cus sites, which is comprehensible considering the on-top, onefold bonding geometry at the cus sites compared to the bridge, twofold bonding geometry at the bridge sites, cf. Fig. 2. Interestingly, CO does not follow such a pronounced bond-order conservation trend and exhibits only slight differences in bond strength at bridge and cus sites. As has already been pointed out by Seitsonen et al., this might be related to the specific CObr adsorption geometry, which in the here considered phase is an asymmetric bridge with the CO much stronger bound to only one of the two neighboring Rubr atoms.seitsonen01
III.3 Surface phase diagram
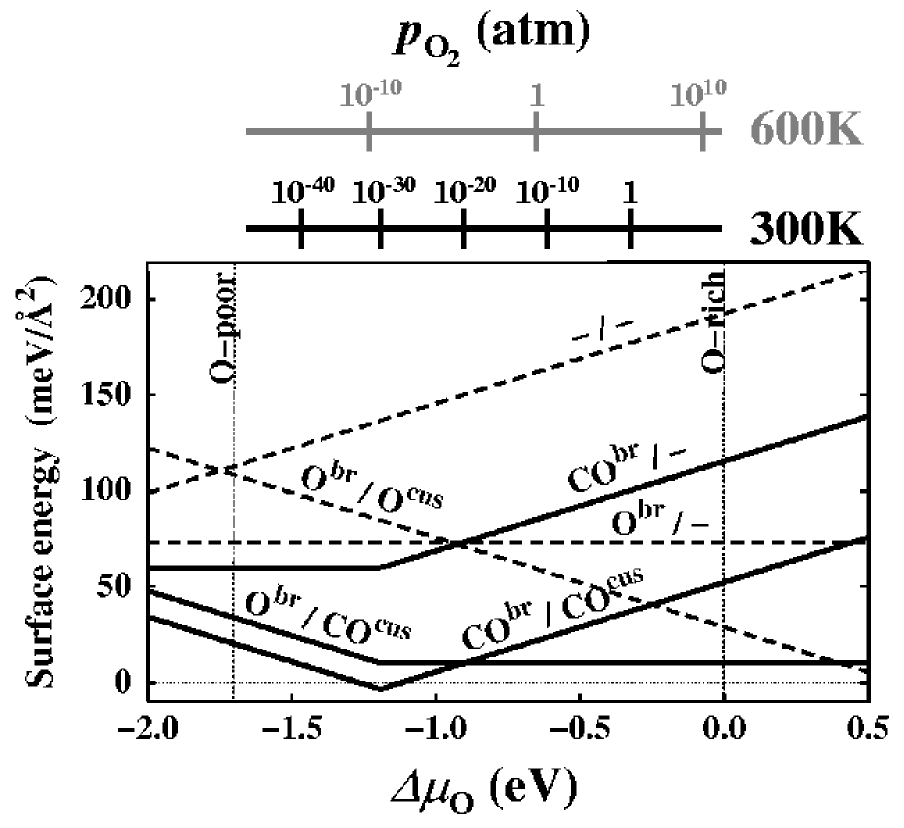
Before proceeding to set up the surface phase diagram by evaluating eq. (II.1) for any , we start by summarizing the previously reported effect of a just oxygen containing environment reuter02a . In this special case, corresponding to , we have to consider the stability of the aforedescribed three possible oxide terminations –/–, Obr/– and Obr/Ocus as a function of the oxygen chemical potential. From the computed surface free energies drawn as dashed lines in Fig. 3 we see that in the allowed range of delimited by the two vertical dotted lines, cf. eq. (9), the mixed (RuO) plane termination –/– shown in the topview in Fig. 2 is never stable, so that oxygen atoms will always occupy at least all bridge sites, Obr/–, as long as the surface is in equilibrium with the surrounding gas phase. Towards higher oxygen atoms will additionally occupy all cus sites, leading to the polar Obr/Ocus termination, cf. Fig. 3. To give an impression of the corresponding pressures required to stabilize this latter termination, we have also included in Fig. 3 pressure scales as second -axis for K and K, the latter temperature corresponding to a typical annealing temperature frequently employed in experimental studies on this system boettcher99 ; over00 ; kim01b ; fan01 ; wang02 ; kim00 ; kim01 ; seitsonen01 . From these scales we deduce that the stoichiometric Obr/– termination, that was frequently prepared and studied in UHV studies boettcher99 ; over00 ; kim01b ; fan01 ; wang02 ; kim00 ; kim01 ; seitsonen01 , is primarily the end result of a high temperature anneal in UHV, whereas at atmospheric O2 pressures the surface exhibits additionally oxygen atoms at the cus sites.
Extending our analysis now to the two-component (O2,CO) environment, we fix the CO chemical potential first to eV, corresponding to very CO-rich conditions. This allows us not only to conveniently draw the surface free energies of three most stable O and CO containing geometries into Fig. 3 (solid lines), but gives also the low -limit for these phases. As explained in Section IIIA, in this CO-rich limit the C chemical potential is determined by the equilibrium with graphite below eV and with CO above, which is why the corresponding three lines in Fig. 3 exhibit a kink at this value. Even in the shown CO-rich limit, the CObr/– phase due to CO adsorption at only the energetically more favorable bridge sites, cf. Table 2, is barely more stable than the hitherto considered pure O-terminations. This changes, if CO is additionally present also at the cus sites, as we find the completely CO covered CObr/COcus surface to have a low surface free energy at least at low O chemical potential. Towards higher the third geometry exhibiting O atoms at the bridge sites and CO at the cus sites, Obr/COcus, becomes finally even more stable, cf. Fig. 3.
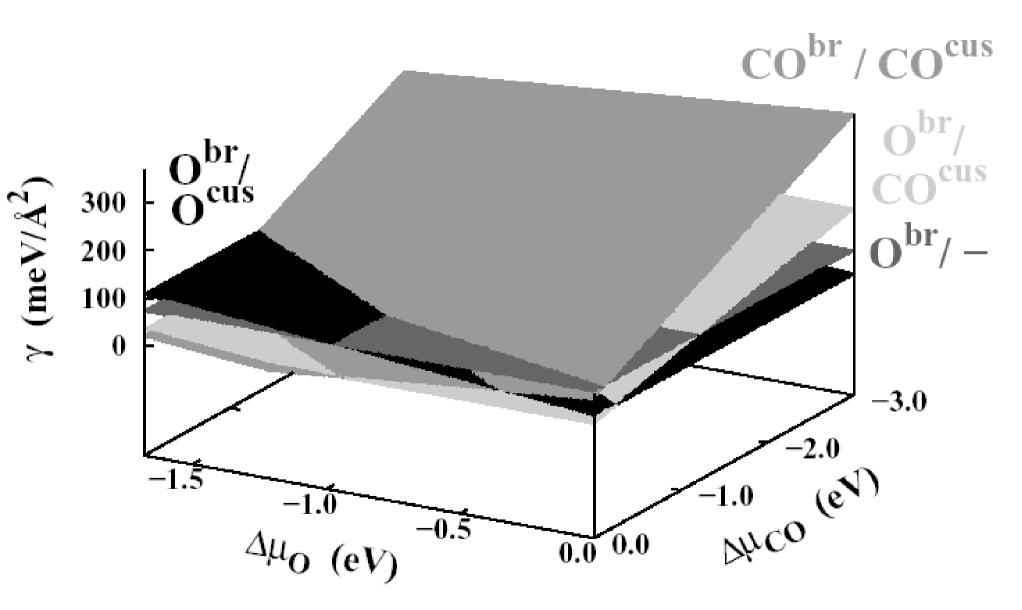
Allowing (in addition to ) variations of away from the CO-rich limit, the two-dimensional graph in Fig. 3 is extended into the three-dimensional one shown in Fig. 4, in which is given as a function of . This implies obviously, that the contents of Fig. 3 are contained as a special case in Fig. 4, in fact as the surface free energy dependence along the front -axis of the latter figure. With decreasing CO chemical potential, i.e. lower CO content in the gas phase, the CO involving surface phases become increasingly less favorable, whereas the surface free energies of the two pure O terminations do of course not depend on . It is also worth pointing out that according to eq. (II.1) the slope with respect to of the plane representing the CObr/COcus phase in Fig. 4 is twice that of the plane of the Obr/COcus phase, given that the prior structure contains double the amount of CO at the surface. Although could in principle be varied down to , we only show in Fig. 4 the range to eV, as already at this value the pure O terminations have become most stable for any , indicating that the CO content in the gas phase has become so low, that no CO can be stabilized at the surface anymore.
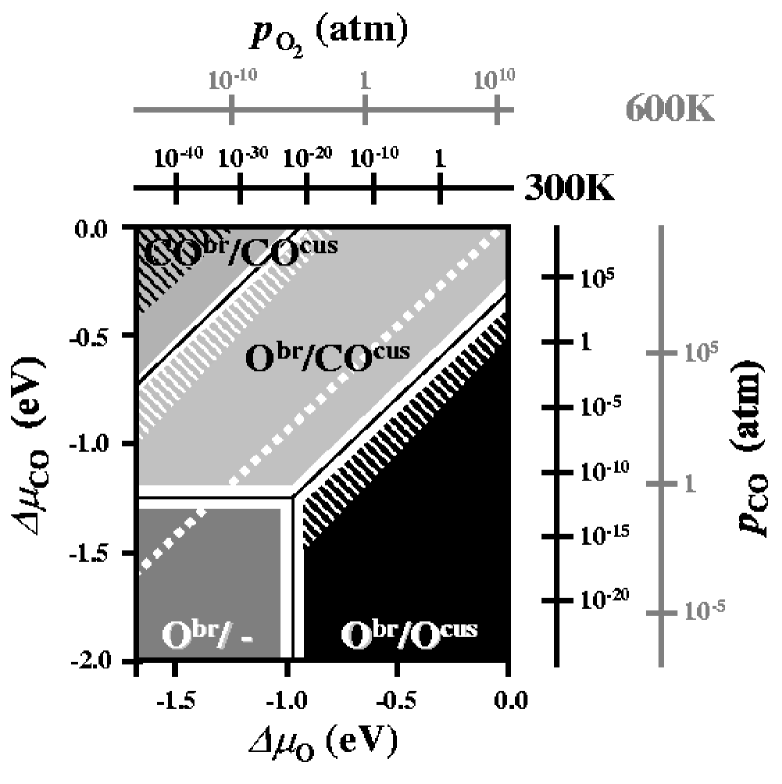
Although Fig. 4 is instructive for understanding the extension of the surface free energy dependence from a one-component to a two-component environment, the three-dimensional nature of the plot does not allow an easy access to the really important information contained in it, i.e. which phase has the lowest and is thus most stable for a given gas phase characterized by and . This information is better obtained by only drawing the stability regions of the most stable phases, which corresponds to a projection of the lowest surface free energies in Fig. 4 onto the -plane. The resulting surface phase diagram is drawn in Fig. 5. At the lowest CO chemical potentials shown, so little CO is present in the gas phase, that we simply recover the previously discussed surface structure dependence on in a pure O2 atmosphere. In other words, the stoichiometric Obr/– phase is stable at low O chemical potential, while higher O2 pressures stabilize additional oxygen at the surface, leading to the Obr/Ocus phase. Increasing the CO content in the gas phase, CO is first bound at the cus sites. This is easier at low O chemical potentials, where these sites are free, but is harder at higher where also oxygen atoms compete for adsorption at the cus sites. As a result, towards higher the Obr/COcus phase becomes only more stable than the Obr/Ocus phase at progressively higher CO chemical potentials, cf. Fig. 5. Finally, under very reducing conditions (high , low ) CO is able to substitute O also at the bridge sites, yielding the completely CO covered CObr/COcus surface. Additionally shown in Fig. 5 is the line marking the instability of RuO2 with respect to CO-assisted decomposition at high (white dotted line). From the location of this line we see that the complete stability region of the CObr/COcus phase (including the graphite-formation region hatched in black) and large parts of the Obr/CO phase correspond already to metastable situations that will not prevail for long under realistic conditions.
The surface phase diagram in Fig. 5 summarizes the key results of the present work. However, before proceeding to discuss the physics contained in it, we like to discuss the accuracy of our theory. As stated in section IIC, the numerical uncertainty in the surface free energies due to the DFT basis set and the supercell approach is about meV/Å2. If we allow the four planes shown in Fig. 4 to shift by this value with respect to each other, the resulting intersections, i.e. the phase boundaries, would shift within the white regions drawn in Fig. 5. We have added additional axes in Fig. 5 indicating the pressure scales at K and 600 K. From these scales it becomes apparent, that at room temperature our computational uncertainty may very well correspond to even a few orders of magnitude in pressure. On the other hand, this is only so, because at K these one or two orders of magnitude in pressure sample only a vanishingly small part of phase space. In general, we believe that Fig. 5 illustrates quite nicely that our numerical inaccuracy does not affect the general structure of the obtained phase diagram at all - even if it would, it would just mean that we would have to increase our basis set.
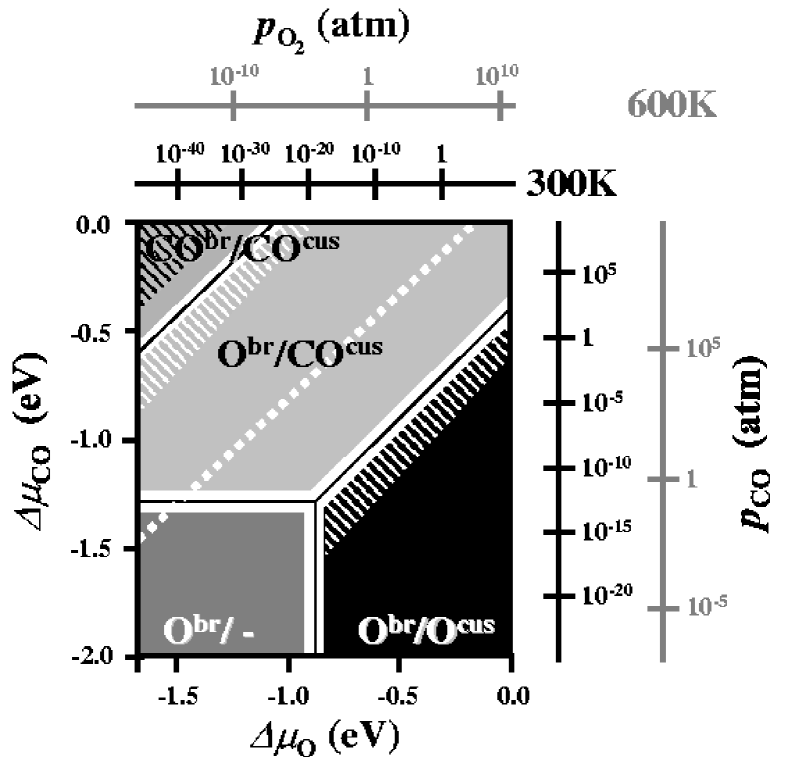
This error analysis does not yet include the more basic deficiency of DFT, namely the approximate nature of the exchange-correlation functional. To this end, we have also computed the surface phase diagram not with a gradient-corrected functional, but with the local-density approximation (LDA) perdew92 . The result (obtained by a complete geometry reoptimization of all structures using the LDA lattice constants) is shown in Fig. 6 and is very similar to the GGA results (Fig. 5). It is worth pointing out that the absolute surface free energies for the different phases obtained within the LDA are up to 20 meV/Å2 higher than the GGA results. However, their differences, which ultimately determine the positions of the phase boundaries, differ only little. Although this LDA and GGA comparison does not provide a quantitative assessment of the remaining error that is due to the approximate treatment of exchange and correlation, the obtained small difference strongly suggests that the DFT-accuracy for this phase diagram is rather high. In line with our previous analysis reuter02a we therefore conclude that the approximate nature of the exchange-correlation functional may affect the exact phase transition temperatures and pressure (with a typical uncertainty of K and 1-2 orders of magnitude in pressure), but does not affect the overall structure of the obtained phase diagram.
III.4 Surface phase diagram, kinetics and catalysis
The main outcome of the preceding section is the surface phase diagram of RuO2(110) in “constrained thermodynamic equilibrium” with an environment formed of O2 and CO in the complete range of experimentally accessible gas phase parameters. Kinetic effects due to catalytic CO oxidation at the surface may obviously cause deviations from this situation, and we will show in the following how the obtained surface phase diagram may be analyzed to identify corresponding regions in -space where such kinetic effects may become crucial and/or a high catalytic activity may be expected.
In general, the surface will be close to our “constrained thermodynamic equilibrium” with the reactant gas phase, as long as the on-surface CO2 formation is the rate-limiting step. Then, adsorption and desorption of the reactants can occur frequently on the time scale of the reaction event, allowing the chemical potentials of gas phase and adsorbed particles to equilibrate. In this context we note that the only proper definition of thermodynamic equilibrium is this equality of chemical potentials. This is not equivalent to saying that the adsorption and desorption rate of O and CO is equal. This would only be true, if no other channels for removing the particles from the surface existed. Instead, in catalysis we can have the situation, that desorption and reaction compete with adsorption, but this must not necessarily mean that the chemical potentials of the reactants couldn’t still equilibrate with the ones in the gas phase (provided the reaction event rate is low).
On the other hand, if the final reaction step is not rate-limiting and the bottleneck of the reaction would e.g. be given by the adsorption process(es), adsorbate(s) would be faster consumed by the final reaction than replenished by the slow adsorption from the gas phase. Under such conditions, the adsorbate concentration can be much lower or due to preferential adsorption much different to what is predicted by a thermodynamic theory. Still, in the present case the kinetic effects will even then be restricted to the immediate surface population at bridge and cus sites, provided one stays within the range of the RuO2 bulk stability discussed in section IIIA, i.e. below the dotted white line in Fig. 5: the creation of vacancies in the oxide bulk lattice is simply too costly, cf. the binding energy of O3f in Table 2. A Mars-van-Krevelen type mechanism, where the oxidation reaction is noticeably dependent on oxygen diffusion through the bulk mars54 , appears therefore rather unlikely for RuO2(110) in a more oxidizing gas phase (). Only if the steady-state reaction is run under gas phase conditions close to the dotted instability line in Fig. 5 would we expect this to become different, in which case also oscillations between metallic and oxidic state might become perceivable.reuter02c
III.5 Catalytically most active regions
Analyzing the surface phase diagram in Fig. 5 along the lines described in the preceding section, the part of the Obr/COcus phase below the dotted instability line appears to be a likely region in -space where catalysis might be most efficient: In contrast to all other phases, both reactants are then adsorbed at the oxide surface, indicating as dominant reaction mechanism COcus + O CO2. We will show below that the CO2 formation energy barrier for this process is noticeable (1.25 eV, in good agreement with the result of Liu, Hu and Alaviliu01 ). Furthermore, the energy to create vacancies in the O-bridge layer is rather high (2.37 eV, cf. Table 2), so that we would expect the surface to be rather close to the “constrained equilibrium” situation under such gas phase conditions.
The mechanism between Obr and COcus has already been suggested on the basis of extensive UHV experiments over00 ; kim01b ; fan01 ; wang01 ; wang02 ; kim01 ; seitsonen01 , where it had initially been characterized as a Mars-van-Krevelen type reaction, given that Obr is adsorbed at the bridge sites which correspond to a continuation of the bulk oxide lattice stacking. As most of the experiments were not conducted at steady-state, but employed CO postdosage in UHV over00 ; kim01b ; fan01 ; wang01 ; kim01 ; seitsonen01 , a further reduction of the surface was also reported, in which after Obr had been reacted off, CO subsequently occupied also the bridge sites fan01 ; wang01 ; wang02 ; seitsonen01 . While this is fully compatible with the higher binding energy of CO at the bridge sites, cf. Table 2, the phase diagram in Fig. 5 reveals that under consideration of the environment, an extremely large CO/O2 partial pressure ratio (corresponding to an almost pure CO atmosphere) would be required to really be able to stabilize CO at the bridge sites in the CObr/COcus phase, cf. the given pressure scales. Even then such a situation would not prevail for long under realistic conditions, as RuO2 is then already instable against CO-assisted decomposition into Ru metal.
Hence, the initially identified part of the Obr/COcus phase is still a more likely candidate for a catalytically active region. The question remains if this is already the part in -space where we expect the RuO2 catalysis to be most efficient? In this respect we note that a so-called stable phase in our thermodynamic approach is not stable on a microscopic scale, but represents an average over fluctuations of elementary processes such as dissociation, adsorption, diffusion, association and desorption. As all these processes and their interplay stampfl02 are of crucial importance for catalysis, regions in -space where such fluctuations are particularly pronounced are expected to be most important. This will be the case under gas phase conditions, which correspond to regions in the computed surface phase diagram close to boundaries between different stable phases: At finite temperatures, the transition from one phase to the other will not be abrupt in -space, but over a pressure range in which the other phase gradually becomes more populated. The resulting phase coexistence at the catalyst surface could then lead to a significantly enhanced dynamics, in which even additional reaction mechanisms (in case of microscopically coexisting phases) or reaction fronts (in case of domain pattern formation) might become operational.
Assuming a canonic distribution of the two competing phases reuter02a we have correspondingly estimated the region on both sides of the boundaries in which the respective other phase is present at least at a 10% concentration, and marked it as white regions for the case of K in Fig. 5 and Fig. 6. Concomitantly, one of these boundary regions (the one between the Obr/COcus and the Obr/Ocus phases, henceforth termed cus-boundary), for which we would thus expect an enhanced dynamics, falls just into gas phase regions, for which the exceptionally high turnover rates over working Ru catalysts have been reported, i.e. for ambient pressures in an about equal partial pressure ratio cant78 ; peden86 . Along this cus-boundary both reactants compete for adsorption at the cus sites. Provided the rather low lateral interactions between neighboring cus sites described in section IIIB a microscopic coexistence of both phases appears then likely, i.e. neighboring cus sites could be occupied independently by either O or CO. This would open up an additional reaction channel, COcus + O CO2, which had already been observed as a dominant mechanism in UHV experiments on preoxidized RuO2(110), as long as Ocus atoms where available on these surfaces fan01 ; wang02 .
Below we report a rather low barrier of 0.9 eV for this process, so that Ocus atoms can react away rapidly under these conditions. If the filling of empty sites with CO will also be fast as is the case in the hatched region of the Obr/Ocus phase close to the cus-boundary, then the surface will not be close to the constrained thermodynamic equilibrium situation and the real Ocus concentration may be much lower than suggested in Figs. 5 and 6. From our argument we therefore expect high catalytic activity in this region, but also note that here coverage and structure (i.e. the very dynamic behavior) must be modeled by statistical mechanics. Although the equilibrium approach thus breaks down just in this most interesting region, we see that it still enables us to rationalize under which gas phase parameters highest activity is to be expected.
While this already helps to embed the UHV measurements into the catalytic context, the phase diagram also allows to systematically analyze when and how the pressure gap may be bridged in corresponding experiments: Namely, when it is assured that one stays within one phase region or along one particular phase boundary, assuming that then the same reaction mechanism will prevail. For example, at an about equal partial pressure ratio of O2 and CO a decrease of ambient gas phase pressures over many orders of magnitude will at room temperature only result in a wandering close to the cus-boundary in -space, cf. Fig. 5. Correspondingly, we would conclude, that similar reaction rates should result, as has indeed recently been noticed by Wang et al. wang02 when comparing their UHV steady-state kinetic data with high pressure experiments of Zang and Kisch zang00 .
However, from Fig. 5 it is also obvious that without the knowledge of a -phase diagram, as e.g. provided by the present work, a naive bridging of the pressure gap by simply maintaining an arbitrary constant partial pressure ratio of the reactants may easily lead to crossings to other phase regions and in turn to uncomparable results. In this respect it is particularly important to notice that e.g. the cus-boundary does not exactly fall on the equal partial pressure ratio line. There is no reason it should, and already at K the same aforedescribed decrease of ambient gas phase pressures would bring one rapidly away from the cus-boundary until at UHV pressures one even ends up deep inside the stability region of the Obr/– phase, cf. Fig. 5. Consequently, the computed phase diagram leads us to predict that kinetic measurements at this temperature and UHV pressures will result in a very low catalytic activity, as under such conditions no CO can bind to the surface anymore. This reactivity would then, however, be contrasted by the extremely high turnover numbers reported for working Ru catalysts close to ambient pressures at exactly the same temperature cant78 ; peden86 , in other words a typical pressure gap situation.
III.6 Reaction mechanisms
In the course of the preceding section two likely oxidation mechanisms have been identified, in which COcus reacts with oxygen adsorbed at either a neighboring bridge or a neighboring cus site. As apparent from Fig. 2 both channels take place along high symmetry lines parallel to the surface: Along the direction for reaction with Obr (dashed line) and along the direction for reaction with Ocus (dotted line), respectively, so that we are in both cases left with a planar configuration and may neglect the degrees of freedom perpendicular to this plane formed by the corresponding in-surface and the out-of-surface [110] direction. Even assuming the underlying oxide substrate as rigid, we are thus facing at least a six-dimensional problem, involving as one possible choice the following set of variables: Lateral and vertical position of Ccus, lateral and vertical position of the adsorbed O, as well as the CO bondlength and the polar angle of the CO molecular axis with respect to the surface. In order to shed more light on the importance of the two possible reaction mechanisms we proceed to determine their respective transition state (TS) using large unit-cells to decouple the periodic images of the reacting species. Within these cells, we map out the potential energy surface (PES) along two reaction coordinates, namely the lateral positions of the Ccus and the adsorbed oxygen within the given reaction plane, while minimizing the energy at each point with respect to all remaining degrees of freedom (including full a relaxation of the underlying oxide lattice).
Figure 7 shows the mapped PES for the reaction COcus + O CO2, which according to our phase diagram is likely for a large range of gas phase parameters corresponding to the stability region of the Obr/COcus phase. The total lateral distance between a neighboring cus and bridge site is 3.21 Å, cf. Fig. 2, and we find the TS at a rather large lateral Ccus displacement of 1.44 Å, while the Obr atoms move only by 0.21 Å away from their equilibrium position. As shown in the inset of Fig. 7 the Rucus-Ccus distance is therefore remarkably lengthened at the TS (2.40 Å compared to 1.99 Å at the initial state), whereas the Rubr-Obr distance is only slightly stretched (1.98 Å compared to 1.92 Å). Looking at the binding energies compiled in Table 2, we can identify as one reason for this asymmetric behavior the significantly larger binding energy for Obr compared to COcus. Nevertheless we compute a rather low reaction barrier of 1.25 eV for this process, which compares favorably with the value of 1.15 eV reported in an earlier pseudopotential study by Liu, Hu and Alavi employing a constrained minimization for the Obr-COcus bond length liu01 . As also pointed out in that work, already this mechanism on RuO2(110) should have a higher reactivity than the Ru(0001) surface, for which the CO oxidation barrier was computed to be 1.45 eV in a cell.stampfl97

Turning to the second mechanism, COcus + O CO2, we notice that the TS location in Fig. 8 has strongly shifted compared to the one displayed in Fig. 7. At the TS also the Ocus atoms have now moved laterally by 0.73 Å stretching their bondlength from 1.70 Å at the initial state to 1.79 Å, so that the Rucus-Ccus bondlength needs only to be increased to 2.08 Å in comparison to the 2.40 Å required for the prior reaction. This difference can again be understood by looking at the binding energies listed in Table 2, from where the much lower bond strength of Ocus becomes apparent, that should facilitate an easier displacement in comparison to the much stronger bound Obr atoms. In line with the thus expected higher reactivity of the Ocus atoms, we indeed find a much lower barrier of only 0.89 eV for this mechanism.
In view of the surface phase diagram shown in Figs. 5 and 6, this COcus + O CO2 reaction is primarily expected under the phase coexistence conditions along the cus-boundary. Concomitantly, it is also gas phase parameters that correspond to this cus-boundary, for which the exceptionally high turnover numbers over working Ru catalysts have been reported cant78 ; peden86 . Obtaining a particularly low barrier for a reaction mechanism that may preferably be operational under just these conditions fits thus not only nicely to the observed high reactivity, but also underlines as specific example, that the enhanced dynamics in phase coexistence regions might be crucial to understand the function of surfaces under realistic conditions.
IV Summary
In conclusion we have computed a first-principles based phase diagram of the lowest energy surface structures of RuO2(110) in the “constrained equilibrium” with an environment formed of O2 and CO. Depending on the chemical potentials of both gas phase species a number of different surface phases is found, ranging from two different exclusively O containing terminations to a completely CO covered surface. We showed how this surface phase diagram can be analyzed to identify gas phase conditions where kinetic effects due to the CO oxidation reaction may become crucial and/or a high catalytic activity can be expected. In view of the possibly enhanced dynamics, we emphasize the particular importance of phase coexistence regions close to boundaries in the computed surface phase diagram, and suggest that a reliable bridging of the pressure gap is possible, provided that one stays within one phase region or along one particular phase boundary.
Concerning the specific application to the CO oxidation over RuO2(110) we showed that the gas phase parameters, for which exceptionally high turnover numbers have experimentally been reported, correspond to phase coexistence conditions at the catalyst surface, in which the reaction COcus + O CO2 may be active in addition to the hitherto favored COcus + O CO2. For the prior mechanism we calculate a significantly lower barrier of 0.89 eV compared to the 1.25 eV for the latter channel, which for this specific example underlines that phase coexistence conditions might indeed be relevant to understand the reactivity of this catalyst surface.
Our analysis exemplifies that calculations of the kind presented in this work can be used to identify important reaction steps at any given in the gas phase and to already explain a number of experimental findings on the surface reactivity. Yet, a real microscopic description of catalysis can only be obtained by subsequent computations of the kinetics of the manyfold of possible elementary processes, as well as simulations addressing the statistical interplay among them. To obtain meaningful results from the latter type of studies the consideration of all relevant atomistic steps is crucial, the identification of which will be greatly facilitated by the prerequisite of knowing the various stable surface phases in equilibrium with the given gas phase.
Appendix
Consider a system with surface sites and a small number of defect or adsorbate sites (). Then, the configurational entropy is given by
| (13) |
If we define as the surface area per site, the configurational entropy per surface area is
| (14) |
For we can apply the Stirling formula which gives
| (15) | |||||||
The expression in the square brackets varies between 0 (for (n/N) = 0) and 1.2 (for (n/N)=10%). Thus, the configurational entropy
| (16) |
For RuO2(110), considering two sites (bridge and cus) per unit-cell, implies that Å2. Correspondingly, we deduce a configurational contribution to the surface free energy of less than 5 meV/Å2 for any K. This is negligible everywhere in the phase diagram apart from the phase coexistence regions.
References
- (1) R.I. Masel, Principles of Adsorption and Reaction on Solid Surfaces, Wiley, New York (1996).
- (2) C. Stampfl, M.V. Ganduglia-Pirovano, K. Reuter, and M. Scheffler, Surf. Sci. 500, 368 (2002).
- (3) C.M. Weinert and M. Scheffler, In: Defects in Semiconductors, H.J. von Bardeleben (Ed.), Mat. Sci. Forum 10-12, 25 (1986). http://www.fhi-berlin.mpg.de/th/publications/Mat-Sci-Forum-10to12-25-1986.pdf .
- (4) M. Scheffler, In: Physics of Solid Surfaces - 1987, J. Koukal (Ed.), Elsevier, Amsterdam (1988). http://www.fhi-berlin.mpg.de/th/publications/Phys-of-Sol-Surfaces-1987-1988.pdf; M. Scheffler and J. Dabrowski, Phil. Mag. A 58, 107 (1988). http://www.fhi-berlin.mpg.de/th/publications/Phil-Mag-A-58-107-1988.pdf .
- (5) E. Kaxiras, Y. Bar-Yam, J.D. Joannopoulos, and K.C. Pandey, Phys. Rev. B 35, 9625 (1987).
- (6) G.-X. Qian, R.M. Martin, and D.J. Chadi, Phys. Rev. B 38, 7649 (1988).
- (7) X.-G. Wang, W. Weiss, Sh.K. Shaikhutdinov, M. Ritter, M. Petersen, F. Wagner, R. Schlögl, and M. Scheffler, Phys. Rev. Lett. 81, 1038 (1998).
- (8) X.-G. Wang, A. Chaka, and M. Scheffler, Phys. Rev. Lett. 84, 3650 (2000).
- (9) K. Reuter and M. Scheffler, Phys. Rev. B 65, 035406 (2002).
- (10) K. Reuter and M. Scheffler, Phys. Rev. Lett. (in press).
- (11) N.W. Cant, P.C. Hicks, and B.S. Lennon, J. Catal. 54, 372 (1978).
- (12) C.H.F. Peden and D.W. Goodman, J. Phys. Chem. 90, 1360 (1986).
- (13) A. Böttcher, H. Niehus, S. Schwegmann, H. Over, and G. Ertl, J. Phys. Chem. B 101, 11185 (1997).
- (14) A. Böttcher and H. Niehus, Phys. Rev. B 60, 14396 (1999).
- (15) H. Over, Y.D. Kim, A.P. Seitsonen, S. Wendt, E. Lundgren, M. Schmid, P. Varga, A. Morgante, and G. Ertl, Science 287, 1474 (2000).
- (16) Y.D. Kim, H. Over, G. Krabbes, and G. Ertl, Topics in Catalysis 14, 95 (2001).
- (17) C.Y. Fan, J. Wang, K. Jacobi, and G. Ertl, J. Chem. Phys. 114, 10058 (2001).
- (18) J. Wang, C.Y. Fan, K. Jacobi, and G. Ertl, Surf. Sci. 481, 113 (2001).
- (19) J. Wang, C.Y. Fan, K. Jacobi, and G. Ertl, J. Phys. Chem. B 106, 3422 (2002).
- (20) Z.P. Liu, P. Hu, and A. Alavi, J. Chem. Phys. 114, 5956 (2001).
- (21) D.R. Stull and H. Prophet, JANAF Thermochemical Tables, 2nd ed., U.S. National Bureau of Standards, Washington, D.C. (1971).
- (22) W.X. Li, C. Stampfl, and M. Scheffler, Phys. Rev. B. (in press).
- (23) P. Blaha, K. Schwarz and J. Luitz, WIEN97, A Full Potential Linearized Augmented Plane Wave Package for Calculating Crystal Properties, Karlheinz Schwarz, Techn. Universität Wien, Austria, (1999). ISBN 3-9501031-0-4.
- (24) B. Kohler, S. Wilke, M. Scheffler, R. Kouba, and C. Ambrosch-Draxl, Comput. Phys. Commun. 94, 31 (1996).
- (25) M. Petersen, F. Wagner, L. Hufnagel, M. Scheffler, P. Blaha, and K. Schwarz, Comp. Phys. Commun. 126, 294 (2000).
- (26) J.P. Perdew, K. Burke and M. Ernzerhof, Phys. Rev. Lett. 77, 3865 (1996).
- (27) M.V. Ganduglia-Pirovano and M. Scheffler, Phys. Rev. B 59, 15533 (1999).
- (28) A. Eichler and J. Hafner, Phys. Rev. B 59, 5960 (1999).
- (29) CRC Handbook of Chemistry and Physics, 76th ed., CRC Press, Boca Raton, FL (1995).
- (30) P.I. Sorantin and K.H. Schwarz, Inorg. Chem. 31, 567 (1992).
- (31) Lj. Atanasoska, W.E. O’Grady, R.T. Atanasoski, and F.H. Pollak, Surf. Sci. 202, 142 (1988).
- (32) K. Reuter and M. Scheffler, (in preparation).
- (33) Y.D. Kim, A.P. Seitsonen, and H. Over, Phys. Rev. B 63, 115419 (2000).
- (34) Y.D. Kim, A.P. Seitsonen, S. Wendt, J. Wang, C. Fan, K. Jacobi, H. Over, and G. Ertl, J. Phys. Chem. 105, 3752 (2001).
- (35) A.P. Seitsonen, Y.D. Kim, M. Knapp, S. Wendt, and H. Over, Phys. Rev. B 65, 035413 (2001).
- (36) J.P. Perdew and Y. Wang, Phys. Rev. B 45, 13244 (1992).
- (37) P. Mars and D.W. van Krevelen, Chem. Eng. Sci. 3, 41 (1954).
- (38) L. Zang and H. Kisch, Angew. Chem. Int. Ed. 112, 4075 (2000).
- (39) C. Stampfl and M. Scheffler, Phys. Rev. Lett. 78, 1500 (1997).