Definitive spectroscopic determination of the transverse interactions responsible for the magnetic quantum tunneling in Mnacetate
Abstract
We present detailed angle-dependent single crystal electron paramagnetic resonance (EPR) data for field rotations in the hard plane of the single molecule magnet Mn12-acetate. A clear four-fold variation in the resonance positions may be attributed to an intrinsic fourth order transverse anisotropy (). Meanwhile, a four-fold variation of the EPR lineshapes confirms a recently proposed model wherein disorder associated with the acetic acid of crystallization induces a locally varying quadratic (rhombic) transverse anisotropy []. These findings explain most aspects of the magnetic quantum tunneling observed in Mn12-acetate.
pacs:
75.50.Xx, 75.60.Jk, 75.75.+a, 76.30.-vNanometer scale single molecule magnets (SMMs), consisting of a core of exchange-coupled transition metal ions (e.g. Mn, Fe, Ni or Co, etc.) that collectively possess a large magnetic moment per molecule (thus far up to approximately ), have attracted considerable recent theoretical and experimental interest.Angewandte03 ; MRS00 SMMs offer a number of advantages over other types of magnetic nanostructures - for example, they are monodisperse, thereby enabling fundamental studies of properties intrinsic to magnetic nanostructures that have previously been inaccessible. Indeed, recent studies of SMMs have revealed the quantum nature of the spin-dynamics in a nanomagnet:Friedman96 ; Thomas96 ; Peer98 a metastable state of the magnetization, say ”spin-up,” has been shown to relax by quantum tunneling through a magnetic anisotropy barrier to a ”spin-down” state, in a process called magnetic quantum tunneling (MQT). Remarkably, MQT in SMMs can be switched on and off, either via a small externally applied fieldWernsdScience99 or by chemically controlling local exchange interactions between pairs (dimers) of SMMs, so-called ”exchange-bias”.WernsdNature02 Hence the promise of future applications involving SMMs, such as single molecule data storage elements or magnetic Qbits.LossNature01
The essential physics of a SMM originates from its large total spin S, and an axial or Ising-like magnetocrystalline anisotropy.Angewandte03 ; MRS00 To a fairly good approximation,HillPRL98 ; HillS903 one can describe such a giant spin by the following effective spin Hamiltonian:Barra97 ; MirebeauPRL99
where D is the axial anisotropy constant, and is the spin projection operator along the easy- (-) axis of the molecule; the second rhombic term () characterizes the transverse anisotropy within the hard magnetic plane of the SMM (here, and are the x and y projections of the total spin operator ); the third term represents the Zeeman interaction with an applied magnetic field ( is the Land g-tensor); includes fourth order terms in the effective crystal field (, and , etc..Barra97 ; MirebeauPRL99 ); and, denotes environmental couplings such as hyperfine, dipolar and exchange interactions.KPark02b ; HillPRB02 For the strictly axial case ( and ), the energy eigenstates may be labeled by the quantum number MS M, which represents the projection of onto the easy axis of the molecule. The energy eigenvalues are then given by the expression M, resulting in an energy barrier separating doubly degenerate (M, integer ) ”up” and ”down” spin states. It is this barrier which results in magnetic bistability and magnetic hysteresis at low temperatures.Angewandte03 ; MRS00 Unlike bulk magnets, however, this hysteresis, which sets in below a characteristic temperature called the blocking temperature TB , is intrinsic to each individual molecule hence the term SMM.
For MQT to occur, one requires some interaction in Eq. (1) which breaks the axial symmetry, thereby mixing ”spin-up” and ”spin-down” states.Angewandte03 ; MRS00 Sources of symmetry breaking include: a finite rhombic term; transverse nuclear or dipolar fields (included in ); or higher order transverse zero-field interactions such as and . While this fundamental requirement for MQT is obvious, in practice, efforts to identify the sources of symmetry breaking in many SMMs have been problematic. In this letter, we present evidence in support of a recently proposed solution to the long standing problem concerning the origin of the transverse interactions responsible for MQT in [Mn12O12(CH3COO)16(H2O)4]2CH3COOHH2O (Mn12-acetate, or Mn12-ac). Mn12-ac has been the most widely studied SMM,Angewandte03 ; MRS00 ; Friedman96 ; Thomas96 ; Peer98 ; HillPRL98 ; HillS903 ; Barra97 ; MirebeauPRL99 ; KPark02b ; HillPRB02 and was the first to show quantum steps in its low-temperature hysteresis loops;Friedman96 ; Thomas96 it also has the highest blocking temperature (T K) of any known SMM.Angewandte03 These characteristics result from the large total spin () of the molecule, and its intrinsically high symmetry (). Indeed, it has long been assumed that the rhombic term in Eq. (1) is zero ( also) for Mn12-ac due to the four-fold symmetry of the molecule.HillPRL98 ; Barra97 ; MirebeauPRL99 For this reason, many groups have conducted extensive searches for other possible sources of symmetry breaking.ChudnPRL01 ; KPark02b ; HillPRB02 ; AmigoPRB02 ; MertesPRL02 ; delBarcoEPL02 ; CorniaPRL02
While high-frequency electron paramagnetic resonance (EPR)Barra97 and neutron studiesMirebeauPRL99 have provided convincing evidence for a fourth-order transverse zero-field term (), such an interaction cannot explain many key experimental factors associated with the observed low-temperature hysteresis loops, e.g. odd-to-even MS MQT steps.ChudnPRL01 For this reason, recent theoretical and experimental efforts have focused on the possible role played by disorder.ChudnPRL01 ; KPark02b ; HillPRB02 ; AmigoPRB02 ; MertesPRL02 ; delBarcoEPL02 ; CorniaPRL02 Indeed, our recent EPR investigations have identified a significant -strain effect (distribution in D of up to ) in typical Mn12-ac crystals,KPark02b ; HillPRB02 while magnetic relaxation measurements by two independent groups have provided clear evidence for distributions in the tunnel splittings in Mn12-ac,MertesPRL02 ; delBarcoEPL02 i.e. there are molecule-to-molecule variations in the magnitudes of the transverse interactions responsible for MQT. Initial attempts to explain these observations considered long range elastic strains, caused by various types of dislocation, thus producing a broad distribution of tunnel splittings via a weak spatially-varying rhombic anisotropy.ChudnPRL01 While the predicted distributions were considerably broader than those observed experimentally,delBarcoEPL02 this theory demonstrated that local disorder-induced rotations of the SMM magnetic axes could unfreeze the odd MQT resonances (odd-to-even MS) that are always seen experimentally. Very recently, on the basis of detailed X-ray studies, Cornia et al. have proposed a more realistic model involving a discrete disorder associated with the acetic acid of crystallization.CorniaPRL02 This disorder also gives rise to a locally varying rhombicity (-strain) and, hence, to a distribution in tunnel splittings. However, the predicted distribution is much narrower in this case.delBarcoEPL02
The present investigation has been motivated by the discrete nature of the disorder suggested by Cornia et al.CorniaPRL02 This model considers just a few variants of the basic Mn12-ac unit six in total, only four of which have symmetry lower than . The situation is further simplified in that the hard and medium axes of three of the four rhombically distorted variants should be aligned along either of two mutually orthogonal directions within the hard plane. These three ”rogue” variants with lower than symmetry (, trans, and in Cornia’s model)CorniaPRL02 account for of the molecules, while the -value for the fourth rogue variant ( cis, of the molecules) is predicted to be weak in comparison to the other three. Thus, EPR measurements as a function of field orientation within the hard plane could, in principle, detect the ”-strain” caused by these three rogue variants of Mn12-ac.
High frequency single crystal EPR measurements were carried out using a millimeter-wave vector network analyzer (MVNA) and a high sensitivity cavity perturbation technique; this instrumentation is described in detail elsewhere.MolaRSI In order to enable in-situ rotation of the sample relative to the applied magnetic field, we employed a split-pair magnet with a 6.2 T horizontal field and a vertical access. Smooth rotation of the entire rigid microwave probe, relative to the fixed field, was achieved via a room temperature stepper motor (with resolution). The Mn12-ac samples were synthesized using standard methods.Lis80 For the angle dependent measurements, a single needle shaped crystal ( mm3) was aligned with the axis of a cylindrical TE011 (49.86 GHz) cavity, such that its magnetic easy axis (needle axis) approximately coincided with the field rotation axis; small mis-alignments are easily accounted for during data analysis (see below). Fixed angle, temperature dependent measurements were carried out for a second crystal (similar dimensions) in a high field magnet at the National High Magnetic Field Laboratory (NHMFL). For this experiment, the sample was placed on the end plate of an oversized cylindrical cavity, and sample alignment was only accurate to within . In all cases, the temperature was stabilized relative to a calibrated Cernox resistance sensor using a combination of heaters and cold helium gas flow.
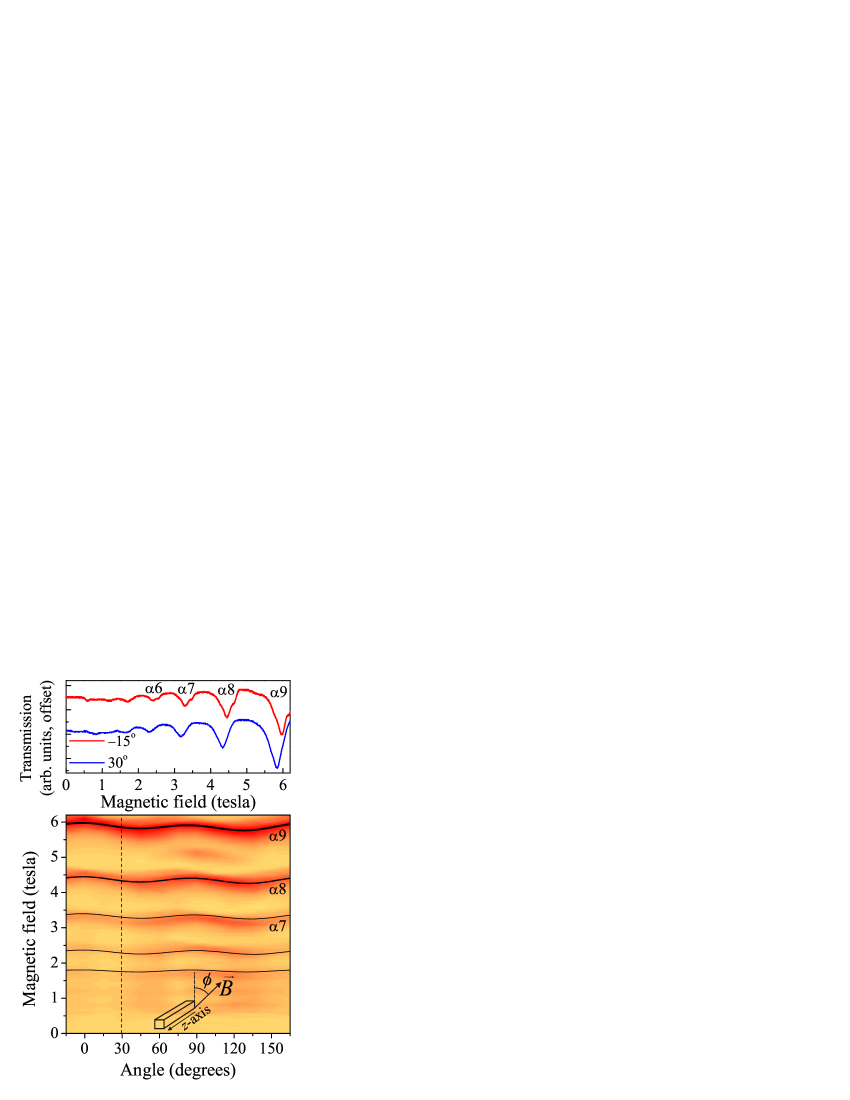
The upper panel of Fig. 1 shows two typical EPR spectra obtained with the field aligned along two different directions within the hard magnetic plane of the sample. The angle is measured relative to one of the edges of the approximately square cross section of the sample (see inset in lower panel). Transmission minima correspond to EPR absorptions, and have been labeled according to the scheme originally adopted in ref. [HillPRL98, ]: resonances correspond to transitions within tunnel-split M zero-field doublets, where the applied field mainly contributes to this tunnel splitting. From this figure, it is immediately apparent that the spectra change dramatically with . First of all, the peak positions shift appreciably, as illustrated by means of the contour plot in the lower panel of Fig. 1, where a pronounced four-fold pattern is seen in the central positions (in field) of the main EPR absorptions. This four-fold pattern is intrinsic to the Mn12 molecule, and can be attributed to a quartic transverse zero-field interaction of the form [=] in Eq. (1). Fits to this angle dependence (solid curves) are consistent with a single value of the coefficient cm-1, in excellent agreement with published neutron studies.MirebeauPRL99 These fits also include a small two-fold correction which is due to unavoidable mis-alignments of the sample’s () easy axis with the field rotation axis, i.e. this effect is not related to any intrinsic transverse anisotropy. We note that the value obtained from this analysis is completely independent of all other parameters in Eq. (1) (with the exception of ) and, therefore, represents the most direct confirmation for the existence of this contribution to the transverse anisotropy in Mn12-ac.
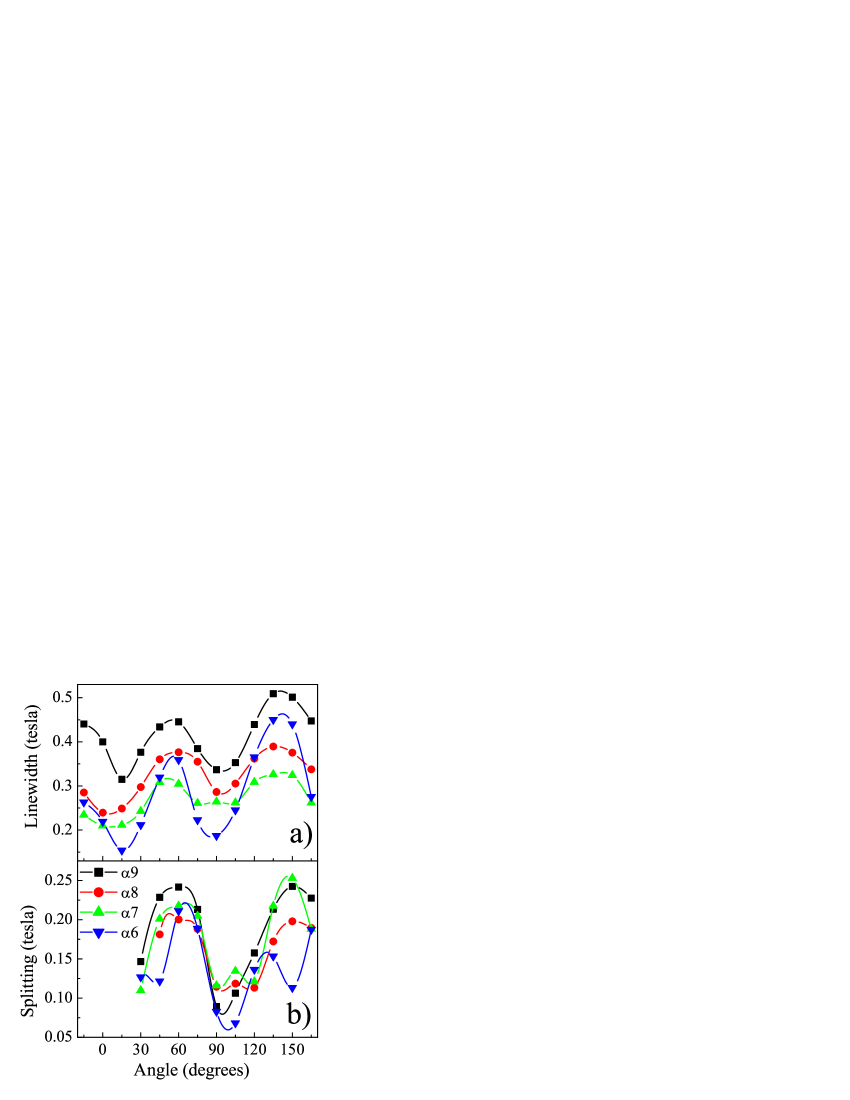
Also apparent in the upper panel of Fig. 1 are shoulders on the high-field sides of the peaks, which are absent in the data. This splitting of the peaks for the hard plane spectra has been seen in several samples, and also by other groups,AmigoPRB02 ; CorniaPRL02 but has never been studied systematically. The -dependence of this splitting is shown in Fig. 2 for the first four EPR peaks in Fig. 1 (): Fig. 2a plots the full-widths at half maximum (FWHM), deduced graphically, for each of the resonances; Fig. 2b plots the splitting of the individual peaks obtained by fitting two Gaussians to each resonance. The data in Fig. 2b are limited in angle range to between and because the slight sample mis-alignment causes the shoulder to move outside of the available field window for the smallest values (see Fig. 1).
Both sets of curves in Fig. 2 exhibit the same four-fold angle dependence. However, the origin of this effect is related to a disorder-induced two-fold rhombic distortion, as we now explain. For any individual molecule, the quadratic term in Eq. (1) [] produces a two-fold pattern for field rotations in the hard plane. Thus, an intrinsic quadratic anisotropy of this form (i.e. same for all molecules) would produce a two-fold -dependent pattern in the hard axis EPR peak positions, contrary to the observed four-fold shifts (Fig. 1). However, in the case of Cornia’s model (involving solvent disorder)CorniaPRL02 one must average over the disorder. As discussed above, one expects the , trans, and ”rogue” Mn12-ac variants to exhibit the strongest evidence for the disorder-induced rhombic anisotropy. However, because each acetic acid of crystallization can occupy one of four equatorial positions equally spaced ( apart) about the easy-axis of the molecule, each of these variants will be further sub-divided into four geometric isomers, related through rotations. The result is a 50/50 mixture of molecules having their hard axes oriented along one of two orthogonal directions within the hard plane. Since a rotation is equivalent to a change in the sign of E, the effect of the disorder will be to produce a splitting, or broadening of the EPR peaks (not an overall shift in the central moment), i.e. opposite signs of E produce opposing shifts in the EPR peak positions. Furthermore, the -dependence should now exhibit a four-fold behavior, since the splitting/broadening depends on the difference between two phase shifted two-fold patterns. In order to observe a two-fold behavior, one would have to be able to selectively probe a sub-set of the molecules with aligned hard axes. We note that such studies would be possible below the blocking temperature.delBarco03
From the angle dependence in Fig. 2, we can deduce that the hard axes for the , trans, and rogue Mn12-ac variants are oriented somewhere between , and between , relative to one of the square edges of the sample; the hard axes correspond to directions of maximum linewidth/splitting. Assuming that the and directions correspond to the principal crystallographic a and b axes, then our findings appear to be in excellent agreement with Cornia’s model (which predicts relative to a and b).CorniaPRL02 These values are also in excellent agreement with recent magnetic measurements.delBarco03 From the four-fold pattern in Fig. 1, we see that the four-fold axes (hard and medium) are approximately locked to the principal a and b directions, i.e. the maxima and minima occur along , , etc.. Thus, the magnetic axes associated with the quadratic and quartic interactions are not aligned in a simple way. However, this is not necessarily to be expected, since the interaction is dominated by the symmetry of the Mn12O12 molecule, whereas the interaction is influenced by the peripheral solvent molecules.
In addition to -strain, Cornia’s model predicts slight variations in for each of the rogue Mn12-ac variants,CorniaPRL02 thereby suggesting one possible explanation for the -strain which we have previously reported.KPark02b ; HillPRB02 However, this -strain may also account for the asymmetry seen in the EPR peaks in Fig. 1. Larger -values will tend to shift pairs of -strain split-peaks to higher fields. Thus, it is conceivable that the central portion of the EPR peaks is comprised of several overlapping split peaks, whereas the shoulder corresponds to the upper split-peak of one of the rogue variants which is just resolved from the main peak. Based on the variations in linewidth and the maximum splitting, we can place an upper bound on the -values for the rogue molecules of cm-1. This value is about a factor of three greater than the maximum value predicted by Cornia et al.,CorniaPRL02 and is also in excellent agreement with magnetic relaxation measurements.delBarcoEPL02 ; delBarco03
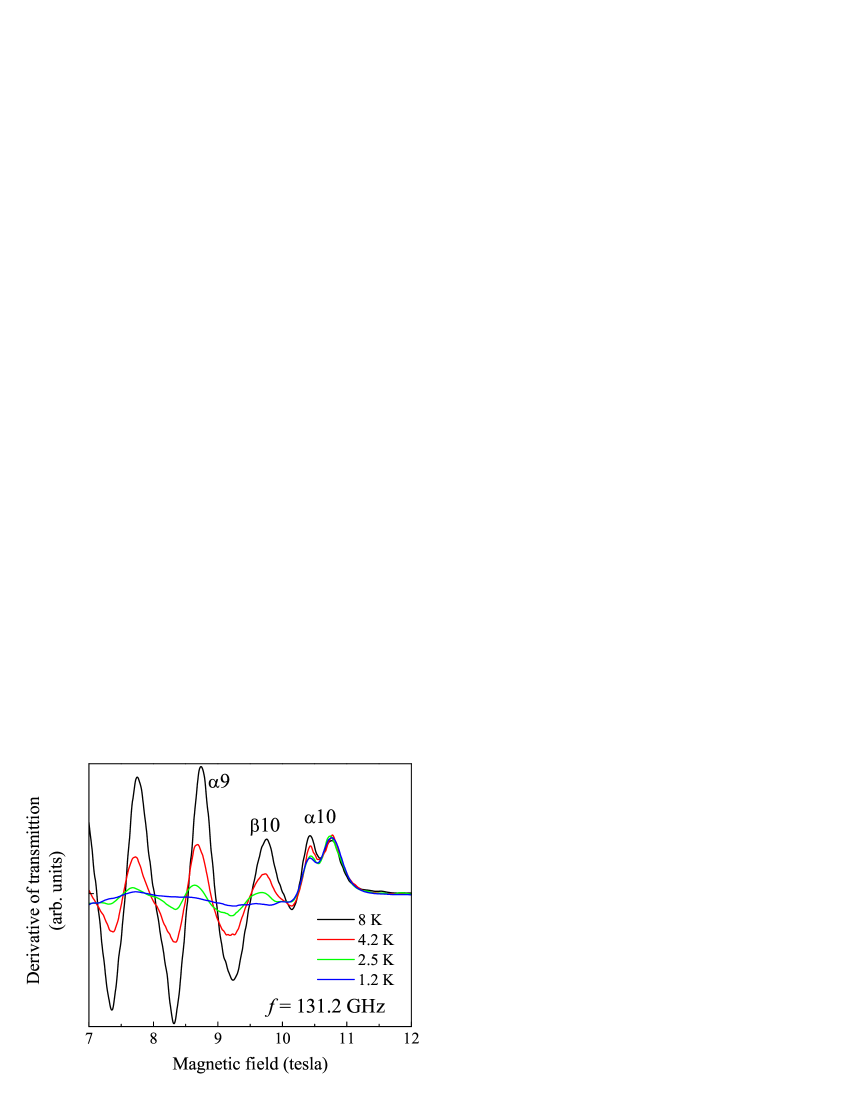
Finally, in Fig. 3, we show high-field temperature dependent data for a second sample. The field was oriented along for these studies, i.e. close to the hard and medium axes for the , trans, and rogue Mn12-ac variants. Derivatives are plotted so as to accentuate the splitting of the resonance (not seen in Fig. 1), which corresponds to the transition from the ground state of the molecules. Upon cooling, the splitting of the resonance persists, while all of the other peaks vanish; for the two lowest temperatures, the split-peaks perfectly overlap. This proves, beyond doubt, that the lineshape is the result of distinct Mn12-ac variants with different and values. We note that the resonance has previously been attributed to disorder in a separate EPR study by Amigo et al.AmigoPRB02 However, the data in Fig. 3 strongly suggest that corresponds to an excited state of the molecule, since it vanishes as T. The origin of these transitions (which we have previously reportedHillPRL98 ) will be discussed in a separate publication.HillS903
In summary, we present single crystal EPR data for field rotations within the hard-plane of Mn12-ac. A clear four-fold variation in the resonance positions can be attributed to an intrinsic fourth order transverse anisotropy (). Meanwhile, a four-fold variation of the EPR lineshapes confirms a recently proposed modelCorniaPRL02 wherein solvent disorder induces a locally varying quadratic anisotropy (). We note that very recent magnetic relaxation experiments clearly indicate that it is probably this -strain which dominates the magnetic quantum tunneling in Mn12-ac.delBarco03
We thank A. Kent, E. delBarco, G. Christou and D. Hendrickson for useful discussions. This work was supported by the NSF (DMR0103290, DMR0196430 and DMR0239481); the NHMFL is supported by the State of Florida and the NSF under DMR0084173. S. H. would like to thank the Research Corporation for financial support.
References
- (1) D. Gatteschi and R. Sessoli, Angew. Chem. 42, 268 (2003).
- (2) G. Christou et al., MRS Bulletin 25, 66 (2000).
- (3) J. R. Friedman et al., Phys. Rev. Lett. 76, 3830 (1996).
- (4) L. Thomas et al., Nature 383, 145 (1996).
- (5) J. A. A. J. Perenboom et al., Phys. Rev. B 58, 330 (1998).
- (6) W. Wernsdorfer and R. Sessoli, Science 284, 133 (1999).
- (7) W. Wernsdorfer et al., Nature 416, 406 (2002).
- (8) M. N. Leuenberger and D. Loss, Nature 410, 789 (2001).
- (9) R. S. Edwards et al., cond-mat/0302052 (unpublished).
- (10) S. Hill et al., Phys. Rev. Lett. 80, 2453 (1998).
- (11) A. L. Barra, D. Gatteschi, and R. Sessoli, Phys. Rev. B 56, 8192 (1997).
- (12) I. Mirebeau et al., Phys. Rev. Lett. 83, 628 (1999).
- (13) K. Park et al., Phys. Rev. B 66, 144409 (2002), also Phys. Rev. B 65, 14426 (2002).
- (14) S. Hill et al., Phys. Rev. B 65, 224410 (2002).
- (15) E. M. Chudnovsky and D. A. Garanin, Phys. Rev. Lett. 87, 187203 (2001), also Phys. Rev. B 65, 094423 (2002).
- (16) R. Amigó et al., Phys. Rev. B 65, 172403 (2002).
- (17) K. M. Mertes et al., Phys. Rev. Lett. 87, 227205 (2001).
- (18) E. del Barco et al., Europhys. Lett. 60, 768 (2002).
- (19) A. Cornia et al., Phys. Rev. Lett. 89, 257201 (2002).
- (20) M. Mola et al., Rev. Sci. Inst. 71, 186 (2000).
- (21) T. Lis, Acta Cryst. B 36, 2042 (1990).
- (22) E. del Barco et al. arXiv:cond-mat/0304206.
Figure captions
FIG. 1. Upper panel: typical EPR spectra obtained at 49.86 GHz and T K, with the field aligned along two different directions within the hard magnetic plane of the sample (indicated in the figure); the angle is measured relative to one of the square edges of the sample. The resonances have been labeled according to a previously developed scheme.HillPRL98 Lower panel: color contour plot illustrating the angular variation of the peak positions in the upper panel; data were taken at intervals (red indicates strong absorption). The dashed line corresponds to the blue curve in the upper panel, while the -axis corresponds to the red curve. The inset depicts the geometry of the experiment.
FIG. 2. Hard plane angular variation of (a) the linewidths, and (b) the line splitting, for the four strongest EPR peaks in Fig. 1 ( to ).
FIG. 3. Temperature dependence of the derivatives of high field spectra with the field applied at within the hard plane; the temperatures are indicated in the figure.