Role of finite layer thickness in spin-polarization of GaAs 2D electrons in strong parallel magnetic fields
Abstract
We report measurements and calculations of the spin-polarization, induced by a parallel magnetic field, of interacting, dilute, two-dimensional electron systems confined to GaAs/AlGaAs heterostructures. The results reveal the crucial role the non-zero electron layer thickness plays: it causes a deformation of the energy surface in the presence of a parallel field, leading to enhanced values for the effective mass and g-factor and a non-linear spin-polarization with field.
pacs:
73.50.-h, 71.70.Ej, 73.43.QtThe spin-polarization of an interacting, dilute two-dimensional (2D) carrier system has been of interest for decades. It has long been expected that because of Coulomb interaction the product , which determines the spin susceptibility of the 2D system, increases as the 2D density () is lowered and eventually diverges as the system makes a transition to a ferromagnetic state at sufficiently low tanatar ; attaccalite ( and are the carrier Landé g-factor and effective mass, respectively). Recently, there has been much renewed interest in this problem, thanks to the availability of high-quality dilute 2D systems, and the belief that it may shed light on the controversial issue of a metal-insulator transition in 2D abrahams . A technique commonly used to study the spin-polarization is to measure the response of the 2D system to a tilted or parallel magnetic field okamoto ; tutuc ; vitkalov ; pudalov ; tutuc02 ; proskuryakov ; noh ; etienne . The results of some of these measurements tutuc02 ; proskuryakov ; noh , however, appear to be at odds with what is theoretically expected tanatar ; attaccalite for a dilute, interacting 2D system that is otherwise ideal, i.e., has zero layer thickness and is disorder-free. In particular, when is deduced from parallel magnetic field at which the 2D system becomes fully spin-polarized, then the experimental results for GaAs 2D electrons tutuc02 and holes proskuryakov ; noh suggest a decreasing value of with decreasing , opposite to the theoretical predictions.
Here we report a combination of measurements and calculations for the parallel magnetic field-induced spin-polarization of 2D electrons at the GaAs/AlGaAs heterojunction. The results highlight the importance of the finite thickness of the electron layer and the resulting deformation of the energy surface , where is the in-plane wave vector, that occurs in the presence of a strong parallel field. This deformation induces an enhancement of both and and leads to a non-linear spin-polarization in a parallel field. We find that, once the effect of the finite layer thickness and interaction is taken into account, there is reasonable agreement between the experimental data and calculations.
We used five samples from three different wafers (A, B, and C). The samples were all modulation-doped GaAs/AlGaAs heterojunctions with in the range to cm-2. Their low-temperature mobility varied depending on the sample and ; at cm-2, it ranged from about to cm2/Vs. Samples were patterned in either van der Pauw or Hall bar shapes, and were fitted with back- or front-gates. To tune in samples A, B1, and B2, following illumination with a red LED, we used front-gate bias; for B3 (in the range cm-2) and C we used back-gate bias and no illumination. For B3, the highest density ( cm-2) was obtained after illumination, followed by back-gating to reduce to cm-2. Measurements were done down to a temperature of 30 mK, and a rotating platform was used to tune the angle between the applied magnetic field and the sample plane.
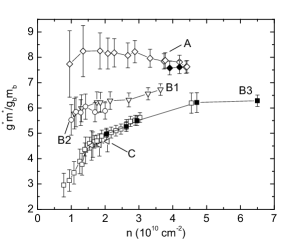
Figure 1 summarizes our data taken on the different samples. Plotted are the values of , determined from the parallel magnetic field, , at which the 2D system becomes fully spin polarized ( and are the band effective mass and Landé g-factor for GaAs electrons; is the free electron mass). The parallel magnetic field () leads to the formation of two energy subbands, one for each spin, and separated by the Zeeman energy, , where is the Bohr magneton. The 2D system becomes fully spin-polarized above a field at which equals the Fermi energy. The equality leads to an expression for : , from which we determine that are plotted in Fig. 1.
The procedures we have used to experimentally determine have been described elsewhere tutuc ; tutuc02 ; here we give a brief summary. We determine from two independent sets of experiments: Shubnikov - de Haas (SdH) measurements in a nearly parallel magnetic field, and magnetoresistance measurements in a strictly parallel field. In the first type of experiment, we apply a constant magnetic field () whose initial direction is parallel to the 2D electron plane, and then slowly rotate the sample while recording the sample resistance as a function of the angle between the 2D plane and the field direction. If we limit ourselves to small angles, the field’s parallel component () remains almost constant (equal to typically to better than 1) during the rotation, while its perpendicular component () changes sufficiently to probe the SdH oscillations. We then Fourier analyze the SdH oscillations to obtain the populations of the two spin subbands. These densities provide a direct measure of the spin-polarization of 2D electron system and allow us to determine the field above which the system becomes fully spin-polarized. In the second type of experiment we measure the sample resistance as a function of a magnetic field applied strictly in the 2D plane. As shown elsewhere tutuc ; tutuc02 , the in-plane magnetoresistance shows a marked change in its functional form at the field . For a given sample, the value of obtained from the two types of experiments (open and closed symbols in Fig. 1) are in agreement.
Data of Fig. 1 illustrate that the product , deduced from as described in the last two paragraphs, deviates substantially from what is expected for an ideal, interacting 2D electron system, namely a monotonically increasing as is lowered tanatar ; attaccalite . The data also reveal that the measured is sample dependent and not a unique function of . A possible reason for this non-uniqueness may be the sample disorder that indeed varies between different samples. An examination of the data, however, argues against this hypothesis: considering the data at a given density, it is clear that there is no simple trend linking the sample disorder, as deduced from the low-temperature mobility, to the measured . As we demonstrate below, another factor that renders the experimental 2D electrons non-ideal, namely their finite layer thickness, appears to be responsible for the sample-dependent and the difference between the observed and expected density dependence of .
In the presence of a large , when the magnetic length () becomes comparable to or smaller than the thickness of the electron layer, the energy surface of the electrons gets deformed in the in-plane direction perpendicular to . The deformation leads to an increase of the in-plane effective mass, , which, in second order perturbation theory, is given by stern
| (1) |
where the sum runs over all excited subbands and is the quantization axis das sarma . Data of Fig. 2 provide an experimental demonstration of this effect in our samples. In Fig. 2(a) we show, as a function of , the measured magnetoresistance of samples A and B1, both at a density of cm-2. The magnetoresistance for each sample shows a clear change in its dependence on at a field marked by a vertical arrow as . As demonstrated previously tutuc ; tutuc02 , the field marks the onset of full spin-polarization. Note in Fig. 2(a) that is larger for sample B1 than A even though they have the same density. We also measured in the two samples as a function of , as shown in Fig. 2(b) footnote1 . We determined from the temperature dependence of the amplitude of the SdH oscillations, measured as the sample was slowly rotated in an almost parallel field. We performed a standard analysis, fitting the amplitude of the SdH oscillations () to the Dingle formula, , where and . It is clear in Fig. 2(b) that for both samples exhibits a strong enhancement with increasing , consistent with Eq. (1). Moreover, has a larger enhancement for sample A than for B1. This stronger enhancement correlates with the smaller measured for sample A. We believe that the main difference between the two samples in Figs. 2(a) and (b) is that sample A has a larger layer thickness: because of a decrease in subband separation, the larger thickness leads to the larger enhancement of , consistent with the smaller for sample A compared to B1.
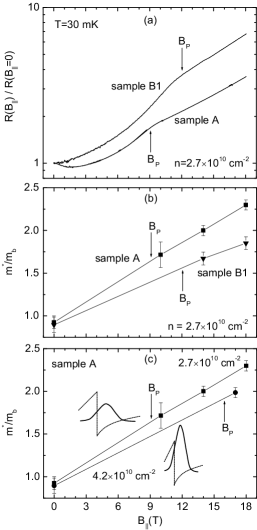
To further substantiate the connection between layer thickness and enhancement, in Fig. 2(c) we show data for sample A at a higher carrier density of cm-2. The measured enhancement is smaller for the higher state. This is consistent with layer thickness being responsible for the enhancement: as we use a more positive front-gate bias to increase in this sample, the electron wavefunction is squeezed more towards the interface so that the layer thickness is reduced [see the insets to Fig. 2(c)], consistent with the smaller measured enhancement.
In order to quantitatively understand the experimental data, we have done self-consistent density-functional calculations of the subband structure in the presence of . We used the recent parameterization of the exchange-correlation energy by Attaccalite et al. attaccalite . The energy and length scales for electrons in a semiconductor are characterized by the effective Rydberg and the Bohr radius according to the effective mass and the dielectric constant of the material. In our calculations it was crucial that was determined as a function of from the self-consistently calculated subband dispersion . These calculations confirm the qualitative trends expected from Eq. (1). Band structure effects beyond the effective-mass approximation are not consisdered here. We have checked that these effects are of minor importance winkler93 . In the calculations, the field is defined as the smallest value of for which the fully spin-polarized configuration has the lowest total energy.
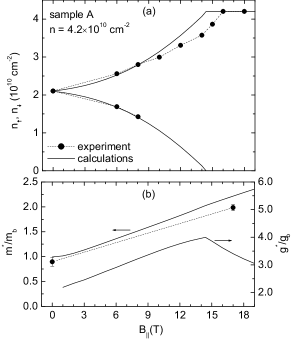
Figure 3 provides an example of the results of the calculations for cm-2; shown are (a) the spin-subband densities and , (b) , and (c) , as a function of . The calculations were done using the parameters of sample A (spacer thickness and barrier height), assuming a p-type background doping of cm-3, and a binding energy of 90 meV for the dopants (Si) in the barrier. These are reasonable values, consistent with our estimate of the unintentional (residual) doping in our molecular beam epitaxy system and the binding energies quoted in the literature schubert . The calculations predict a non-linear but smooth increase of the spin-polarization as a function of .
In Figs. 3 (a) and (b) we have also included our measured spin-subband densities and , determined from SdH oscillations in a nearly parallel magnetic field. Overall, there is good agreement between the experimental data and calculations for both spin-polarization and as a function of . The calculated T agrees well with the measured T, and is much smaller than T expected for an interacting GaAs 2D electron system with zero layer thickness at cm-2 (see dashed curve in Fig. 4).
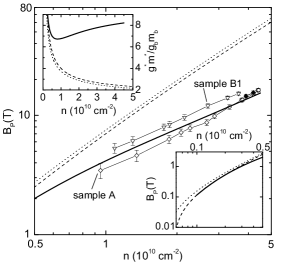
To understand the density dependence of for a given sample, we also calculated as a function of , which is tuned either with a front- or back-gate bias. For these calculations, we kept the sample parameters fixed, and only changed the boundary conditions for the Hartree potential thus simulating the effect of the gate bias. The results for the case where the front-gate is used are shown in Fig. 4 (solid curve), along with the experimental data for samples A and B1. There is reasonable agreement between the calculations and the experimental data footnote2 .
In Fig. 4 we also plot vs. (dashed curve) calculated based on Ref. attaccalite where an interacting 2D electron system with zero layer thickness is assumed, as well as (dotted curve) determined from the calculated spin susceptibility in the limit attaccalite and assuming a linear spin-polarization as a function . Three noteworthy trends are observed in Fig. 4. First, for cm-2 the dashed and dotted curves are very close to each other, meaning that the spin polarization of an ideal, zero-thickness 2D system is approximately (within 5%) linear with in this density range or, equivalently, the Zeeman splitting can be expressed well in terms of an effective g-factor independent of . This implies that the finite layer thickness is the key factor that leads to the observed non-linearity in spin-polarization with and the resulting reduction of . The mechanism responsible for this non-linearity can be summarized as follows: induces an increase of due to the finite layer thickness. This has a twofold effect. It directly reduces because . Furthermore, the increase of reduces the effective Bohr radius and thus increases , the average electron spacing measured in units of effective Bohr radius. The increase in in turn yields an increase of due to the Coulomb interaction. Second, the solid and dashed curves merge as the density is lowered, consistent with the expectation that, because of the smaller , the finite layer thickness induced enhancement becomes less important. Third, at ultra-low densities the dashed and dotted curves start to diverge (see the lower inset), implying that the interaction alone can induce a significant non-linearity of spin-polarization with in a very dilute 2D system attaccalite .
Finally, if we use the expression to determine from as frequently done in the literature, we obtain the curves shown in Fig. 4 upper inset. These plots emphasize that ”” deduced from for a 2D system with finite layer thickness (solid curve) is significantly enhanced with respect to the ideal 2D system and can show a non-monotonic dependence on . The results therefore caution against extracting values for in the limit of zero magnetic field from measurements of at large parallel fields zhu . Moreover, and are not unique functions of ; they depend on the electron layer thickness which in turn depends on sample parameters and experimental conditions.
We thank NSF and DOE for support, D.M. Ceperley and S. Moroni for helpful discussions. Part of this work was done at NHMFL; we thank T. Murphy and E. Palm for support.
References
- (1) B. Tanatar and D.M. Ceperley, Phys. Rev. B39, 5005 (1989), and reference therein.
- (2) C. Attaccalite et al., Phys. Rev. Lett. 88, 256601 (2002).
- (3) E. Abrahams et al., Rev. Mod. Phys. 73, 251(2001).
- (4) T. Okamoto et al., Phys. Rev. Lett. 82, 3875 (1999).
- (5) E. Tutuc et al., Phys. Rev. Lett. 86, 2858 (2001).
- (6) S.A. Vitkalov et al., Phys. Rev. Lett. 87, 086401 (2001); A.A. Shashkin et al., Phys. Rev. Lett. 87, 086801 (2001).
- (7) V.M. Pudalov et al., Phys. Rev. Lett. 88, 196404 (2002).
- (8) E. Tutuc et al., Phys. Rev. Lett. 88, 036805 (2002).
- (9) Y.Y. Proskuryakov et al., Phys. Rev. Lett. 89, 076406 (2002).
- (10) Hwayong Noh et al., cond-mat/0206519.
- (11) E.P. De Poortere et al., Phys. Rev. B66, 161308 (2002).
- (12) F. Stern, Phys. Rev. Lett. 21, 1687 (1968).
- (13) The role of finite layer thickness in determining the -dependence of the magnetoresistance of 2D carrier systems was recently reported [S. Das Sarma and E.H. Hwang, Phys. Rev. Lett. 84, 5596 (2000)].
- (14) In our measurements, we chose so that only one spin subband is occupied. In this case the Landau levels are simply separated by .
- (15) R. Winkler and U. Rössler, Phys. Rev. B48, 8918 (1993).
- (16) E. Schubert and K. Ploog, Phys. Rev. B30, 7021 (1984).
- (17) In both experimental data (Fig. 1) and calculations (not shown), decreases less quickly when a back-gate (sample B3), rather than a front-gate (samples A and B1), is used to decrease . This is consistent with the finite layer thickness effect. When we use a front-gate to reduce the density, the wavefunction gets thicker while the opposite is true when the back-gate is used.
- (18) Also see J. Zhu et al., cond-mat/0301165.