Absence of gross inhomogeneity in HTS cuprates
Abstract
Recent scanning tunnelling microscopy (STM) studies on Bi2Sr2CaCu2O8+δ (Bi-2212) revealed the presence of severe inhomogeneity with length scale , the coherence length. Other studies have been interpreted in terms of mesoscale or nanoscale phase segregation. Here we analyze heat capacity and NMR data on Bi-2212 and (Y,Ca)Ba2Cu3O7-δ and find no evidence for phase segregation or gross inhomogeneity. For Bi-2212 the coherence scale increases with doping from 5 to 17 and the hole density inhomogeneity decreases from 0.028 to 0.005 holes/Cu. We conclude that STM measurements considerably overstate the inhomogeneity in bulk Bi-2212.
The possible importance of inhomogeneity in the physics of high temperature superconducting (HTS) cuprates has been stressed since the earliest investigations of these materials. Of necessity they involve chemical disorder as substitutional dopants in the parent compounds are usually required to introduce carriers. Frequently observed forms of inhomogeneity include substitutional, interstitial, reconstructive, twinning and incommensuration[1, 2, 3, 4]. Despite this potentially high degree of structural and compositional disorder (which is quite variable from one compound to another) the cuprates display universal phase behaviour[5, 6, 7]. Their physical properties vary systematically with doping in very much the same way from one compound to another provided simply that the substitutional disorder lies outside of the active CuO2 planes. This, of course, reflects the strongly two-dimensional nature of the electron dynamics in the CuO2 planes. More fundamentally however, inhomogeneity of intrinsic electronic origin has been discussed widely, most notably various nanoscale stripe phases in which the background spins separate spatially from doped charges to form quasi-one-dimensional structures[8]. There is thus much scope in HTS materials for significant extrinsic and intrinsic spatial inhomogeneity.
Recent high-resolution scanning tunnelling microscope (STM) studies[9, 10] at 4.2K have provided dramatic evidence of electronic inhomogeneity on the surfaces of Bi-2212 in the superconducting (SC) state. These reveal a patchwork of contrasting regions with length scale 14, comparable with the coherence length , some having well-defined coherence peaks and others having strongly-reduced coherence peaks shifted to higher energies similar to the features of the pseudogap above [11]. The 50% spread in the magnitude of the SC energy gap, , was shown to correlate with a similar spread in the local density of states. These variations were attributed to a distribution of hole concentration, , arising from oxygen disorder and a FWHM spread of 0.08 holes/Cu was inferred by comparing the distribution in SC gap with the -dependence of deduced from ARPES. It was suggested that such inhomogeneity may be quite general and may reflect ”an intimate relationship with superconductivity” in the cuprates[9]. However, it cannot be presumed that such inhomogeneity is generic nor that it even reflects the nature of the electronic state. STM is strictly a surface probe susceptible to just the outermost CuO2 layer. Little is known about surface reconstruction in this material, the location of additional oxygen atoms in the cleaved BiO layer or the role of Bi atoms incorporated into the underlying SrO layer. We argue here from thermodynamic measurements and NMR data that the bulk electronic state is much more homogeneous than is suggested by the STM results which, by implication, are an artifact of a perturbed surface.
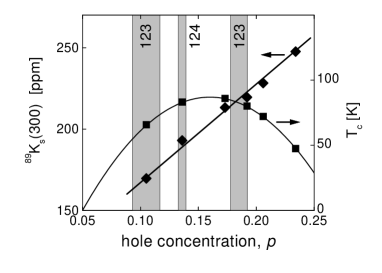
A quantitative measure of the degree of doping inhomogeneity in the HTS cuprates can be inferred from NMR linewidths. NMR is a bulk probe which is sensitive to the local electronic state near the probe nucleus. We show in Fig. 1 the 89Y Knight shift, , at 300K for Y0.8Ca0.2Ba2Cu3O7-δ (Y,Ca-123) at six different values of and spanning the SC phase diagram[12]. The values were obtained from thermopower measurements and values are also plotted. As is well known, the Knight shift varies systematically with doping and the figure reveals a slope of 580 ppm/hole. Doping inhomogeneity will therefore induce a line width of 580 ppm. Other contributions, such as local moments[13] and the effect of disorder on the chemical shift will also add to the linewidth. We may thus use the observed linewidth to determine the doping inhomogeneity (if all the linewidth came only from ).
The vertical bands in the figure show the FWHM in the hole concentration determined in this way[14]. We have used the magic-angle-spinning data of Balakrishnan et al.[15] for YBa2Cu3O7-δ (Y-123) and of Williams et al.[16] for YBa2Cu4O8 (Y-124). In the last case the linewidth is extremely narrow, about 100 Hz, giving 0.0069. It is clear that this class of HTS is remarkably homogeneous yet they exhibit the same generic thermodynamic and ground-state behavior as Bi-2212[17].
Heat capacity studies on HTS cuprates provide a number of potential checks against electronic inhomogeneity. These include (i) the value of the specific heat coefficient, at =0, (ii) its value, , at high temperature in the normal state, (iii) the magnitude and doping dependence of the jump, , in at and (iv) the transition width. For example, mesoscale segregation into SC and normal metallic phases will result in normal states in the gap manifested by a non-zero value of at =0. Progressive segregation with overdoping, for example, will see (0) rising steadily, filling out the -wave gap. On the other hand, mesoscale segregation into insulating and normal metallic phases will result in a progressive reduction in the high-temperature value of as states are removed. Here we focus on the thermodynamic data for Bi-2212 because this is the system in which the STM inhomogeneity was observed. To this we add data for Y,Ca-123, a very different system, to show that our observations are generic to the cuprates.
Ceramic samples ( 2 gm) of Bi2.1Sr1.9CaCu2O8+δ[18] and Y0.8Ca0.2Ba2Cu3O7-δ[19] were synthesized using standard solid-state reaction and were oxygen loaded by slow cooling and annealing for many days at 325∘C in flowing oxygen. The electronic heat capacity was measured using a high-precision differential technique described elsewhere[20]. The samples were then alternately annealed and quenched into liquid nitrogen and the heat capacity remeasured so as to track the thermodynamic state as a function of progressively depleted oxygen content. Changes in oxygen stoichiometry were determined from the mass changes and these concurred rather precisely with changes in the phonon specific heat. Values of were determined from values using the approximate parabolic phase curve, , given by[5]
| (1) |
Similar studies have correlated such values of with the thermopower for both Bi-2212[21] and (Y,Ca)-123[22].
Fig. 2 shows a series of curves for each sample at closely spaced -values from deeply underdoped to deeply overdoped. Dashed curves denote optimal doping where maximises while the thick curves denote critical doping (=0.19) where the pseudogap abruptly closes. Apart from small impurity-induced upturns for 10 K remains close to zero across the entire doping range 0.084p0.23 in Y-123 and 0.13p0.21 in Bi-2212, while the values of at high temperature are constant, independent of doping and characteristic of a uniform normal metal. These observations rule out the two types of mesoscale segregation discussed above. We note that the 17O Knight shift in overdoped Y,Ca-123 also approaches zero at =0[12] in agreement with the thermodynamic data and independently confirming the absence of unpaired quasiparticles. Significant gap filling in the single layer cuprates Tl-2201[23] and La-214[24] only occurs in the most heavily overdoped region p0.24. This may reflect the increased role of pair breaking relative to a rapidly decreasing superconducting gap, and does not necessarily indicate segregation.
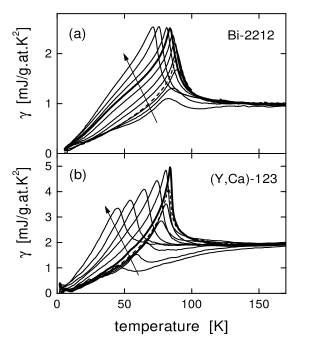
Fig. 2 also reveals rather sudden changes in with doping. The jump, , at the transition changes only slowly across the deeply overdoped region but, starting at =0.19, the magnitude of falls very rapidly with further reduction in doping. Adjacent curves are separated by about 0.008 and the observed sudden collapse of the specific heat anomaly suggests that any spread in doping state arising from nanoscale inhomogeneity must be less than this value. Consistent with this inference the transition widths remain quite narrow and we now focus on this issue in more detail.
A finite transition width may arise from a spread, , in doping over regions (due for example to a spread, , in local donor density, ). Here,
| (2) |
which falls to a minimum at optimum doping = = 0.16. On the other hand a finite transition width independent of will result from inhomogeneity on a much shorter length scale, the coherence length, due to effects [25, 26, 27]. In the thermodynamic limit the coherence length, , diverges as according to the power law = , where =0.67 ( 2/3) for 3D-XY fluctuations. Where the system is inhomogeneous this divergence is cut off by a length scale which is presumed by several authors[25, 26, 27] to be the spatial length scale of the inhomogeneity. As a consequence the divergence of critical fluctuations is suppressed within
| (3) |
It is immediately apparent that, if as inferred from STM[9, 10], then the transition broadening must be comparable to the magnitude of , which is clearly not the case. In fact, typical transition widths of 2-3K require that 10. For any doping state we can estimate the transition width from the finite cut-off of the fluctuation-induced heat capacity as and we will see that it is indeed small.
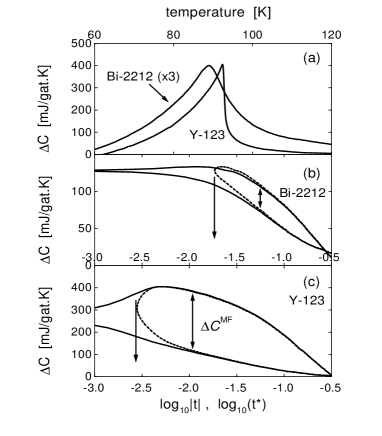
Fig. 3(a) shows the specific heat near of Bi-2212 and pure YBa2Cu3O6.92, both at a similar doping state . In the 3D-XY model the logarithmic divergence of the specific heat near is given by = + for 0 and for 0. Here is the mean field step, and is the coherence volume[28]. A semilog plot of versus gives two parallel lines offset by the mean-field step, . In practice this plot (shown in Fig. 3(b) for Bi-2212 and in Fig. 3(c) for Y-123) exhibits negative curvature for sufficiently small due to the finite-size cut-off in critical fluctuations or other sources of broadening. The effect of a spread in may be modelled by replacing t by in the above expressions for [26]. This is illustrated in Figs. 3(b) and (c) by selecting values of the half-width that just avert negative curvature. Since and the measured broadening yields a lower limit to and an upper limit to (eqs. 2,3). From the figures one finds = 0.018 and = 34 mJ/g.at.K for Bi-2212; and = 0.0028 and = 266 mJ/g.at.K for YBa2Cu3O6.92. These values for translate to 16 and 50 , respectively, values which are very much larger than those implied by the STM results.
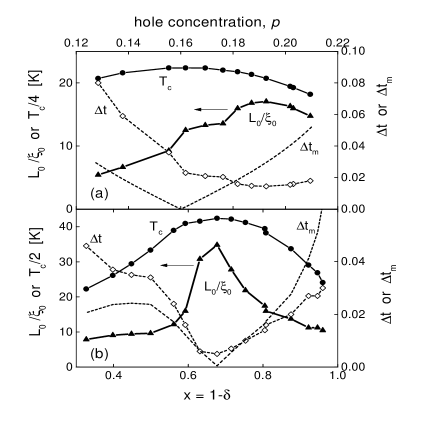
The same analysis may be carried out for each investigated doping level in Y0.8Ca0.2Ba2Cu3O7-δ and in Bi-2212. Fig. 4 shows the measured broadening and the corresponding lower limit to plotted as a function of in the case of Bi-2212 and of oxygen content, , for (Y,Ca)-123. In the former case lower-limit values of / range from 17 at critical doping ( = 0.19) down to 5 in the most heavily underdoped samples. For (Y,Ca)-123, though less than for pure Y-123, values of / are still as high as 35. Even in the most extreme cases the length scale is almost an order of magnitude longer than that inferred from the STM studies. We also show in Fig. 4 obtained from eq. (2) using = 0.005 for Bi-2212 and = 0.01 for (Y,Ca)-123. In the latter case follows rather well across the phase diagram indicating a spread in oxygen content of 0.01 for this compound. In Bi-2212 the transition width does not correlate with , confirming the existence of short-length-scale inhomogeneity. Nevertheless we can conclude that the spread in p does not exceed 0.005 at p= 0.21 and 0.028 at p=0.13, significantly less than the value inferred from the STM data.
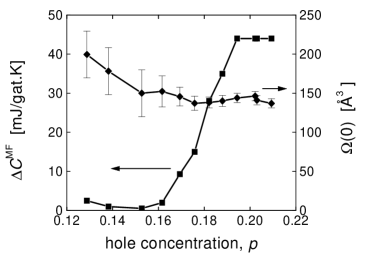
We plot in Fig. 5 the magnitude of the deduced mean-field step, , for Bi-2212. This remains rather constant on the overdoped side but falls extremely sharply at = 0.19 as the pseudogap opens and, remarkably, is essentially zero by optimal doping. A mere change of = 0.03 results in the complete collapse to zero of the mean-field step. This abrupt change again underscores the degree of bulk electronic homogeneity that must be present, even in the case of Bi-2212. With 0 for 0.16 the specific heat anomaly becomes symmetric about because its weight arises from critical fluctuations. We note that there is no significance in the fact that the mean-field step reaches zero at . This is not the case in Y-123 and we expect that the collapse in would be even more abrupt in a system with weaker interlayer coupling than Bi-2212. The coherence volume, , is also shown in the figure. The values are consistent with 17 and 0.5 .
We conclude that specific heat and NMR measurements indicate levels of inhomogeneity much lower than those inferred from STM experiments. In the doping range considered there are no phase-separated ”normal” or ”insulating” regions coexisting with superconductivity. Y-123 and Bi-2212 reveal very narrow thermodynamic features, such as the jump in , which change abruptly with doping indicating a spread in local hole concentration no more than 0.01. Such features, found also in Y1-xCaxBa2Cu3O7-δ, Tl0.5Pb0.5Sr2Ca1-xYxCu2O7 and in La2-xSrxCuO4, are generic to the cuprates and suggest (at least for 0.125) a remarkable degree of bulk electronic homogeneity in spite of considerable disorder in the non-CuO2 layers. Analysis of critical fluctuations near indicates a spread of local donor densities no greater than 0.01 for Y1-xCaxBa2Cu3O7-δ and 0.02 for Bi-2212, while the latter compound exhibits a sudden and complete collapse of the mean-field step between critical and optimal doping. We conclude that the static inhomogeneity observed in STM on Bi-2212 single crystals is unrelated to bulk superconducting HTS properties and probably reflects the presence of disorder at the surface.
This work was supported by the Engineering and Physical Sciences Research Council (JWL & WYL) and the Marsden Fund (JLT).
REFERENCES
- [1] T. Stoto et al., Phys. Rev. B 54, 16147 (1996).
- [2] J. L. Tallon et al., Nature 333, 153 (1988).
- [3] J. M. Tarascon et al., Phys. Rev. B 37, 9382 (1988).
- [4] M. A. Subramanian et al., Science 239, 1015 (1988).
- [5] J. L. Tallon et al., Phys. Rev. B51, 12911 (1995).
- [6] J. W. Loram et al., J. Phys. Chem. Solids 59, 2091 (1998).
- [7] J.L. Tallon and J.W. Loram, Physica C 349, 53 (2000).
- [8] J. M. Tranquada et al., Phys. Rev. Lett. 78, 338 (1998).
- [9] S. H. Pan et al., Nature 413, 282 (2001).
- [10] K. M. Lang et al., Nature 415, 412 (2002).
- [11] Ch. Renner et al., Phys. Rev. Lett. 80, 149 (1998).
- [12] G. V. M. Williams et al., Phys. Rev. B 7, 8696 (1998).
- [13] A. V. Mahajan et al., Eur. Phys. J. B 13, 547 (2000).
- [14] J. L. Tallon, presented at the Dresden conference on ”Magnetic Correlations and Superconductivity in Novel Materials”, 16-20 July (2001).
- [15] Balakrishnan et al., J. Phys. C: Sol. State Phys. 21, L847 (1988).
- [16] G. V. M. Williams et al., Phys. Rev. Lett. 80, 377 (1998).
- [17] J. W. Loram et al., J. Phys. Chem. Solids 62, 59 (2001).
- [18] J. W. Loram et al., Physica C341-348, 831 (2000).
- [19] J. W. Loram et al., Physica C282-287, 1405 (1997).
- [20] J. W. Loram et al., Phys. Rev. Lett. 71, 1740 (1993).
- [21] S.D. Obertelli, J.R. Cooper and J.L. Tallon, Phys. Rev. B 46, 14928 (1992).
- [22] C. Bernhard and J.L. Tallon, Phys. Rev. B 54, 10201 (1996).
- [23] J. W. Loram et al., Physica C235-240, 134 (1994).
- [24] J. W. Loram et al., Proc. 10th Anniversary HTS Workshop, Houston 1996 pp341-4 World Scientific, Eds B. Batlogg, C.W. Chu, W.K. Chu, D.U. Gubser, K.A. Muller.
- [25] M.E. Fisher and A.E. Ferdinand, Phys. Rev. Lett. 19, 169 (1967).
- [26] S.E. Inderhees et al, Phys. Rev. Lett. 66, 232 (1991).
- [27] T. Schneider and J.M. Singer, Physica C 341-348, 87 (2000); cond-mat/0210702.
- [28] M.L. Kulic and H. Stenschke, Sol. State Comms. 66, 497 (1988)