Anisotropic optical conductivities due to spin and orbital
orderings
in LaVO3 and YVO3: First-principles studies
Abstract
The anisotropy of low energy (05eV) optical excitations in strongly correlated transition-metal oxides is closely related to the spin and orbital orderings. The recent successes of LDA+ method in describing the magnetic and electronic structures enable us to calculate the optical conductivity from first-principles. The LaVO3 and YVO3, both of which have configuration and have various spin and orbital ordered phases at low temperature, show distinct anisotropy in the optical spectra. The effects of spin and orbital ordering on the anisotropy are studied in detail based on our first-principles calculations. The experimental spectra of both compounds at low temperature phases can be qualitatively explained with our calculations, while the studies for the intermediate temperature phase of YVO3 suggest the substantial persistence of the low temperature phase at elevated temperature.
pacs:
75.30.-m, 78.20.Bh, 71.27.+aI Introduction
The strong couplings among the spin, lattice and charge degrees of freedom in transition-metal oxides (TMO) are essentially mediated by the orbital degree of freedom (ODF), which plays a crucial role in controlling the phases and various physical properties Orbital ; LSMO ; JPC . The direct observation of orbital structure is difficult, yet several experiments X-ray ; PCMO ; LMO have been developed to detect the anisotropy induced by spin and orbital orderings. Among them, the measurement of anisotropic optical conductivity PCMO ; LMO by using polarized light can provide us with useful information. The low-energy optical excitations below the strong O to transition-metal charge-transfer peak mostly come from the transition-metal -to- transitions. Those transitions reflect sensitively the spin and orbital structures of the system through optical transition matrix elements, and show anisotropy when spin and orbital are cooperatively ordered Millis ; Igor . Nevertheless, the proper analysis of experimental anisotropic optical spectra requires the detailed understanding of electronic and magnetic structures.
Both LaVO3 and YVO3 are insulators with a orthorhombic unit cell with at room temperature. There are two electrons per V3+ site. Synchrotron X-ray and neutron diffraction results LVO suggested that LaVO3 undergoes a magnetic phase transition at 143K Miyasaka2 and a structural phase transition at 140K. The low temperature phase has the C-type antiferromagnetic (AF) spin configuration (i.e., ferromagnetic (FM) coupling along the -axis and AF coupling in the -plane). Due to the Jahn-Teller distortion, one of the V-O bond is longer than other two in the VO6 octahedron. The longer bond lies in the -plane and its orientation alternates for the neighboring V sites in the plane. The stacking of the longer bonds also alternates along the -axis. Hereafter we call this kind of distortion the G-type Jahn-Teller distortion. This low temperature phase has P21/ crystal symmetry.
The structural and magnetic phases for YVO3 are quite complicated YVO1 ; YVO2 ; YVO3 . With lowering the temperature, this compound first undergoes a structural phase transition at 200K from a disordered phase to the G-type Jahn-Teller distorted structure, the same structure as the low temperature phase of LaVO3. Then the C-type AF ordering develops at 116 K (). With further lowering the temperature to 77K (), another structural and magnetic phase appears. The low temperature (77K) phase recovers the crystal symmetry with the C-type Jahn-Teller distortion (i.e., the longer bonds stack along the -axis in the same orientation rather than alternately). The magnetic structure of this low temperature phase is G-type AF structure (i.e., AF coupling both in the -plane and along the -axis). Strong temperature-induced magnetization reversal can be observed at and YVO4 .
Sawada and Terakura studied the electronic and magnetic structures of LaVO3 and YVO3 by using the full-potential linearized augmented-plane-wave (FLAPW) method. They first compared the results sawada1 between LDA (local density approximation) and GGA (generalized gradient approximation), and then applied the LDA+ method LDAU to LaVO3 sawada2 . They found that the LDA and GGA are not sufficient, and LDA+ is necessary in order to predict the low temperature phase correctly. Recently, the polarized optical conductivities of LaVO3 and YVO3 were measured by Miyasaka et al. Miyasaka and very clear anisotropy was observed. To understand the implications of those spectra, we developed the plane-wave pseudopotential method based on LDA+ to calculate the optical conductivity and studied the effects of spin and orbital orderings on the anisotropy. The experimental spectra of both LaVO3 and YVO3 at low temperature can be qualitatively explained by our calculations, while the studies for the intermediate temperature phase () for YVO3 suggest the complication of magnetic and orbital structures. In Section II of this paper, we will describe our method, and the results are discussed in Section III.
II Method
The Vanderbilt type ultra-soft pseudopotential PP is useful not only for efficient calculations for transition-metal oxides but also for implementing the LDA+ method to treat effects of strong correlation. In the LDA+ method, the strong Coulomb interaction is explicitly taken into account in the subspace of localized orbitals through a Harteree-like scheme. The detailed description of our LDA+ scheme was given in Ref.[JPC, ].
The inter-band optical conductivity is calculated from the converged Kohn-Sham wave functions and eigen values by using the following Kubo formula Kubo (in Ry units):
| (1) | |||||
where and (=) are indices for directions, is the excitation energy, is the volume of the unit cell, and are band indices, is the Fermi distribution function, and is the lifetime broadening (=0.01Ry in this work), are the matrix elements of the momentum operator. The calculations for the matrix elements require the all electron wave-functions , which can be obtained from the following core compensation form Fujiwara ; Matrix :
| (2) |
where are the pseudo-wave-functions obtained from the self-consistent pseudopotential calculations, is the index for atomic orbitals, and are atomic all-electron and pseudo- wave functions respectively, are the localized functions as defined in Ref.[PP, ]. Therefore, the matrix elements of momentum operator can be obtained as Fujiwara ; Matrix :
| (3) | |||||
Practically, the core contribution (second term of eq.(3)) can be calculated in the pseudopotential generation process and stored as input of self-consistent calculations. The present process has been well checked by using LaMnO3 as an example Millis ; Igor . Throughout the calculations, 30Ry has been used for the cutoff energy of plane-wave expansion, and we use mesh for the k-points in the linear tetrahedron method with the curvature correction. The parameter in LDA+ scheme is chosen to be about 3.0eV in order to reproduce the experimental band gaps gap ; Miyasaka ; JPC .
III Results and Discussions
III.1 Electronic structures
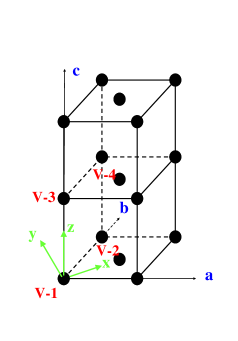
The unit cell and coordinates are defined in Fig.1. Four V atoms, say V-1, V-2, V-3 and V-4, are included in the unit cell. Following the common convention, we defined the , and directions as the [110], [1̄10] and [001] directions of the unit cell respectively. Three structures, LaVO3 at 10K LVO , YVO3 at 65K YVO3 , and YVO3 at 100K YVO3 are treated here, which have the G-type, C-type and G-type Jahn-Teller distortions, respectively. For each fixed structure, relative stability is studied among four kinds of collinear magnetic structures: C-type AF, G-type AF, A-type AF(i.e., FM layers coupled antiferromagneticaly along the -axis), and FM spin ordering (SO) states.
Each of the above Jahn-Teller distortions is accompanied by the same type of orbital ordering (OO) and stabilizes a specific related magnetic structure. In the present case, our calculations suggest that the G-type and C-type OO favor the C-type and G-type AF SO, respectively. This result is consistent with experimental observations and also with the previous calculations sawada1 ; sawada2 and unrestricted Hartree-Fock studies Mizokawa . Now we concentrate on the discussion for the electronic structures of the lowest energy magnetic state of each structure. They are A) LaVO3 10K with G-OO and C-SO; B) YVO3 65K with C-OO and G-SO; C) YVO3 100K with G-OO and C-SO. The obtained magnetic moments for these three states are all about 1.7/V. The calculated electronic projected densities of states (PDOS) are summarized in Fig.2, where different orbitals are shown by different colors. The O- and V- states are not plotted.
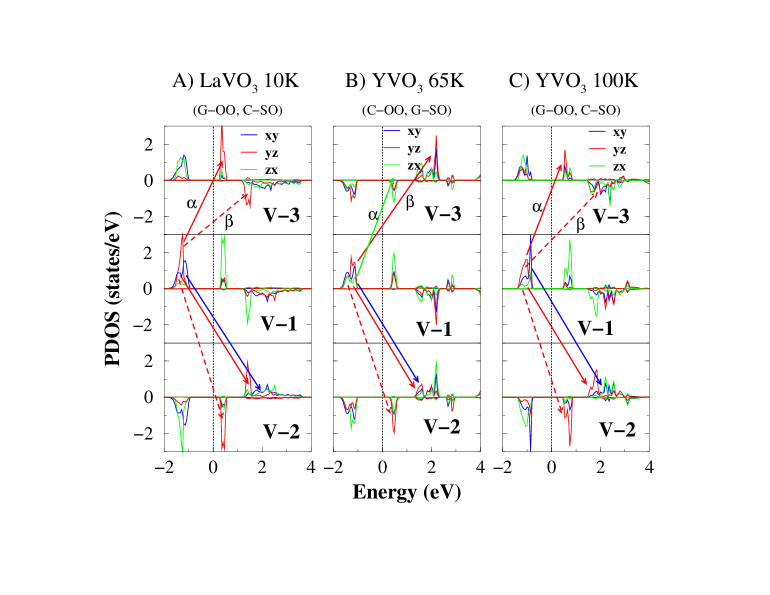
For A), the occupied electronic configuration can be nominally expressed as V-1: ; V-2: ; V-3: ; V-4: . One of the two electrons on each V site will occupy the orbital, and another electron will occupy the or orbital alternately from one V atom to its neighboring V atoms, resulting in G-OO. The C-SO is manifested as the up spin state for V-1 and V-3, and the down spin state for V-2 and V-4. Due to deviation from the cubic structure, certain degree of mixture of orbitals can be observed: for example, the small occupation of orbital (green line) for V-1 site. Note here that, in our calculation, for each fixed structure and spin configuration the orbital polarization is fully relaxed self-consistently. The calculated electronic and magnetic structures of YVO3 in the intermediate temperature (100K) phase (panel C in Fig.2) can be understood in the same way as the low temperature phase of LaVO3 in terms of the same spin and orbital orderings. This can be seen from the similarity of the panel A) to the panel C) in Fig.2.
For the low temperature phase of YVO3 (panel B in Fig.2), the situation is different. The nominal electronic occupations can be understood as V-1: ; V-2: ; V-3: ; V-4: . As for the OO and SO in the -plane, the present situation is the same as those of A) and C). However, the OO and SO along the -axis are different. In the present case, all the V atoms along a given -axis have the same orbital occupation, while those belonging to the nearest neighbor -axes have different orbital occupations. For instance, the orbital is occupied for both V-1 and V-3 sites. This C- OO leads to stability of the G-SO through AF superexchange. Comparing LaVO3 with YVO3, we can find strong mixture of orbitals in YVO3. This is due to the enhanced structural distortion in YVO3 compared with LaVO3. The V-O-V angles are about 157 degrees in LaVO3, while they are reduced to about 144 degrees in YVO3.
Similar analysis was made for all other magnetic phases of these three structures. Among several results obtained, we noticed the following interesting and possibly important feature: for a fixed crystal structure, a change in the magnetic structure will not cause any significant change in the orbital ordering. It is likely that the orbital structure is mostly determined by the specific structure distortion in the present case.
III.2 Optical conductivities
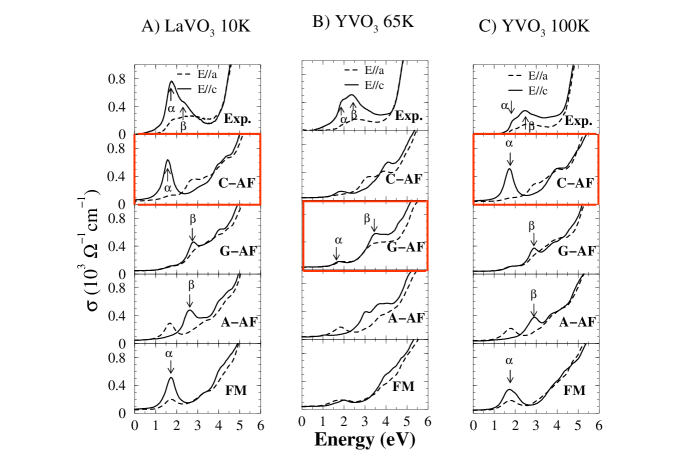
The results for optical conductivity are summarized in Fig.3. Experimentally, two peak structures ( and ) are observed for E// in both compounds, with peak located at higher energy than peak . For LaVO3, peak has a very sharp structure at low temperature and is significantly suppressed above the transition temperature. Peak is quite weak and almost temperature independent. In YVO3, on the other hand, peak has a larger weight with strong temperature dependence and peak is weak with only little temperature dependence. For both LaVO3 and YVO3, the E// spectra are quite broad and almost temperature insensitive.
III.2.1 LaVO3 low temperature phase:
For LaVO3 at 10K, the G-OO with C-SO state is the most stable state. We first analyze the case of E//, where we consider the inter-site transition between V-1 and V-3 as the transition dipole is along the -axis. The calculated optical conductivity for C-AF in Fig.3 shows clearly a sharp peak corresponding to the experimental peak . Looking back to the calculated PDOS in Fig.2, and taking the transitions from V-1 site to other sites as examples, we can assign the sharp peak for E// to the transition from V-1- to V-3- as denoted by the solid red arrow in Fig.2. This transition is not allowed if the magnetic structure along -axis is AF, like in the G-AF and A-AF states, where no peak is obtained around the same position of peak . Therefore, the peak should be suppressed above the magnetic transition temperature as observed in experiment. On the other hand, peak seen in experiment does not exist in the calculated spectra for C-AF. Since the spectral weight of peak is very small and temperature insensitive in experiment, we speculate that this peak may come from certain component of imperfect spin ordering along the -axis. For example, let us reverse the spin of V-3 site in Fig.2A. The transition from V-1- to V-3- located at higher energy (denoted by the red dashed arrows in Fig.2) will be allowed and contribute to a sharp peak near the position of peak , as shown in the spectra for the G-AF and A-AF state for E//. Before moving to YVO3, we briefly discuss the case of E//, where the intersite electronic transitions between V-1 and V-2 are important. The two transitions from V-1- to V-2- (denoted as solid blue and red arrows in Fig.2) are allowed for the -plane spectra, which show a broad structure due to the broad band width of unoccupied minority spin states. These -plane transitions produce a structure in E// curve at the position of peak of E// curve. Due to the doubling of transition paths, one may expect a strong -plane spectral weight. However, by calculating the matrix elements, the actual -plane spectrum is not so much weighted due to the longer bonds in the -plane. The shoulder in the experimental E// curve at about 1.5 eV, i.e., the energy of peak in the E// curve may originate from the spin disordering in the -plane. First we note that a very tiny peak is seen at this energy in the C-AF ground state configuration. This structure mainly comes from the transition from the occupied V-1- component to a small V-2- component just above the Fermi level. However, this structure is too weak to explain the shoulder at 1.5 eV. If the spin state between V-1 and V-2 may become parallel like in A-AF and FM, the transition corresponding to the red dashed arrow may become allowed and produces a peak as shown in Fig.3.
From the above assignment, some important parameters can be estimated by using the Hartree-Fock model. The peak position of should corresponds to energy , and peak corresponds to , where and are on site Coulomb and exchange parameters. The estimated values for and are 2.2eV and 0.6eV from our calculations, and about 2.1eV and 0.32eV from experiments for LaVO3. The smaller parameter estimated from experiments may suggests the spin canting or fluctuation at elevated temperature, especially for YVO3 as discussed below.
III.2.2 YVO3 at low temperature (T77K):
Now let us discuss the low temperature phase of YVO3. In this case, the C-OO with G-SO state is the most stable state. As the results, the strong peak for E// can be explained as the transition from V-1- to V-3- as noted by the solid red arrow in Fig.2B with energy . This transition is not allowed for the FM coupling along the -axis as in the case of C-AF or FM state, and should show strong temperature dependence as observed in experiment. As for the small peak , the situation for C-OO is different from the case of LaVO3 with G-OO. In the present case of C-OO, the significant mixture of different orbitals under strongly distorted VO6 environment is crucially important to produce this small peak located at energy (corresponding to the transition as noted by the green arrow in Fig.2B). Let us explain the situation in more details. If there is no orbital mixing (the inter-site hybridization for the same orbitals still exists), is fully occupied and is empty in the majority spin state both at V-1 and V-3. The unoccupied at V-1 hybridizes with unoccupied (not ) at V-3 to produce a small component at V-3 site at the energy of majority spin empty state. In this case, the weight of the transition from V-1- to V-3- is zero because of the zero occupation of V-1- state, and the small peak should not exist. However, as already mentioned the orbital mixing between and is significant due to the lattice distortion and produces the partial occupation of V-1- state (green line in Fig.2B). This will contribute to the small peak . We should emphasize here that by keeping the C-OO any magnetic coupling along the -axis will produce a peak around only through the orbital mixing and therefore the peak will never be strong, in contrast to the case of LaVO3. Nevertheless, those states with different orbital ordering, like the intermediate temperature phase with G-OO and C-SO, can contribute to the peak structure around as shown in Fig.2C.
III.2.3 YVO3 at intermediate temperature (77KT116K):
The observed spectra for the intermediate phase of YVO3, which has G-OO and C-SO, is hard to be explained by our calculations. Our calculations suggest a picture similar to that of the low temperature phase of LaVO3, because the two systems have the same spin and orbital orderings. However, the observed spectra is quite similar to the low temperature phase of YVO3, which has different spin and orbital orderings. In particular, the observed peak is stronger than peak and temperature dependent, while the calculations suggest the opposite. One possible scenario to explain the observed picture is to suggest the persistence of low temperature phase (C-OO and G-SO) at elevated temperature, or at least certain mixture of other magnetic states, like G-OO with G-SO or G-OO with A-SO states. This argument can be supported by the following facts. First, the small parameter (about 0.25eV) estimated from experiment suggests the possibility of strong canting or magnetic fluctuation at elevated temperature (100K). Second, the recent neutron experiment Keimer on this compound actually suggests the existence of G-type spin canting and significant reduction of magnetic moment at 100K. Nevertheless, according to our calculations, to be able to reproduce the observed shape, substantial (more than 50 percent) mixture of low temperature phase is required.
In conclusion, we developed the first-principles plane-wave-pseudopotential method based on LDA+ to calculate the inter-band optical conductivity. We calculated the anisotropic optical conductivities of LaVO3 and YVO3 for different orbital and spin ordered phases, and studied the effects of spin and orbital ordering on the anisotropy. The experimentally observed spectra for both LaVO3 and YVO3 at low temperature can be qualitatively explained by our calculations. On the other hand, our calculation for the intermediate temperature phase for YVO3 suggests that substantial mixture of low temperature phase may persist at elevated temperature.
Acknowledgements.
The authors appreciate Prof. Y. Tokura and Dr. S. Miyasaka for fruitful discussions and providing their experimental data. The authors also acknowledge the valuable discussion with Dr. I. V. Solovyev and Dr. Y. Motome.References
- (1) Y. Tokura and N. Nagaosa, SCIENCE 288, 462 (2000).
- (2) Z. Fang, I. V. Solovyev and K. Terakura, Phys. Rev. Lett. 84, 3169 (2000).
- (3) Z. Fang and K. Terakura, J. Phys.: Condens. Matter 14, 3001 (2002).
- (4) Y. Murakami, J. P. Hill, D. Gibbs, and et al., Phys. Rev. Lett 81, 582 (1998); Y. Murakami, H. Kawada, H. Kawata, and et al., Phys. Rev. Lett. 80, 1932 (1998).
- (5) Y. Okimoto, Y. Tomioka, Y. Onose, and et al., Phys. Rev. B 59, 7401 (1999).
- (6) K. Tobe, T. Kimura, Y. Okimoto, and K. Tokura, Phys. Rev. B 64, 184421 (2001).
- (7) K. H. Ahn and A. J. Millis, Phys. Rev. B 61, 13545 (2000).
- (8) K. Terakura, I. V. Solovyev, and H. Sawada, in Colossal Magnetoresistive Oxides, edited by Y. Tokura (Gordon & Breach Science Publishers, London, 2000).
- (9) P. Bordet, C. Chaillout, M. Marezio, and et al., J. Soli. Stat. Chem. 106, 253 (1993).
- (10) S. Miyasaka, T. Okuda, and Y. Tokura, Phys. Rev. Lett. 85, 5388 (2000).
- (11) H. Kawano, H. Yoshizawa, and Y. Ueda, J. Phys. Soc. Jpn. 63, 2857 (1994).
- (12) M. Noguchi, A. Nakazawa, S. Oka, and et al., Phys. Rev. B 62, R9271 (2000).
- (13) G. R. Blake, T. T. M. Palstra, Y. Ren, and et al., Phys. Rev. Lett. 87, 245501 (2001); ibid, Phys. Rev. B 65, 174112 (2002).
- (14) Y. Ren, T. T. M. Palstra, D. I. Khomski, and et al., NATURE 396, 441 (1998).
- (15) H. Sawada, and K. Terakura, Phys. Rev. B 53, 12742 (1996).
- (16) V. I. Anisimov, J. Zaanen, and O. K. Anderson, Phys. Rev. B 44, 943 (1991); I. V. Solovyev, P. H. Dederichs, and V. I. Anisimov, Phys. Rev. B 50, 16861 (1994).
- (17) H. Sawada, and K. Terakura, Phys. Rev. B 58, 6831 (1998).
- (18) S. Miyasaka, Y. Okimoto, and Y. Tokura, J. Phys. Soc. Jpn., (to appear); cond-mat/0207664.
- (19) D. Vanderbilt, Phys. Rev. B 41, 7892 (1990).
- (20) C. S. Wang and J. Callaway, Phys. Rev. B 9, 4897 (1974).
- (21) T. Fujiwara, and T. Hoshi, J. Phys. Soc. Jpn. 66, 1723 (1997).
- (22) H. Kageshima, and K. Shiraishi, Phys. Rev. B 56, 14985 (1997).
- (23) T. Arima, Y. Tokura, and J. B. Torrance, Phys. Rev. B 48, 17006 (1993).
- (24) T. Mizokawa, and A. Fujimori, Phys. Rev. B 54, 5368 (1996); T. Mizokawa, D. I. Khomskii, and G. A. Sawatzky, Phys. Rev. B 60, 7309 (1999).
- (25) C. Ulrich, G. Khaliulin, J. Sirker, and et al., (to be published).