More statistical properties of order books and price impact
Abstract
We investigate present some new statistical properties of order books. We analyse data from the Nasdaq and investigate (a) the statistics of incoming limit order prices, (b) the shape of the average order book, and (c) the typical life time of a limit order as a function of the distance from the best price. We also determine the ‘price impact’ function using French and British stocks, and find a logarithmic, rather than a power-law, dependence of the price response on the volume. The weak time dependence of the response function shows that the impact is, surprisingly, quasi-permanent, and suggests that trading itself is interpreted by the market as new information.
† Commissariat à l’Energie Atomique, Orme des Merisiers
91191 Gif-sur-Yvette cedex, France
∗ Science & Finance, CFM, 109-111 rue Victor Hugo
92 353 Levallois cedex, France
Many statistical properties of financial markets have already been explored, and have revealed striking similarities between very different markets (different traded assets, different geographical zones, different epochs) [1, 2, 3]. More recently, the statistics of the ‘order book’, which is the ultimate ‘microscopic’ level of description of financial markets, has attracted considerable attention, both from an empirical [4, 5, 6, 8, 7] and theoretical [9, 10, 5, 11, 12, 13, 8, 14, 15] point of view.
The order book is the list of all buy and sell limit orders, with their corresponding price and volume, at a given instant of time. We will call the ask price (best sell price) at time and the bid price (best buy price) at time . The midpoint is the average between the bid and the ask: . When a new order appears (say a buy order), it either adds to the book if it is below the ask price, or generates a trade at the ask if it is above (or equal to) the ask price (we call these ‘market orders’). The price dynamics is therefore the result of the interplay between the order book and the order flow. The study of the order book is very interesting both for academic and practical reasons. It provides intimate information on the processes of trading and price formation, and reveals a non trivial structure of the agents expectations: as such, it is of importance to test some basic notions of economics. The practical motivations are also obvious: issues such as the market impact or the relative merit of limit versus market orders are determined by the structure and dynamics of the order book.
The main results of our investigation of some major French stocks were as follows [8]: (a) the price at which new limit orders are placed is, somewhat surprisingly, very broadly (power-law) distributed around the current bid/ask; (b) the average order book has a maximum away from the current bid/ask, and a tail reflecting the statistics of the incoming orders. We studied numerically a ‘zero intelligence’ model of order book which reproduces most of the empirical results, and proposed a simple approximation to compute analytically the characteristic humped shape of the average order book (see also [13]).
In this paper, we give the results concerning some of the Nasdaq order books, as observed on the Island ECN (see www.island.com), and discuss the similarities and differences with the French data. Second, we give some results on the price impact function that quantifies how a transaction of a given volume affects the price (on average).
1 Results on Nasdaq stocks
We denote by the price of a new buy limit order, and the price of a new sell limit order. A first interesting question concerns the distribution density of , i.e. the distance between the current price and the incoming limit order. We found that for French stocks was identical for buy and sell orders (up to statistical fluctuations); and very well fitted by a single power-law:
| (1) |
with an exponent . This power-law was confirmed in [7] for British stocks, albeit with a different exponent . Note however that all the volume is electronic in Paris, which is not the case in London.
When repeating this analysis for some of the Nasdaq stocks, we found results that significantly depend on the studied asset (see Fig. 1), but that all reveal the very slowly decaying tail discovered in the case of French stocks. As emphasized in [8, 7], this tail suggests that market participants believe that large jumps in the price of stocks are always possible, and place orders very far from the current price in order to take advantage of these large potential fluctuations.
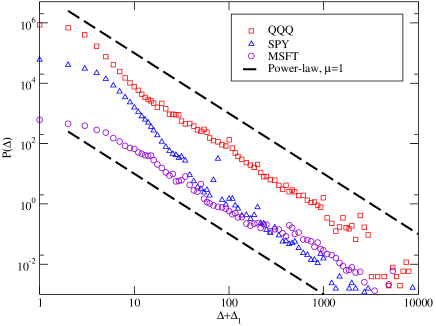
More precisely, we have studied QQQ and SPY, which are exchange traded funds that track, respectively, the Nasdaq and the S&P500, and MSFT (Microsoft). The data corresponds to the period June 1st to July 15th, 2002. At variance with the Paris Bourse, where all the volume is traded on a centralized electronic market, the Nasdaq is in fact a myriad of electronic platforms. Island is one of them, which only gathers a fraction of the total volume (roughly 40 % for QQQ and 20 % for SPY and MSFT). Therefore, unfortunately, the statistics that we report here only contains a partial information on the order flow and on the order book. This is why this data is less representative than that on French stocks. In the case of QQQ however, the Island ECN is considered to be the ‘dominant’ market, which drives all other platforms; the data reported below is therefore probably significative in this case. Fig. 1 shows that for all three assets, the tail index of is in the same ballpark as the values found for the French and British stocks. One can notice that the value of for MSFT is smaller than that for QQQ, itself smaller than gor SPY. This is expected, since large jumps are more probable for individual stocks than it is for the Nasdaq index, itself more volatile than the S&P500.
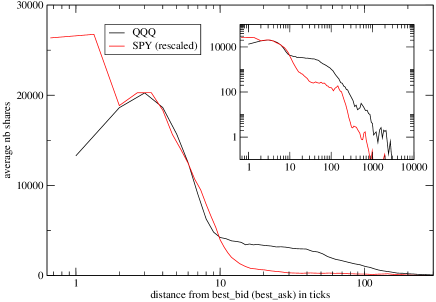
We now turn to the shape of the order book. The order flow is maximum around the current price, but an order very near to the current price has a larger probability to be executed or cancelled (see below) and disappear from the book. It is thus not a priori clear what will be the shape of the average order book. We find that in the case of QQQ the (time-averaged) size of the queue in order book is symmetrical, and has a maximum away from the current bid (ask), as was found for French stocks: see Fig. 2. For SPY (and for MSFT, not shown), on the other hand, the size of the queue is maximum at the bid (or ask). The difference might be due to the fact that, as explained above, the Island ECN is not the dominant player for SPY or MSFT, and often behaves as a ‘mirror’ of other platforms.
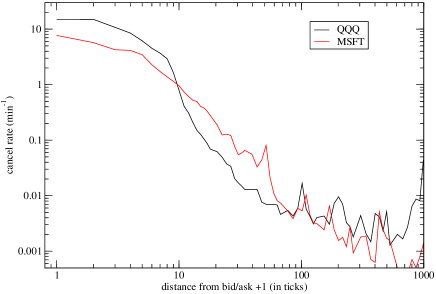
In our previous paper [8], we have analysed a simple model that explains the humped shape of the book of the type observed on QQQ. The basic ingredients of this model is (a) the non uniform, power-law like, flow of incoming orders (b) the diffusive like dynamics of the price that eats up the nearby limit orders and (c) the finite life-time of the limit orders. For simplicity, this life-time was assumed in [8] to be constant, independent of the distance form the best price . We have investigated empirically this question using the Nasdaq data (the French data unfortunately does not provide the time at which a limit order is cancelled). As a proxy for the cancel rate, we have computed the number of shares cancelled per unit time as a function of , and divided the result by the average number of shares in the order book at distance . The results for QQQ and MSFT are shown in Fig. 3. One sees that the life-time of a given order increases as one moves away from the bid-ask. This is, again, expected from the arguments given in [8, 7]: far away orders are typically put in the market by patient investors that want to take profit of important swings in the medium term. Orders at and around the bid and ask prices, on the other hand, correspond to very active market participants that observe the market price all the time and readjust their orders at a very high frequency. Our results suggest that any quantitative theory of the order book should include this non uniform cancel rate.
2 The price impact function
Recently, several studies have tried to determine quantitatively how a market order of a given volume affects the price. This information is extremely important for many purposes. First, for model building: many agent based models of markets use as a starting point a phenomenological relation between price changes and order imbalance [16, 18, 17, 19]. Second, as far as trading is concerned, the control of market impact is crucial whan one wants to manage large volumes.
The most naive idea, inspired from physical systems, is that of linear response: prices should move proportionally to volumes. However, some recent work [20, 21, 22] show that the average price change is a sublinear function of the volume imbalance . A square-root dependence with was advocated on theoretical grounds [23, 19]. An exhaustive study of all US stocks [22] however suggests a smaller exponent but a log-log plot of vs. reveals a systematic downward bend, which indicates that a power-law might not be appropriate. Here, we want to argue that this relation might in fact be logarithmic.
More precisely, let us define the time dependent response function as the average mid-point variation between times and , conditioned to a transaction of volume taking place at time at the ask (buyer initiated trade, ) or at the bid (seller initiated trade, ). The response function is given by:
| (2) |
[We have actually studied the full distribution of and checked that the above average is not dominated by a few market ‘jumps’.] The results we find (see Fig. 4) can be expressed as:
| (3) |
where, surprisingly, is only weakly dependent on : first increases from seconds to a few hundred seconds, and then appears to decrease back to a finite value, with a total amplitude of variation of at most . This means that (i) as found in previous investigations, the impact of small trades on the price is, in relative terms, much larger (statistically) than that of large trades, (ii) that the impact of trading on the price is quasi-permanent, and (iii) the (weak) temporal structure of is compatible with the observed price dynamics, which is found to be (weakly) super-diffusive at very short times and (weakly) sub-diffusive on intermediate time scales.

Point (i) is perhaps not as surprising as it first seems: as emphasized above, the average queue in the order book is an increasing function of . This means that price changes experience a stronger resistance from the book for large volumes than for small volumes. In other words, since the most probable volume at the bid (or at the ask) is one share, a small transaction is capable of changing the mid-price by eating up the bid (or ask). The next tick (bid minus one or ask plus one) has typically a larger volume waiting, and offers therefore more resistance to further price changes. The humped shape of the order book in itself is, as recently emphasized in [22], enough to give a downward bend to vs. . However, this effect is not sufficient to account for the very slow behaviour reported above. The interpretation is that, most probably, market orders of large volumes are only submitted when the order book on the opposite side of the trade is capable of absorbing this incoming volume. We have indeed found some positive correlation between the volume at bid/ask before the trade and the volume of the following trade.
Point (ii) is in fact quite intriguing, in particular in the context of the efficient market hypothesis. One might have expected that, in the absence of any new information, there should be a restoring force driving back the new mid-point towards a local ‘equilibrium’ price. The near-absence of temporal structure in suggests that each new trade is in fact interpreted by the market as new information, and the new mid-point is immediately adopted as the new reference price, around which the flow of incoming orders readapts. (This is actually the hypothesis made in the models investigated in [13, 8]) This reverts the usual logic: most of the time, prices move not because of new information, but rather new information is generated by the mere changes of prices. Although there seems to be a small resilience on intermediate time scales, the prices are much more affected by trading itself than expected from the theory of efficient market. This observation might explain the tremendous ‘excess’ volatility of financial prices.
Acknowledgements: We thank Jean-Pierre Aguilar, Jelle Boersma, Damien Challet, J. Doyne Farmer, Xavier Gabaix, Andrew Matacz, Rosario Mantegna, Marc Mézard and Matthieu Wyart for stimulating and useful discussions.
References
- [1] for a recent review, see: R. Cont, Empirical properties of asset returns: stylized facts and statistical issues, Quantitative Finance, 1, 223 (2001), and refs. therein.
- [2] R. Mantegna & H. E. Stanley, An Introduction to Econophysics, Cambridge University Press, 1999.
- [3] J.-P. Bouchaud and M. Potters, Théorie des Risques Financiers, Aléa-Saclay, 1997; Theory of Financial Risks, Cambridge University Press, 2000.
- [4] B. Biais, P. Hilton, C. Spatt, An empirical analysis of the limit order book and the order flow in the Paris Bourse, Journal of Finance, 50, 1655 (1995)
- [5] S. Maslov, Simple model of a limit order-driven market, Physica A 278, 571 (2000); S. Maslov, M. Millis, Price fluctuations from the order book perspective – empirical facts and a simple model, Physica A 299, 234 (2001)
- [6] D. Challet, R. Stinchcombe, Analyzing and modelling 1+1d markets, Physica A 300, 285 (2001)
- [7] I. Zovko, J. D. Farmer, The power of patience: A behavioral regularity in limit order placement, e-print cond-mat/0206280.
- [8] J.P. Bouchaud, M. Mézard, M. Potters, Statistical properties of stock order books: empirical results and models, Quantitative Finance 2, 251 (2002).
- [9] P. Bak, M. Paczuski, and M. Shubik, Price variations in a stock market with many agents, Physica A 246, 430 (1997)
- [10] David L.C. Chan, David Eliezer, Ian I. Kogan, Numerical analysis of the Minimal and Two-Liquid models of the Market Microstructure, preprint cond-mat/0101474
- [11] H. Luckock, A statistical model of a limit order market, Sidney University preprint (September 2001).
- [12] F. Slanina, Mean-field approximation for a limit order driven market model, Phys. Rev. E 64, 056136 (2001).
- [13] M. G. Daniels, J. D. Farmer, G. Iori, E. Smith, How storing supply and demand affects price diffusion, e-print cond-mat/0112422; E. Smith, J. D. Farmer, L. Gillemot, S. Krishnamurthy, Statistical theory of the continuous double auction, e-print cond-mat/0210475
- [14] D. Challet, R. Stinchcomb, Exclusion particle models of limit order financial markets, e-print cond-mat/0208025
- [15] R.D. Willmann, G. M. Schuetz, D. Challet, Exact Hurst exponent and crossover behavior in a limit order market model, to appear in Physica A.
- [16] A. Beja, M. B. Goldman, The dynamic behavior of prices in disequilibrium, Journal of Finance 35, 235 (1980).
- [17] J.-P. Bouchaud, R. Cont, A Langevin approach to stock market fluctuations and crashes, European Journal of Physics, B 6, 543 (1998).
- [18] J.D. Farmer, Market Force, Ecology and Evolution, e-print adap-org/9812005, Int. J. Theo. Appl. Fin. 3, 425 (2000).
- [19] X. Gabaix, P. Gopikrishnan, V. Plerou, H. E. Stanley, A Simple Theory of the ’cubic’ Laws of Financial Fluctuations, working paper (2002).
- [20] A. Kempf, O. Korn, Market Depth and Order Size, Journal of Financial Markets, 2, 29 (1999).
- [21] V. Plerou, P. Gopikrishnan, X. Gabaix, H. E. Stanley, Quantifying Stock Price Response to Demand Fluctuations, e-print cond-mat/0106657.
- [22] F. Lillo, R. Mantegna, J. D. Farmer,Single Curve Collapse of the Price Impact Function for the New York Stock Exchange, e-print cond-mat/0207428.
- [23] Y.C. Zhang, Towards a Theory of Marginally Efficient Markets, Physica A269 30 (1999).