Computer simulations of domain growth in off-critical quenches of two-dimensional binary mixtures
Abstract
The phase separation of two-dimensional binary mixtures has been studied through numerical Langevin simulations based on a Ginzburg-Landau free energy. We have considered not symmetric mixtures with and without imposed shear flow. In the sheared case our main results are as follows: (1) domains are distorted by the flow; (2) the structure factor has four peaks; (3) excess viscosity shows a peak whose position is independent of shear rate but its height decreases increasing shear rate.
47.20.Hw; 05.70.Ln; 83.50.Ax
I Introduction
Fluid systems can be described at different scales. Molecular dynamics simulations have the advantage of taking into account elementary forces and microscopic details providing a realistic description of the fluid. On the other hand, coarse grained models, where for example a coarse-grained variable describes the concentration of the fluid over a mesoscopic region, are more convenient from a computational point of view, allowing simulations on time scales sometimes unreachable with molecular dynamics.
In phase separation of binary mixtures, for example, after the system is quenched by an initially disordered state into the coexistence region, the typical size of the domains of the different fluid components grows with power laws which are generally better measured in continuum coarse grained models[1]. Due to this reason, in this paper we will study the phase separation of binary mixtures subjected to a shear flow describing the system by a continuous field that represents the difference in concentration between the two phases. Assuming local equilibrium, a chemical potential derived by a free-energy functional of the concentration field will be the source of the dynamical evolution. (This model is sometimes referred in literature as model B[2]). A convection term due the presence of the shear flow will complete the description of the system.
The problem of phase separation of binary mixtures in a shear flow is relevant for many practical reasons especially concerning polymer mixtures and dilute polymer solutions. New recent results have shown that the shear flow greatly affects the morphology of the growing domains[3, 4, 5, 6, 7, 8]. Not only the growth is anisotropic with interfaces aligning with the direction of the flow, but for each direction two typical lenghtscales have been measured[9, 10]. This last feature makes a deep difference with what occurs in phase separation without imposed flows where the whole domain evolution is characterized by a single lengthscale [1].
In this paper we consider the case not studied before of mixtures with off-symmetric composition. Our model will be properly defined in Section II. The results will be described in Section III. Domains with two lenghtscales for each direction will be found also for the off-symmetrical mixtures. The role of the flow in the first stage of the phase separation will be examined together with the behaviour of the excess viscosity. Some conclusions will end the paper.
II The model
In the following we model a binary mixture by coupling a diffusive field , representing the normalized concentration difference between the two components of the mixture, to an applied velocity field. This approach neglects hydrodynamic effects. For weakly sheared polymer blends with large polymerization index and similar mechanical properties of the two species the present model is expected to be satisfactory in a preasymptotic time domain when velocity fluctuations are small[1]. When hydrodynamic effects become important, instead, the full dynamical model[11, 12, 13], where the time evolution equation for the field is coupled to the Navier-Stokes equation, must be considered.
The mixture is described by the Langevin equation
| (1) |
where is a mobility coefficient, is the external velocity field describing plane shear flow with profile [14], and being, respectively, the shear rate and the unit vector in the direction (flow direction). is a gaussian white noise, representing the effects of thermal fluctuations with zero mean and correlations that, according to the fluctuation-dissipation theorem, are given by
| (2) |
where is the temperature of the mixture, and denotes the ensemble average. The term describes the advection of the field by the velocity and takes into account the diffusive transport of . The free-energy functional generally used in phase separation studies of binary mixtures[1] is
| (3) |
The first two terms are related to the bulk properties of the fluid. While the parameter is always positive, the sign of distinguishes between a disordered and a segregated mixture with phase-separated components. The case with gives a polynomial with one minimum in the origin corresponding to the a disordered state with everywhere while two symmetric minima are present when corresponding to the two pure phases with . These are the equilibrium values of the order parameter in the small temperature limit. In the following we will consider a deep quench at into the two-phase coexistence region. The qualitative behaviour in the non-zero temperature case is similar: Thermal fluctuations are responsible for the increased roughness of the interfaces with respect to and for the thermal excitations inside the ordered domains [10]. The gradient term is related to the interfacial properties and takes into account the energy cost for interface formation. The equilibrium profile between the two coexisting bulk phases is (in a one-dimensional system) , giving a surface tension equal to and an interfacial width proportional to [15].
The thermodynamic properties of the fluid follow from the free energy (3). The chemical potential difference between the two fluids is given by
| (4) |
Equation (1) can be cast in a dimensionless form after a redefinition of time, space and field scales[16]. Then we have chosen .
The main observable for the study of the growth kinetics is the structure factor , namely the Fourier transform of the real-space equal time correlation function. is the Fourier transform of the concentration fluctuations with respect to its average value: . From the knowledge of the structure factor one computes the average size of domains. In the unsheared case ( in Eq. (1)) this quantity can be defined as
| (5) |
where
| (6) |
is the spherical average of the structure factor and is the number of lattice vectors of length in the reciprocal space of momenta. In the case with shear, due to anisotropy, we measure
| (7) |
and analogously for the other directions. An excess of viscosity can be measured in sheared mixtures due to the work spent in stretching the domains. , which is of experimental interest, is defined as[14]
| (8) |
where denotes the number of spatial dimensions.
We have simulated Eq. (1) in by a first-order Euler discretization scheme. Periodic boundary conditions have been implemented in the direction; Lees-Edwards boundary conditions[17] were used in the direction (shear direction). These boundary conditions, originally developed for molecular dynamic simulation of fluids in shear, consist of moving the top and bottom periodic images of the lattice with respect to it so that they require the identification of the point at with the one located at , where is the size of the lattice (the same in all the directions) and is the time discretization interval.
III Results
Simulations were run using lattices of size with grid size . We do not observe significative differences between these two choices of . The results here shown were obtained with , , and three different values of . The system was initialized in a high temperature disordered state with , where is a random number in the range such that . The evolution was studied with , corresponding to a composition of the mixture.
A Unsheared quench
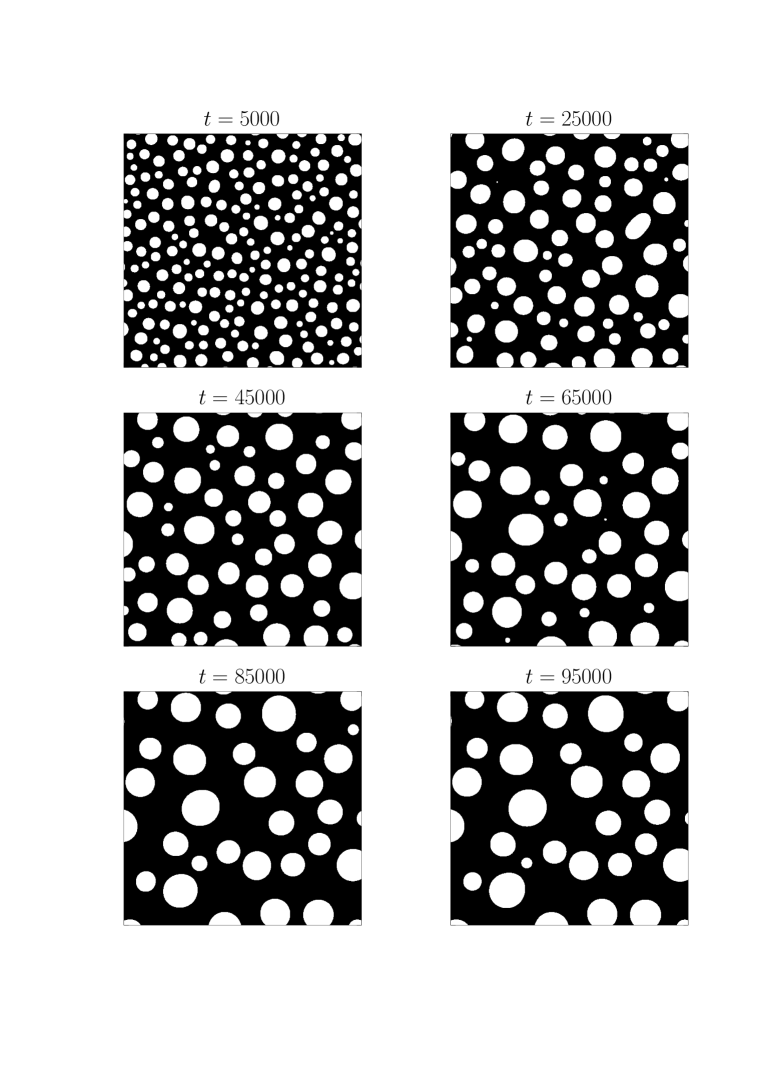
In this section we report the results for the unsheared quench. In Fig. 1 we show a sequence of configurations at consecutive times. The minority phase is made of isolated droplets whose number decreases, while their average radius increases in time. The main physical mechanism for coarsening in the present case, when hydrodynamics is neglected and thermal fluctuations are absent, is the evaporation-condensation mechanism proposed by Lifshitz and Slyozov[18]. In this case larger domains grow at the expenses of smaller domains due to diffusion of atoms. This gives a growth exponent . To check this prediction we computed the average size of domains using Eq. (5). The plot showing the time dependence of is presented in Fig. 2. After an initial regime when well defined domains are forming, corresponding to the fact that is approaching its equilibrium values either or , shows from onwards an asymptotic growth consistent with an exponent . Due to the large system used we could eliminate finite-size effects and observe the regime for two decades in time having a convincing evidence of the mentioned growth mechanism.
B Sheared quench
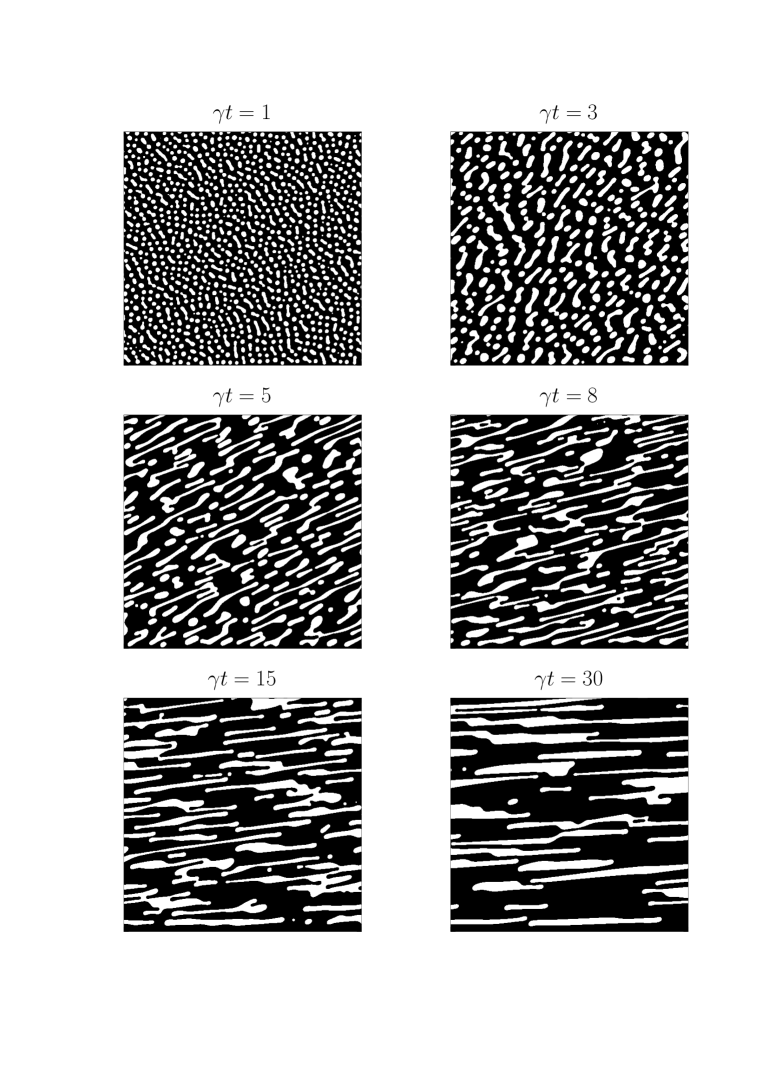
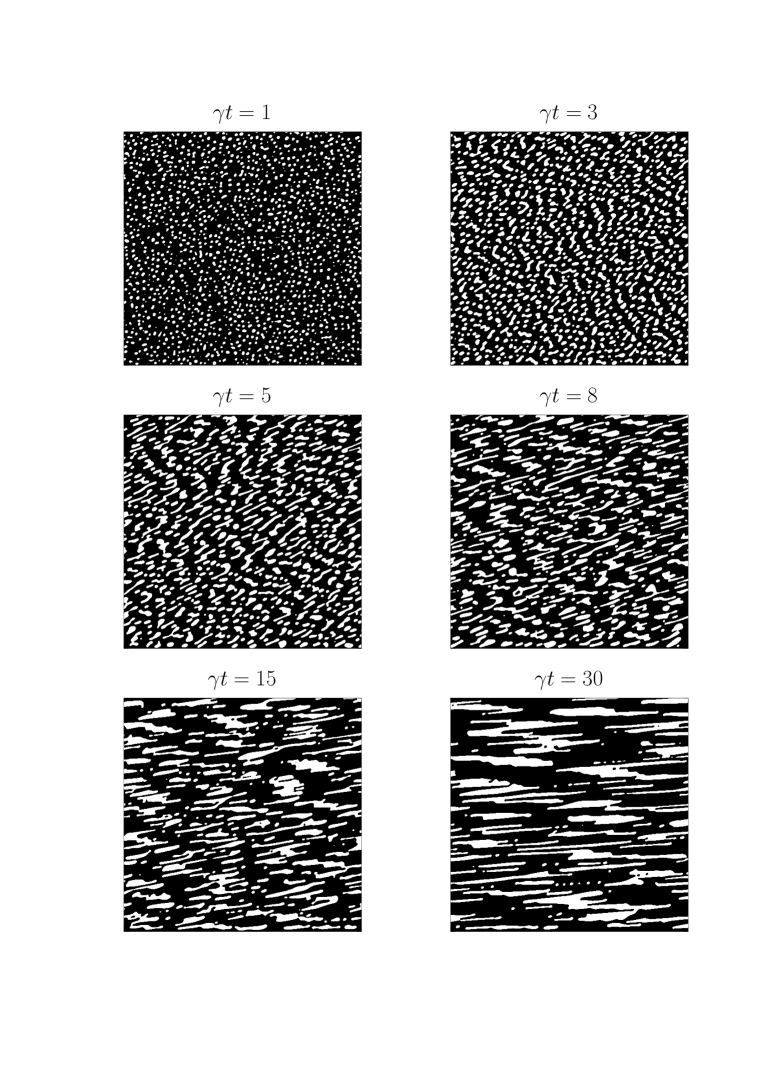
The effect of the advective term, due to shear, on the segregation process is investigated in this section. We used two values of the shear rate . In Figs. 3-4 a time sequence of configurations for each value of is shown. Snapshots are at the same values of the shear strain in order to have an immediate comparison between the two runs. For strains less than or of the order of one the effects of shear on the shape of bubbles are negligible: the mean sizes of the domains for a given shear rate remain directionally independent. However for the smaller shear rate the system generates bigger droplets because there is more time, keeping the strain fixed, for growth before the shear can influence the morphology.
This behaviour can be observed quantitatively computing the typical sizes of domains according to Eq. (7). The evolution of vs. is shown in Figs. 5-6. The ratio stays constant () until for both the shear rates, then a crossover is observed. Moreover, we see that at , and .
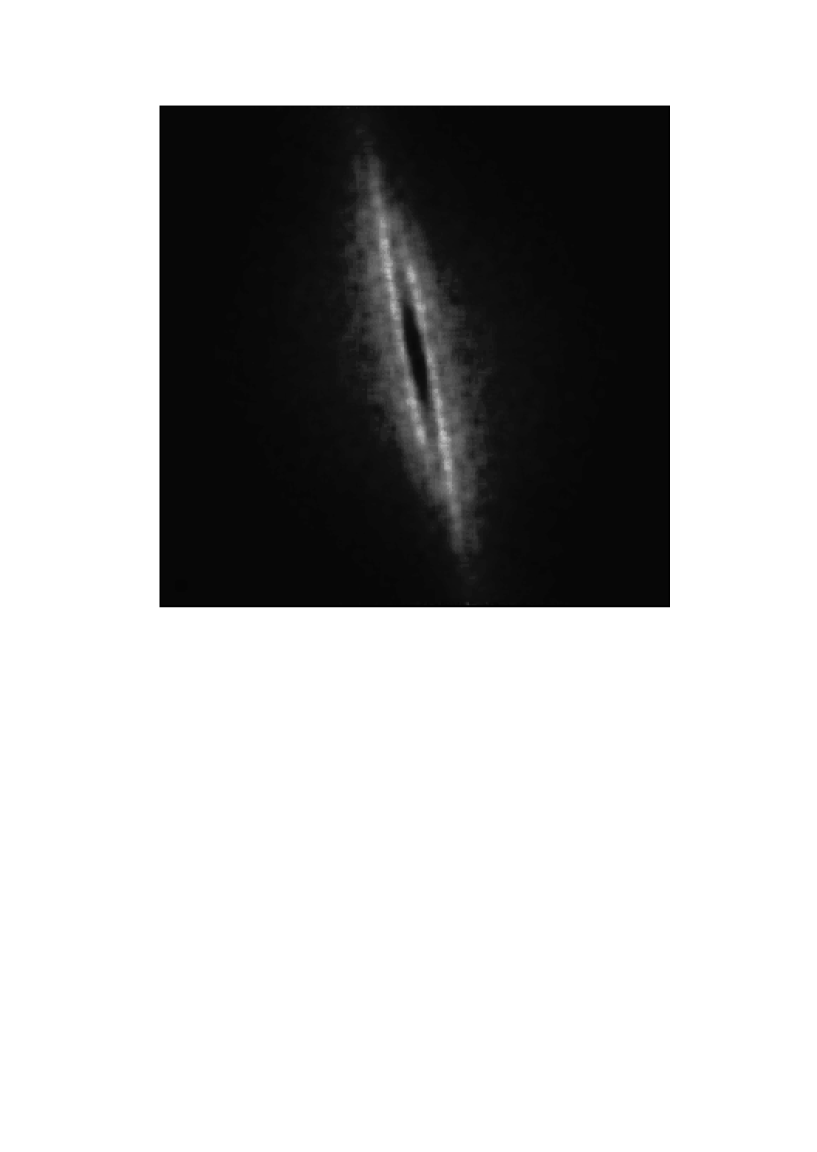
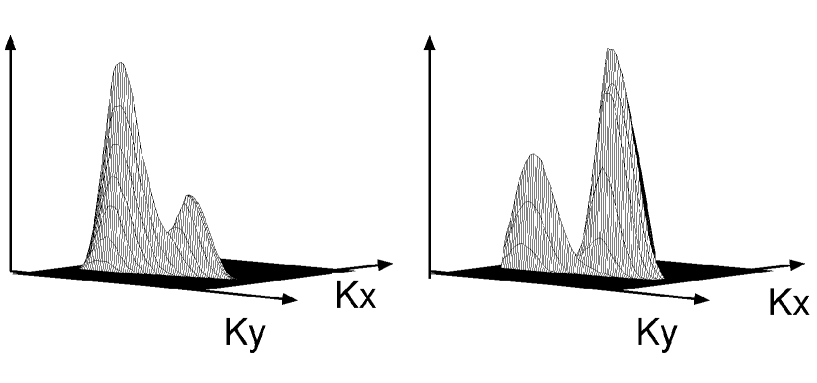
When the strain is larger than one, there is a competition between coarsening and shear-induced deformations of domains. For the smaller shear rate case, the diffusion-evaporation mechanism is still important and only domains which could grow in size are affected by the flow, while smaller ones evaporate. When the shear rate is larger, on the other hand, patterns grow smaller compared to those in the smaller shear rate case and diffusion from small to large droplets is inhibited as it can be seen in Fig. 4 at , where the minority phase is more dispersed, consisting of a large number of domains with smaller surfaces. In both the cases the growth is faster in the flow direction and domains assume a striplike shape aligned with the flow. As the elongation increases, non-uniform patterns appear. This phenomenon was observed also in the case of sheared critical quenches[10] and was interpreted as due to the presence in the system of two typical length scales in each direction, which compete in time. At there is an abundance of stretched domains which is also reflected in the local minima of (see Figs. 5-6). A convincing evidence of such a behaviour is given by the structure factor which is contour-plotted at in Fig. 7 for the case (a similar behaviour is observed also for the other value of ). It is separated in two distinct foils, each of them having two peaks. The presence of a four-peaked structure factor in sheared mixtures is a quite general feature which can be also shown mathematically [9]. Due to the symmetry , the foils are symmetric and one can consider only the two peaks of one foil. Let us consider the peaks which are in the half-plane . The peaks are located at and . The interpretation of a peak in the structure factor as the signature of the existence in the system of a characteristic length scale, indicates that there are two relevant length scales for each direction in the present case proportional to and in the flow and in the shear direction, respectively. This gives a value of around 2.3 and 2.1 for the ratio between the characteristic sizes of domains in the flow and in the shear direction, respectively. In the case of sheared quench of a symmetric mixture these ratios were 2.5 and 2.1 [10]. Considering the behaviour in the shear direction, we see that there are domains with two different thicknesses in the system (the behaviour in the flow direction is analogous). At the peak which prevails is the one located at , clearly indicating a larger abundance of thin domains, as already observed. Then, when the strain increases, domains are stretched and a cascade of ruptures occurs in those regions where the stress is higher and thicker domains, not yet broken, prevail as at . This mechanism produces an oscillation in time in the behaviour of the peaks of the structure factor and now it is the other peak, located at , to prevail. This is shown in Fig. 8 where a three-dimensional plot of one foil of the structure factor is pictured at two consecutive times. This mechanism is similar to the one observed in the case of symmetric mixtures under shear flow [10]. Such an oscillation affects also whose amplitude is reduced at higher shear rates. We investigated also the existence of a scaling regime, analogously to the one observed in the unsheared case. Due to the inevitable finite-size effects, simulations cannot give a convincing evidence of such a scaling regime. We showed in a previous paper[10], using a renormalization group scheme, that if there is scaling, then and . This means that the growth in the shear direction is not affected by the external velocity while in the flow direction there is an extra contribution of to the growth exponent coming from the advective term in Eq. (1). Our runs do not allow to check this prediction.
We also considered the rheological properties of the mixture. The excess viscosity was measured according to Eq. (8). The plots of as a function of are shown in Figs. 9-10. Starting from zero, shows a net increase up to a global maximum at , independent of the shear rate. This results from the stretching of domains caused by shear, which requires work against the surface tension. In the case with (Fig. 9) this increase is not monotonic and shows a first peak at . This first peak disappears by increasing . The height of the main peak depends on the shear rate being higher at smaller shear rates. This is due to the morphology of domains which have more interfaces for smaller (cfr. Figs. 3-4 at ), giving a larger contribution to . For larger times decreases due to the breakup of domains which dissipates energy previously stored. An oscillation is completed at , which is more evident for , and it is related to the corresponding oscillation in . If scaling were obeyed, one would expect to scale as [10]. Given the above discussed behaviour of and , it should be . This power law is roughly consistent with our data, especially for .
IV Conclusions
We studied the effects of a shear flow on the phase separation of binary mixtures with asymmetric composition. The binary mixture is described by a continuum free-energy functional and we have solved numerically the related model B. Simulations were carried out on two-dimensional systems; lattices are large enough to minimize finite-size effects.
Without shear we observe an asymptotic scaling regime with a growth exponent consistent with previous theoretical[19] and numerical[20] studies. Thanks to the size of the lattice, we could observe such an exponent over two time decades.
More interesting and rich is the phenomenology when an external flow is applied during the quench. The patterns are stretched and aligned along the flow direction. Besides this behaviour, domain growth competes with shear-induced deformations and at high shear rates the minority phase appears more dispersed and made of smaller domains. In the limit of very high shear rates one could observe a complete demixing. Moreover, domains with two different thickness are clearly visible in the simulations: we observe a larger abundance first of thin and, then, of thicker domains, analogously to what observed in sheared critical quenches[10]. The existence of two typical length scales in each spatial direction is related to a four-peaked structure factor. The alternate predominance of these length scales produces an oscillation between the peaks of the structure factor and in the physical observables of the system.
The rheological properties were investigated through the excess viscosity. This quantity increases up to a maximum and then decreases. This behaviour is associated to the stretching of domains, which requires work against the surface tension, and to the following ruptures of patterns which dissipates the stored energy. The position of the main peak as a function of the strain does not depend on the shear rate but its height decreases increasing due to the more dispersed morphology of the minority phase.
Finally, we want to mention that we could not give a definitive answer to the question, which is still matter of an open debate[20], whether growth continues indefinitely with shear or a steady state is reached. Related to this question there is the problem of a reliable determination of the growth exponents.
Acknowledgments
G.G. acknowledges partial support by INFM PRA-HOP 1999. A.L. acknowledges partial support by INFM PA-G01-1.
REFERENCES
- [1] A. J. Bray, Adv. Phys. 43, 357 (1994).
- [2] P. C. Hohenberg and B. I. Halperin, Rev. Mod. Phys. 49, 435 (1977).
- [3] T. Ohta, H. Nozaki, and M. Doi, Phys. Lett. A 145, 304 (1990); J. Chem. Phys. 93, 2664 (1990).
- [4] D. H. Rothman, Europhys. Lett. 14, 337 (1991).
- [5] J. F. Olson and D. H. Rothman, J. Stat. Phys. 81, 199 (1995).
- [6] Y. N. Wu, H. Skrdla, T. Lookman, and S. Y. Chen, Physica A 239, 428 (1997).
- [7] P. Padilla and S. Toxvaerd, J. Chem. Phys. 106, 2342 (1997).
- [8] Z. Shou and A. Chakrabarti, Phys. Rev. E 61, R2200 (2000).
- [9] F. Corberi, G. Gonnella, and A. Lamura, Phys. Rev. Lett. 81, 3852 (1998); Phys. Rev. E 61, 6621 (2000).
- [10] F. Corberi, G. Gonnella, and A. Lamura, Phys. Rev. Lett. 83, 4057 (1999); Phys. Rev. E 62, 8064 (2000).
- [11] A. J. Wagner and J. M. Yeomans, Phys. Rev. E 59, 4366 (1999).
- [12] M. E. Cates, V. M. Kendon, P. Bladon, and J. C. Desplat, Faraday Discussions 112, 1 (1999).
- [13] A. Lamura and G. Gonnella, Physica A 294, 295 (2001).
- [14] A. Onuki, J. Phys. Condens. Matter 9, 6119 (1997).
- [15] J. S. Rowlinson and B. Widom, Molecular Theory of Capillarity (Clarendon Press, Oxford, 1982).
- [16] T. M. Rogers, K. R. Elder, and R. C. Desai, Phys. Rev. B 37 9638, 1988.
- [17] A. W. Lees and S. F. Edwards, J. Phys. C 5, 1921 (1972).
- [18] I. M. Lifshitz and V. V. Slyozov, J. Phys. Chem. Solids 19, 35 (1961).
- [19] J. H. Yao, K. R. Elder, H. Guo, and M. Grant, Phys. Rev. B 45, 8173 (1992); 47, 14110 (1993).
- [20] For a review, see, J. M. Yeomans, Annu. Rev. Comput. Phys. VII (2000).