Anisotropic Colossal Magnetoresistance Effects in Fe1-xCuxCr2S4
Abstract
A detailed study of the electronic transport and magnetic properties of Fe1-xCuxCr2S4 () on single crystals is presented. The resistivity is investigated for K in magnetic fields up to kOe and under hydrostatic pressure up to 16 kbar. In addition magnetization and ferromagnetic resonance (FMR) measurements were performed. FMR and magnetization data reveal a pronounced magnetic anisotropy, which develops below the Curie temperature, , and increases strongly towards lower temperatures. Increasing the Cu concentration reduces this effect. At temperatures below 35 K the magnetoresistance, , exhibits a strong dependence on the direction of the magnetic field, probably due to an enhanced anisotropy. Applying the field along the hard axis leads to a change of sign and a strong increase of the absolute value of the magnetoresistance. On the other hand the magnetoresistance remains positive down to lower temperatures, exhibiting a smeared out maximum with the magnetic field applied along the easy axis. The results are discussed in the ionic picture using a triple-exchange model for electron hopping as well as a half-metal utilizing a band picture.
pacs:
75.30.Vn, 71.30.+hI Introduction
Manganites, especially LaMnO3 and relatives, are known for their unusual transport and magnetic properties since more than 50 years.Jonker and van Santen (1950); van Santen and Jonker (1950) However, the appreciation and intensive interest is a recent development, which started with the giant magnetoresistance (actually named colossal magnetoresistance, CMR) in thin films of La2/3Ba1/3MnO3, published by von Helmolt et al. in 1993,von Helmolt et al. (1993) even though a negative magnetoresistance of nearly 20 % was discovered in bulk La0.69Pb0.31MnO3 by Searle and Wang already in 1970.Searle and Wang (1970) Soon after the onset of the renewed interest in these materials, it was realized that the theoretical framework used in the past to understand the manganites’ behaviour does not survive a quantitative analysis.Millis et al. (1995); Salamon and Marcelo (2001) The complexity of the problem led to the perception that manganites are prototypical for correlated electron systems, where spin, charge and orbital degrees of freedom are strongly coupled. These couplings lead to a failure of the classical approach, which neglects some interactions for simplification, and opens the way for a complete range of new physics. As a consequence the experimental and theoretical studies of manganites and related compounds give the unique opportunity of getting a deeper understanding of the fundamental physics responsible for phenomena like colossal magnetoresistance or high-temperature superconductivity.
Looking for new materials exhibiting a CMR effect, the substitution of oxygen with the isoelectronic sulphur seems to be a promising way.Ramirez (1997) Magnetoresistance effects in some chalcogenide spinels were reported previously by Watanabe Watanabe (1973) and Ando Ando et al. (1979). An elaborately review about this is given in Ref. van Stapele, 1982. Since the CMR is associated with a double-exchange mechanism, the rediscovery of a CMR effect in the chalcospinel FeCr2S4,Ramirez et al. (1997) which is neither oxide nor perovskite, opened a wide field for the further exploration and exploitation of magnetoresistance effects.
FeCr2S4 is a ferrimagnetic semiconductor, crystallizing in the normal spinel structure, where the Cr ions occupy the octahedral and the Fe ions the tetrahedral sites.Haacke and Beegle (1967) The Fe- and the Cr-sublattices are aligned antiparallel in the ferrimagnetic state. In single-crystalline FeCr2S4 the Curie temperature is K and around a negative magnetoresistance is observed.Ramirez et al. (1997) Doping with non-magnetic Cu on the Fe site, Fe1-xCuxCr2S4 (), shifts the Curie temperature upwards accompanied by a decreasing magnetoresistance without changing substantially the magnetic properties.Haacke and Beegle (1967)
Polycrystalline samples of Fe1-xCuxCr2S4 were first synthesized in the fifties and sixties of the last century. Hahn et al. (1956) To explain the physical properties two competing models with different valences of the involved ions were proposed. Lotgering et al.Lotgering et al. (1969) developed a model considering a monovalent Cu+-ion over the whole concentration range, while Goodenough Goodenough (1969) postulated divalent Cu2+ for the concentration range . Furthermore the existence of monovalent S- was discussed at these times.Lotgering et al. (1969)
Mößbauer-spectroscopy studies reveal divalent Fe2+ ions in FeCr2S4, but trivalent Fe3+ in Fe0.5Cu0.5Cr2S4.Haacke and Noizik (1968); Chen et al. (1999) X-ray photoelectron-spectroscopy measurements show that Cu is monovalent in Fe0.5Cu0.5Cr2S4 and in CuCr2Se4, which means it is in a state Tsurkan et al. (2000). NMR-measurements and band-structure calculations lead to the same conclusion for the Cu valence in CuIr2S4.Matsuno et al. (1997); Radaelli et al. (2002) All samples under investigation in this study were prepared as described in Ref. Tsurkan et al., 2000 and found to contain only divalent S. Therefore Cu existing only in the non-magnetic state and divalent S only is assumed. The later discussion adopts this assumption.
II Experimental Methods
Single crystals of Cu-substituted FeCr2S4 were grown by the chemical transport-reaction method from polycrystalline material obtained by a solid-state reaction. In this paper samples with Cu-concentrations , , , , , and are studied.
The X-ray diffraction measurements were performed with a Stoe X-ray diffractometer. Single crystals were powdered and diffraction spectra were taken from to and analyzed with the Visual XPOW software.
The magnetic properties were measured using a superconducting quantum interference device (SQUID) magnetometer (Quantum Design) in the temperature range K in external fields up to 70 kOe. In addition ferromagnetic (or better ferrimagnetic) resonance (FMR) measurements were carried out at X-band frequencies (9.4 GHz) with a Bruker ELEXSYS E500-CW spectrometer using a continuous Helium gas-flow cryostat (Oxford Instruments) for temperatures . For the FMR experiments thin polished disks prepared in plane orientation with about 1 mm diameter and 0.05 mm thickness were used.
The electrical resistivity was measured in an Oxford 4He cryostat equipped with a superconducting magnet capable of magnetic fields up to 16 T. Conventional dc four-point techniques were used with currents between 0.5 and 500 A at temperatures . Gold wire with a diameter of m and silver paint were used to prepare the electrical contacts. The contact resistance was always between and . To prevent problems occurring due to aging of the contacts, leading to a contact resistance several orders of magnitudes higher, the measurements were performed immediately after preparing the contacts.
Hydrostatic pressure was produced in a conventional Be-Cu clamp type cell using fluorinert™ as a pressure medium. The pressure at low temperatures was determined from the shift of the inductively measured of a small piece of lead, located in immediate proximity to the sample. The width of the superconducting transition of Pb did not exceed 15 mK, indicating good hydrostatic conditions and providing an estimate of the pressure-measurement uncertainty, kbar. The pressure at room temperature was determined from the pressure dependence of the resistivity of a manganin wire placed inside the cell.
III Experimental Results
III.1 X-ray Diffraction

In FeCr2S4 the substitution of Fe by Cu leads to a linear dependence of the lattice parameter of the cubic spinel structure on the Cu concentration following Vegard’s law, as shown in figure 1. In addition, the X-ray studies of powdered single crystals confirmed single-phase material with no detectable parasitic phases.
III.2 Magnetization
| (K 0.5) | (290 K) (mcm ) | |
|---|---|---|
| 0 | 167 | 236 (Ref. Tsurkan et al., 2001a) |
| 0.05 | 182 | 79.2 |
| 0.1 | 197 | 8.2 |
| 0.2 | 215 | 10.1 |
| 0.3 | 232 | 11.6 |
| 0.4 | 236 | 14.9 |
| 0.5 | 275 | 26.8 |
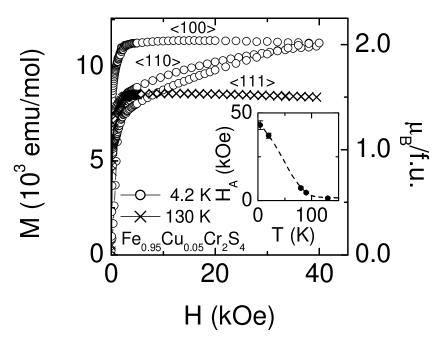
The Curie temperatures of Fe1-xCuxCr2S4 are listed in table 1, as determined by the kink-point-method Arrott (1971) from magnetization measurements, and the room temperature resistivity, which will be discussed in section IV.2. The Curie temperature increases with the Cu-concentration . The same trend has been observed for polycrystalline samples,Haacke and Beegle (1967) though for higher Cu concentrations remains at a lower value in single crystals. Figure 2 shows the magnetization, , for Fe0.95Cu0.05Cr2S4 versus the magnetic field, , at K and K, respectively. At K the magnetic anisotropy is clearly observed. For the easy magnetization axis the saturation is already reached at kOe whereas for the hard axis and the intermediate axis saturation only occurs at kOe. The temperature dependence of the anisotropy field , defined by the magnetic field where saturation is reached for all three directions, is shown in the inset of figure 2. It decreases monotonically with increasing temperature and vanishes at .
III.3 FMR-Measurements
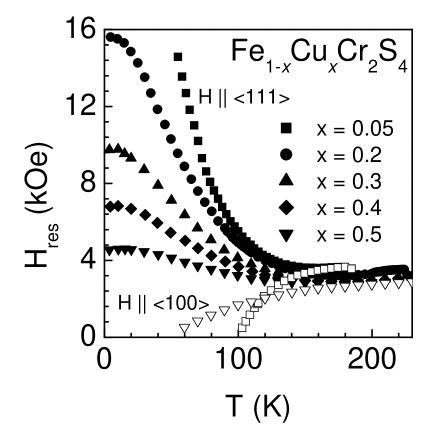
For a more detailed analysis of the magnetic anisotropy we performed ferromagnetic resonance (FMR) measurements, which will be published in a separate paper. Here we confine ourselves to the presentation of one illustrative result, which nicely reflects the evolution of the anisotropy with increasing Cu concentration and can be explained on the base of the FMR results published recently for FeCr2S4 single crystals.Tsurkan et al. (2001b) For the samples under investigation () the FMR line exhibits an analogous behavior to the pure compound . Figure 3 shows the temperature dependence of the resonance field for several Cu concentrations below the Curie temperature. The static magnetic field was applied along an or axis within the plane of the disk-shaped samples and the magnetic microwave field was applied perpendicular to the plane. This geometry allows measurements at different orientations of the static field in the plane without change of the demagnetization contributions to the resonance condition.Kittel (1947, 1948) Just below the Curie temperature the resonance field is approximately isotropic given by the Larmor frequency , with the microwave frequency and the gyromagnetic ratio determined by the g-values of the two sublattices.Gurevich and Melkov (1996) With decreasing temperature one observes first a slight shift to smaller fields due to the demagnetization but then a strongly anisotropic behavior appears. For the magnetic field applied along the easy axis, the resonance line shifts to low fields and disappears at a finite temperature as shown exemplarily for and . For the field applied parallel to the hard axis, the resonance field shifts to higher fields. A similar shift to higher fields is observed for orientation along the intermediate axis (not shown in figure 3). The maximum shift at low temperatures decreases with increasing Cu concentration.
This result is directly related to the decrease of the magnetic anisotropy. Neglecting the demagnetization effects, which turn out to be small compared to the anisotropy field at low temperatures Tsurkan et al. (2001b) and taking into account only the first-order cubic anisotropy field , where is the first-order cubic anisotropy constant, the resonance conditions read for and orientation, respectively:Gurevich and Melkov (1996)
| (1) |
Hence, the resonance shift from the Larmor frequency is proportional to the anisotropy field. For the shift is negative and the resonance disappears at zero field. However, the shift is positive for and can be followed down to lowest temperatures, only limited by the field range, which is accessible to the electromagnet. For this reason we can directly compare the temperature dependence of the anisotropy field calculated from the magnetization measurements for (inset of figure 2) with the temperature dependence of the FMR shift and use the results from FMR to determine the anisotropy field for all Cu concentrations. This clearly indicates the continuous decrease of the magnetic anisotropy with increasing Cu concentration.
III.4 Electrical Resistivity
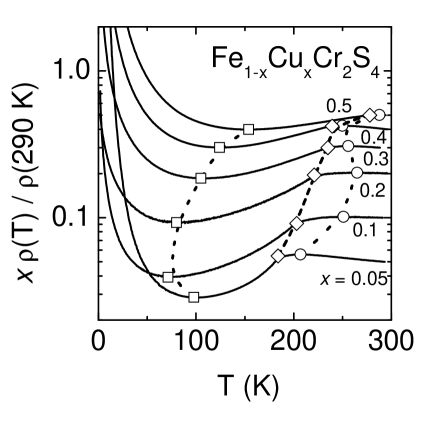
Figure 4 shows a semi-logarithmic plot of the resistivity of Fe1-xCuxCr2S4 normalized by the room-temperature resistivity and multiplied with the Cu concentrations , , , , , and , to enable the identification of the different concentrations. The absolute values of the resistivity at room temperature are summarized in table 1. One should keep in mind that such absolute values are given with a large uncertainty. The given error of is the error due to the determination of the geometric factor. A similar order of magnitude and tendency of concentration dependence of the values given here was observed in single crystals by Haacke and Beegle.Haacke and Beegle (1968)
The resistivity of Fe1-xCuxCr2S4 () exhibits a non-monotonic behavior with a local maximum slightly above and a broad minimum below . The resistivity increases strongly at low temperatures, indicating the insulating ground state of the system. The existence of the local extrema is in agreement with the results in FeCr2S4.Ramirez et al. (1997); Watanabe (1973); Tsurkan et al. (2001a)
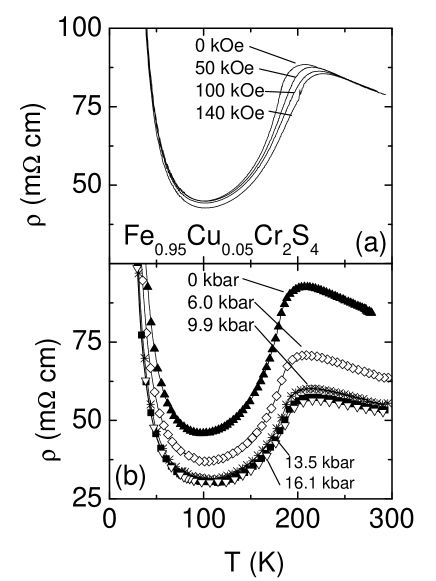
The resistivity of Fe0.95Cu0.05Cr2S4 is plotted in figure 5 (a) for different magnetic fields, 0, 50, 100 and 140 kOe. The magnetic field is applied along the hard axis (-direction), the current is applied in -direction. The maximum in the vicinity of the Curie temperature slightly shifts to higher temperatures, while the minimum remains at a constant temperature with increasing magnetic field. The concentrations , 0.2, 0.3, and 0.5 show a similar dependence on magnetic field.
The resistivity of Fe0.95Cu0.05Cr2S4 was also measured under hydrostatic pressure. In figure 5 (b) the resistivity of Fe0.95Cu0.05Cr2S4 for different pressures up to kbar is shown. Under a pressure of kbar the resistivity is reduced by at room temperature. The minimum as well as the local maximum are shifted to higher temperatures (see figure 9 (b) for and ).
IV Discussion
IV.1 The ionic picture: Triple exchange model
The system Fe1-xCuxCr2S4 can be divided in two different concentration regimes and with different physical properties. The concentration range will be treated in a forthcoming paper.
In the region the valences of the ions can be described by the formula
| (2) |
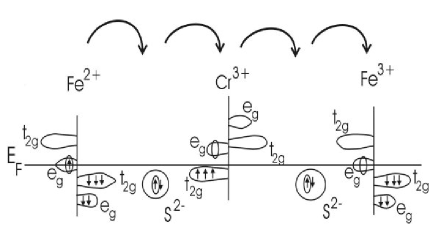
This description was already given by Lotgering et al.Lotgering et al. (1969) and Goodenough.Goodenough (1969) As a conduction mechanism Palmer and Greaves proposed a triple-exchange model.Palmer and Greaves (1999) In this model the electrical conduction is established via hopping between Fe2+ and Fe3+. An illustration is given in figure 6. Fe2+ has six -electrons, where the sixth electron is located in the -band with the spin antiparallel to the spins of the other five electrons of Fe and parallel to the Cr-moments, which define the direction of the magnetization. The single electron in the Fe’s spin-up -band hops with an exchange mechanism, similar to the well-known double-exchange,Zener and Heikes (1953) via a -orbital of the sulphur to Cr, providing an additional electron on the Cr site leading to an intermediate Cr2+ state. From there it proceeds via the second S to the Fe3+, changing the valence to Fe2+. Because of its antiparallel alignment to the remaining -electron spins of the Fe, the spin of the hopping electron is parallel to the spin of the electrons in the Cr -band.Palmer and Greaves (1999)
The observed temperature and magnetic field dependence of the resistivity for can be explained by the triple-exchange model. In the paramagnetic region above semi-conducting behaviour due to thermal activated hopping is observed. At the system enters the magnetically ordered state and the Cr and Fe spins are aligned antiparallel, stimulating the hopping via the triple-exchange mechanism and leading to a positive temperature slope of the resistivity. For the absolute values of the resistivity one would expect a minimum at a Cu concentration , where an equal amount of Fe2+ and Fe3+ exists. The values for the resistivity given in table 1 show a broad minimum between and . This is an indication, that the system cannot be described by an pure ionic picture only. Thus, in the next section a description in a band picture will be given.
The attempts to fit the low-temperature increase of the resistivity with an Arrhenius- () or a variable-range hopping law () failed. The rise of the resistivity is weaker than either a simple Arrhenius- or variable-range hopping law and probably cannot be explained by only a single mechanism alone. In the whole temperature regime, variable range hopping is assumed to be the relevant conduction mechanism. But below the ordering temperature the triple exchange enhances the conductivity compared to the simple variable-range hopping process, correlated with the magnetic anisotropy. Also in the ordered phase, there might be additional contributions to the resistivity from magnon scattering which increases with increasing temperature.
IV.2 The band picture: Fe1-xCuxCr2S4 as a half metal
We assume the Fermi-edge to be located within the Fe spin-up -band, as it is shown in figure 6. This assumption is supported by band-calculations of Park et al., who describe Fe1-xCuxCr2S4 as a half-metallic ferromagnet.Park et al. (1999) The half-metallic ferromagnetic state is realized, if all spins are fully polarized forming one metallic and one insulating band.de Groot et al. (1983) From their calculations Park et al. expected a metallic ground state for FeCr2S4. The metallic ground state is changed by Coulomb interactions splitting the Fe band, leading to a Mott-insulator.Park et al. (1999) In addition this splitting is supported by the Jahn-Teller effect Feiner (1982), which is peculiar to Fe2+ ions and shown by Mössbauer experiments.Spender and Morrish (1972). At higher temperatures near the thermal activation is high enough to overcome the band splitting, which leads to the observed positive temperature gradient in the resistivity below . Above the spins are not ordered anymore and a simple hopping conductivity is established.
Substituting Fe by Cu empties the Fe2+ spin-up band and, thus, destroys the band splitting, which explains the strong decrease of the resistivity in the concentration range up to . Further substitution of Fe with Cu empties the Fe2+ spin-up band, reducing the number of charge carriers and, thus, leads to an eventual increase of the resistivity with increasing .
At all Fe ions should be trivalent and an insulating ground state is found (although Park et al. assume Cu2+).Park et al. (1999) Nevertheless, in the region below a positive temperature gradient of the resistivity is found. To understand this, one has to look on the concentration range . Here we assume a double-exchange mechanism between Cr3+ and Cr4+ via S, as proposed by Lotgering et al.Lotgering (1964) Slight off-stoichiometries in Fe0.5Cu0.5Cr2S4 can lead to either that not all Fe2+-ions are changed completely to Fe3+ or that already at concentrations Cr3+-ions start to be turned in Cr4+ and, thus, give the possibility to process double-exchange in the ordered regime below .
Cu+ is in -state and therefore has a closed -shell. That is why in the ionic picture Cu is not supposed to contribute to the conductivity. In the band picture the - and -band are completely filled, thus also in this case no contribution to the conductivity is expected.
IV.3 Influence of the magnetic field

The magnetic order is anisotropic due to a strong spin-orbit coupling of the tetrahedral Fe2+ ions in the -state.Feiner (1982); Hoekstra et al. (1972); Goldstein et al. (1976) The -electron located in the -band (see figure 6) perturbs the symmetry of the charge distribution. This leads to a preferred orientation of the orbitals and with the spin-orbit-coupling to the observed magnetic anisotropy.

In figure 7 (a) the magnetoresistance of Fe1-xCuxCr2S4 is displayed. Note, that in our definition if . For all concentrations the field was applied along the hard axis . As the magnetic field aligns the spins, the triple-exchange is enhanced and the conductivity grows. This enhancement is most pronounced at due to the onset of spontaneous order and decreases to lower temperatures. At the Curie temperature a peak arises, which was theoretically predicted in metals Campbell and Fert (1982) and is smeared out with increasing Cu-concentration. The maximum of the magnetoresistance vs the Cu-concentration is drawn in figure 7 (b). It drops from at to at . In the region between 100 and 35 K the magnetoresistance changes its sign and its absolute value grows up to at K for . The values of the magnetoresistance at K in dependence of the Cu-concentration are plotted in figure 7 (c). With increasing Cu concentration the magnitude of the magnetoresistance is reduced from at to at . Using the idea of triple exchange, the last results indicate that obviously the magnetic field, applied along the hard axis, leads to a weak distortion of the -orbital of Fe out of its preferred direction, reducing the overlap between the orbitals that participate in the hopping process, and therefore to the observed enhancement of the resistance in a magnetic field.
Applying a magnetic field along the easy axis allows the Fe orbital to remain in its favored direction and so the overlap between the orbital of Fe and the orbital of S is not changed significantly. In this case the magnetoresistance remains positive to lower temperatures, as it is shown in figure 8. There the magnetoresistance of Fe0.95Cu0.05Cr2S4 and Fe0.9Cu0.1Cr2S4 is displayed with the magnetic field applied along the easy and along the hard axis. When applying the field along the easy axis, the magnetoresistance exhibits a weak maximum. It changes sign at significantly lower temperatures than upon application of the field along the hard axis only for the sample with Cu concentration . This change of sign may result from small misorientations of the sample in the magnetic field, due to the experimental conditions.
IV.4 Influence of hydrostatic pressure
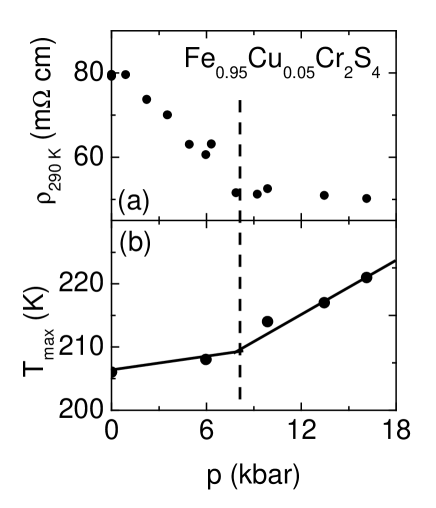
In Ref. Tsurkan et al., 2001a was shown that by the application of pressure the Curie temperature is shifted to higher temperatures as indicated by the shift of the temperature of the local maximum of the curves. Therefore we conclude that the same effect works for the Cu-doped compounds, and the shift of can be taken as the shift of .
The pressure dependence of the resistivity of Fe0.95Cu0.05Cr2S4 at K is drawn in figure 9 (a). At a pressure of approximately kbar the resistivity has declined about from its value at ambient pressure. For higher pressures stays constant. On the other hand, the temperature of the local maximum in the curve (see figure 5 (b)) increases stronger with pressures above kbar, as shown in figure 9 (b). Therefore one can assume that the effect of hydrostatic pressure is changed, when a critical value kbar is exceeded. In contrast to La1-xSrxMnO3, where a linear pressure dependence was found,Moritomo et al. (1995) in the present system two different pressure regimes with different pressure gradients in are in place.
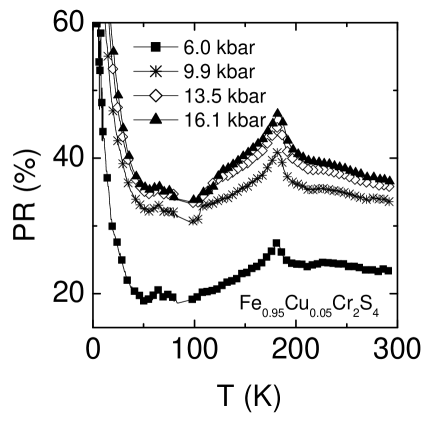
Figure 10 displays the effect of pressure on the electrical resistance (), which is defined in analogy to the magnetoresistance as . There are two remarkable features: first of all, at the Curie temperature a peak, similar to the magnetoresistance, arises, however, second the value of does not change sign at low temperatures and its absolute value increases up to .
The application of hydrostatic pressure is expected to increase the overlap between the orbitals and to broaden the bands, resulting in an enhanced mobility of the charge carriers and a reduction of the energy gap between the bands. This yields an enhanced electric conductivity, which is illustrated in figure 10. Similar behavior was found in manganites, for example in polycrystalline La1-xCaxMnO3.Neumeier et al. (1995) If one would approximately describe the different conducting mechanisms with different hopping laws, a reduction of the hopping barriers automatically yields the strong increase of the value at low temperatures. However, it is necessary to bear in mind that the pressure is relatively moderate in the present study. Thus its effect on the hopping barriers is not expected to be such large and one has to look for an other mechanism. For example the pressure might affect the Jahn-Teller distortion and this way reinforce the conductivity.
V Conclusion
In this paper X-ray, magnetization, FMR and resistivity data from single crystals of Fe1-xCuxCr2S4 are presented. The results are discussed in a hopping model, where the conductivity is explained by triple-exchange mechanisms for the concentration range and double-exchange for .
Applying an external magnetic field or hydrostatic pressure to the system () has qualitatively an analogous effect for temperatures around the Curie temperature : the overlap of the orbitals is enhanced and the bands are broadened. Thus the conductivity increases, while is shifted upward. At lower temperatures this similarity of the effect of an external magnetic field and hydrostatic pressure vanishes. While the value of shows a strong upturn at low temperatures, in the magnetoresistance a strong anisotropy arises. Applying the magnetic field along the hard axis leads to a strong negative magnetoresistance, while applying the field along the easy axis results in a flat maximum in the magnetoresistance. Since the origin of this unusual feature is still unclear, further investigations of the electronic and orbital correlations in Fe1-xCuxCr2S4 are needed and a promising challenge for future experiments and theoretical calculations.
Acknowledgements.
We would like to thank V. Sidorov for his assistance in the pressure measurements. This work was supported by the BMBF via VDI/EKM, FKZ 13N6917/18 and by DFG within SFB 484 (Augsburg). Work at Los Alamos was performed under the auspices of the U.S. DOE.References
- Jonker and van Santen (1950) G. Jonker and J. H. van Santen, Physica 16, 337 (1950).
- van Santen and Jonker (1950) J. H. van Santen and G. Jonker, Physica 16, 599 (1950).
- von Helmolt et al. (1993) R. von Helmolt, J. Wecker, B. Holzapfel, L. Schultz, and K. Samwer, Phys. Rev. Lett. 71, 2331 (1993).
- Searle and Wang (1970) C. W. Searle and S. T. Wang, Can. J. Phys. 48, 2023 (1970).
- Millis et al. (1995) A. J. Millis, P. B. Littlewood, and B. I. Shraiman, Phys. Rev. Lett. 74, 5144 (1995).
- Salamon and Marcelo (2001) M. B. Salamon and J. Marcelo, Rev. Mod. Phys. 73, 583 (2001).
- Ramirez (1997) A. P. Ramirez, J. Phys.: Condens. Matter 9, 8171 (1997).
- Watanabe (1973) T. Watanabe, Solid State Commun. 12, 355 (1973).
- Ando et al. (1979) K. Ando, Y. Nishihara, T. Okuda, and T. Tsushima, J. Appl. Phys. 50, 1917 (1979).
- van Stapele (1982) R. P. van Stapele, in Ferromagnetic Materials (North-Holland Publishing Company, 1982), vol. 3, pp. 603–745.
- Ramirez et al. (1997) A. P. Ramirez, R. J. Cava, and J. Krajewski, Nature 386, 156 (1997).
- Haacke and Beegle (1967) G. Haacke and L. C. Beegle, J. Phys. Chem. Solids 28, 1699 (1967).
- Hahn et al. (1956) H. Hahn, C. de Lorent, and B. Harder, Z. Anorg. Chem. 283, 138 (1956).
- Lotgering et al. (1969) F. K. Lotgering, R. P. van Stapele, G. H. A. M. van der Steen, and J. S. van Wieringen, J. Phys. Chem. Solids 30, 799 (1969).
- Goodenough (1969) J. B. Goodenough, J. Phys. Chem. Solids 30, 261 (1969).
- Haacke and Noizik (1968) G. Haacke and A. J. Noizik, J. Solid State Commun. 6, 363 (1968).
- Chen et al. (1999) Z. Chen, S. Tan, Y. Zhaorong, and Y. Zhang, Phys. Rev. B 59, 11172 (1999).
- Tsurkan et al. (2000) V. Tsurkan, M. Demeter, B. Schneider, D. Hartmann, and M. Neumann, Solid State Commnun. 114, 149 (2000).
- Matsuno et al. (1997) J. Matsuno, T. Mizokawa, A. Fujimori, D. A. Zatsepin, V. R. Galakhov, E. Z. Kurmaev, Y. Kato, and S. Nagata, Phys. Rev. B 55, R15979 (1997).
- Radaelli et al. (2002) P. G. Radaelli, Y. Horibe, M. J. Gutmann, H. Ishibashi, C. H. Chen, R. M. Ibberson, Y. Koyama, Y.-S. Hor, V. Kiryukhin, and S.-W. Cheong, Nature 416, 155 (2002).
- Tsurkan et al. (2001a) V. Tsurkan, I. Fita, M. Baran, R. Puzniak, R. Szymczak, H. Szymczak, S. Klimm, M. Klemm, S. Horn, and R. Tidecks, J. Appl. Phys. 90, 875 (2001a).
- Arrott (1971) A. Arrott, J. Appl. Phys. 42, 1282 (1971).
- Tsurkan et al. (2001b) V. Tsurkan, M. Lohmann, H.-A. Krug von Nidda, A. Loidl, S. Horn, and R. Tidecks, Phys. Rev. B 63, 125209 (2001b).
- Kittel (1947) C. Kittel, Phys. Rev. 71, 270 (1947).
- Kittel (1948) C. Kittel, Phys. Rev. 73, 155 (1948).
- Gurevich and Melkov (1996) A. G. Gurevich and G. A. Melkov, Magnetization Oscillations and Waves (CRC Press, Boca Raton, FL, 1996).
- Haacke and Beegle (1968) G. Haacke and L. C. Beegle, J. Appl. Phys. 39, 656 (1968).
- Palmer and Greaves (1999) H. M. Palmer and C. Greaves, J. Mater. Chem. 9, 637 (1999).
- Zener and Heikes (1953) C. Zener and R. R. Heikes, Rev. Mod. Phys. 25, 191 (1953).
- Park et al. (1999) M. S. Park, S. K. Kwon, S. J. Youn, and B. I. Min, Phys. Rev. B 59, 10 018 (1999).
- de Groot et al. (1983) R. A. de Groot, F. M. Mueller, P. G. van Engen, and K. H. J. Buschow, Phys. Rev. Lett. 50, 2024 (1983).
- Feiner (1982) L. F. Feiner, J. Phys. C: Solid State Phys. 15, 1515 (1982).
- Spender and Morrish (1972) M. R. Spender and A. H. Morrish, Solid State Commun. 11, 1417 (1972).
- Lotgering (1964) F. K. Lotgering, Solid State Commun. 2, 55 (1964).
- Hoekstra et al. (1972) B. Hoekstra, R. P. van Stapele, and A. B. Voermans, Phys. Rev. B 6, 2762 (1972).
- Goldstein et al. (1976) L. Goldstein, P. Gibart, and L. Brossard, in AIP Conf. Proc. (1976), vol. 29, pp. 405–407.
- Campbell and Fert (1982) I. A. Campbell and A. Fert, in Ferromagnetic Materials (North-Holland Publishing Company, 1982), vol. 3, pp. 747–804.
- Moritomo et al. (1995) Y. Moritomo, A. Asamitsu, and Y. Tokura, Phys. Rev. B 51, 16491 (1995).
- Neumeier et al. (1995) J. J. Neumeier, M. F. Hundley, J. D. Thompson, and R. H. Heffner, Phys. Rev. B 52, R7006 (1995).