Measuring the Nematic Order of Colloidal fd Virus by X-ray Diffraction
Abstract
The orientational distribution function of the nematic phase of the semi-flexible rod-like virus fd is measured by x-ray diffraction as a function of concentration and ionic strength. X-ray diffraction from a single-domain nematic phase of fd is influenced by interparticle correlations at low angle while only intraparticle scatter contributes at high angle. Consequently, the angular distribution of the scattered intensity arises from only the single particle orientational distribution function at high angle but it also includes spatial and orientational correlations at low angle. Experimental measurements of the orientational distribution function from both the interparticle and intraparticle scattering were made to test whether the correlations present in interparticle scatter influence the measurement of the single particle orientational distribution function. It was found that the two types of scatter yield consistent values for the nematic order parameter. It was also found that x-ray diffraction is insensitive to the orientational distribution function’s precise form, and the measured angular intensity distribution is described equally well by both Onsager’s trial function and a Gaussian. At high ionic strength the order parameter of the nematic phase coexisting with the isotropic phase approaches theoretical predictions for long semi-flexible rods , but deviations from theory increase with decreasing ionic strength. The concentration dependence of the nematic order parameter was also found to better agree with theoretical predictions at high ionic strength, indicating that electrostatic interactions have a measurable effect on the nematic order parameter. The measured x-ray order parameters are also shown to be proportional to the measured birefringence and the saturation birefringence of fd is measured, enabling a simple, inexpensive way to measure the order parameter.
I Introduction
The first step to understand the effect of steric interactions in colloidal rod systems was taken in 1949, when Onsager wrote his seminal paper on the phase behavior of hard and charged rods Onsager (1949). Onsager developed a free energy theory at the second virial level describing the phase transition of hard rods from an isotropic phase, in which the particles are randomly oriented, to a nematic phase, in which particles are oriented in a distribution about a preferred direction. All theoretical predictions for the properties of this phase transition, such as the coexistence concentrations and the nematic order parameter, depend on the functional form of the orientational distribution of the rods in the nematic phase. Onsager chose one test function and in a later review paper Odijk showed that qualitatively similar results for the properties of the phase transition can be found by choosing a Gaussian test function Odijk (1986). The exact form of the orientational distribution function that satisfies the Onsager theory can be obtained via series expansion Lasher (1970); Kayser and Raveche (1978); Lekkerkerker et al. (1984) or by direct iterative methods Herzfeld et al. (1984); Lee and Meyer (1986). Determining the orientational distribution function of the nematic phase of a colloidal rod system is the most sensitive test of whether a system is described by Onsager’s theory.
In this paper we measure the measure the concentration and ionic strength dependence of the orientational distribution function of fd virus via x-ray diffraction. The fd virus is a charged semi-flexible rod with a length to diameter ratio . The electrostatic charge on the rods can be taken into account by an effective diameter , larger than the bare diameter, which is approximately equal to the distance between particles when the interaction potential is about . The exact calculation for the effective diameter is outlined in Ref. Onsager (1949); Tang and Fraden (1995); Stroobants et al. (1986a). An increase in ionic strength of the solution containing the charged rods produces a decrease in effective diameter. In Onsager’s theory, the limit of stability of the isotropic phase is predicted to be , where is the number density Kayser and Raveche (1978). This is predicted to be valid for long rods with a length to effective diameter ratio greater than 100 Straley (1973). Previously the isotropic and nematic coexistence concentrations fd have been measured as a function of ionic strength and it has been shown to agree well with numerical results from Chen for a semi-flexible rod of with a ratio of persistence to contour length of 2.5 Tang and Fraden (1995). Theoretical models suggest that semi-flexibility also acts to significantly lower the nematic order parameter at coexistence. For fd, a relatively rigid polymer with a ratio of persistence to contour length of 2.5, the nematic order parameter at coexistence is predicted to be , which is significantly smaller than predicted for rigid rods, approximately Chen (1994). Several review articles describe in more detail the theoretical and experimental aspects of this and other systems described by Onsager’s theory Straley (1973); Odijk (1986); Gelbart and Barboy (1980); Lekkerkerker and Vroege (1993); Sato and Teramoto (1996); Fraden (1995); Forsyth et al. (1978); Kassapidou et al. (1995); Davidson et al. (1997).
In x-ray diffraction, the scattered intensity consists of two parts, intraparticle scatter and interparticle scatter . The intensity can be written as a product of the two types of scatter
| (1) |
where is the three dimensional reciprocal vector in cylindrical coordinates . In a uniaxial nematic, is perpendicular to the nematic director and the scattered intensity is independent of the azimuthal angle about the director. If the system is oriented such that the nematic director is in the direction, can be described by . The intraparticle interference, or form factor, contains information about the structure of the individual particles. can also be written as where is the fourier transform of the electron density of a particle and the average is over all the particles and their orientations. The interparticle interference, or structure factor term, contains information about the positional and orientational correlations between particles. The structure factor depends on the positions of the centers of gravity of two scatterers and their relative orientations Maier et al. (1992):
| (2) |
The orientation of the particles is included in and the average is over all particles and their orientations. For isotropic scatterers, and the structure factor and the form factor decouple, but for anisotropic scatterers, unless the particle orientations are the same. Therefore, in contrast to scatter from spheres, the structure factor of rods can not, in general, be decoupled from its anisotropic form factor .
In a nematic system, however, there is no long ranged translational order. As a result, approaches unity in the limit of high , and if , the scattered intensity is due only to the intraparticle interference diffraction and . In this regime the angular distribution of the scattered intensity is a function only of the single particle orientational distribution function. Because of the crystalline internal structure of viruses such as fd and Tobacco Mosaic Virus (TMV), x-ray diffraction produces a complex pattern of intraparticle scatter at high which can be used to measure the single particle orientational distribution function of the viruses Oldenbourg et al. (1988).
At low the scattered intensity is dominated by , and the angular distribution of the interparticle interference scatter is influenced by the angular and spatial correlations between neighboring rods. When intraparticle interference scattering is absent or too weak to interpret, as in thermotropic liquid crystal systems Leadbetter and Norris (1979), or the system of lyotropic vanadium pentoxide () Davidson et al. (1997), x-ray investigations of the nematic orientational distribution rely on measuring the angular distribution from interparticle interference scattering. In this case one does not calculate the single particle orientational distribution function, but instead the coupled fluctuations of neighboring rods; this is predicted to overestimate the value of the nematic order parameter for highly ordered samples Leadbetter and Norris (1979); Davidson et al. (1995).
In this paper we explore the behavior of the nematic phase of fd virus, investigating the concentration and ionic strength dependance of the spatial and orientational ordering. We present measurements of the orientational ordering of the nematic phase in coexistence with the isotropic phase as a function of ionic strength and compare the results with the predictions for semi-flexible rods. Previously, measurements of the orientational distribution function of a nematic phase have been made either from form factor scatter as in work done by Oldenbourg et al on TMV Oldenbourg and Phillips (1986) and work done by Groot et al and Kassapidou et al on persistence lengthed DNA fragments Groot et al. (1994); Kassapidou et al. (1995) or from structure factor scatter as in work done by Davidson et al Davidson et al. (1997). Using fd as our model rod allows us to not only measure the orientational distribution function from intraparticle scattering, but also from interparticle interference scattering. This allows us to experimentally resolve this question of whether or not correlations between angular and spatial order present in interparticle scatter influence the measurement of the order parameter. The saturation birefringence of fd was also measured allowing for measurements of the order parameter to be made using birefringence methods which involve much simpler techniques than x-ray diffraction.
This paper is organized in the following manner. In section II we describe the virus system and the experimental methods. In section III qualitative observations about the diffraction data are made. This is followed by a description of the analysis technique used to extract the orientational distribution function from the diffraction data in section IV. Quantitative measurements of the nematic spatial ordering and orientational ordering are presented in section V. This includes first a brief section describing the measured spatial ordering and then a section presenting the measured orientational ordering of the nematic fd. Section VI summarizes the significant results of this paper.
II Materials and Methods
The physical characteristics of the bacteriophage fd are its length = 880 nm, diameter = 6.6 nm, persistence length = 2200 nm and charge per unit length of around 10 nm at pH 8.2 Fraden (1995). When in solution, fd exhibits isotropic, cholesteric, and smectic phases with increasing concentration Lapointe and Marvin (1973); Wen et al. (1989); Dogic and Fraden (1997, 2000). The fd virus was prepared using standard biological protocols found in Ref. Sambrook et al. (1989) using the JM101 strain of E. coli as the host bacteria. The standard yield is 50 mg of fd per liter of infected bacteria, and virus is typically grown in 10-12 liter batches. The virus was extensively dialyzed against a 20 mM Tris-HCl buffer at pH 8.2 and the ionic strength was adjusted by adding NaCl.
X-ray diffraction was done at the SAXS station on beamline 8-ID at the Advanced Photon Source at Argonne National Lab. The beam flux is photons/s for a m beam with a photon energy of 7.664 KeV (=1.617 Å). The samples were a suspension of monodisperse fd in the cholesteric phase, sealed in mm quartz x-ray capillaries. Cholesteric samples were unwound and aligned in a 2 T permanent magnet (SAM-2 Hummingbird Instruments, Arlington, MA 02474)Oldenbourg and Phillips (1986), forming a single domain nematic phase parallel to the long axis of the capillary and the magnetic field, which we will call . The free energy difference between the cholesteric and nematic phases is negligible, and the theory of the phase behavior of the isotropic to nematic transition can be applied equally well to the isotropic to cholesteric transition observed in fd Tang and Fraden (1995). The magnetic field does not have a significant effect on the ordering of the nematic phase Torbet and Maret (1981); de Gennes and Prost (1993); Tang and Fraden (1993). Samples had to remain in the magnetic field for a minimum of 15 minutes at low concentrations and a maximum of about 8 hours at the highest concentrations. The strength of the magnetic field limited the maximum concentration at which we could unwind the cholesteric phase into a mono-domain nematic to about 100 mg/ml Dogic and Fraden (2000). Alignment of the nematic sample was checked in a polarizing microscope and, using a 3 Berek compensator, its optical retardance was measured. To easily view the solution within the capillaries under the microscope, samples were placed in an index matching water bath while still within the magnet. Birefringence is related to optical retardance by ; is the measured thickness of the nematic sample within the capillaries. The magnet and sample were then mounted in a vacuum chamber such that the sample was in the beam line, and the magnetic field was perpendicular to the incoming beam. To observe the effect of charge on the nematic phase, samples were prepared at different concentrations and ionic strengths. The fd concentration was measured with a UV spectrometer by absorption at 269 nm with an absorption coefficient of 3.84 cm2 mg-1.
When the solutions of fd were exposed to x-rays for extended time, disclination lines that matched the pattern traced by the beam could be seen with a polarizing microscope. Since our samples were exposed for varied times, a series of x-ray diffraction patterns from the samples were collected with increasing x-ray exposure time to quantify sample damage and its effects on the scattering pattern. The polarizing microscope revealed sample changes after s of exposure, but the angular spread of the diffraction peaks was not affected until exposure times increased above 10 s, at which point the angular interference peak scatter broadened significantly. The effect of exposure for 10 s on the calculation of the order parameter was not measurable. Data was collected for the interparticle interference scatter by averaging ten 10 s exposures taken at different m sections. To observe the much less intense intraparticle scatter, the sample was continuously moved through the m beam allowing for a total exposure of 120 s. A single long exposure was used to image intraparticle scatter because it resulted in less noise than multiple short exposures because readout noise on the CCD was higher than the dark current. Readout noise and solvent scatter were subtracted from data images during analysis, but over the q-range which was analyzed this background scatter was very uniform and could be approximated as a constant.
III Observations
The two dimensional scattered intensity of low angle interparticle and high angle intraparticle interference peaks are shown in Fig. 1 for concentrations spanning the range over which fd is nematic at 10 mM ionic strength. The angular spread of both types of scatter broadens with decreasing fd concentration or increasing ionic strength, corresponding to an increase in disorientation of the rods. The low angle peak, in Fig. 1a, is very intense and is a result of interparticle interference. The horizontal position of this peak is inversely proportional to the average interparticle separation, and the radial width of the peak is inversely proportional to the correlation length of the interacting rods. At larger scattering angle, the fd layer lines are visible as shown in Fig. 1b. These intraparticle peaks are much less intense than the interparticle interference peaks and are the result of single particle scatter arising from the helical packing of the virial proteins. The layer lines occur at intervals along the direction proportional to the reciprocal of the axial repeat of the helical protein coat, which is 33ÅMakowski and Caspar (1981). Because of discrepancy in both intensities and scattering angle between the interparticle and intraparticle scatter, we were unable to image both the high and low angle scatter simultaneously.
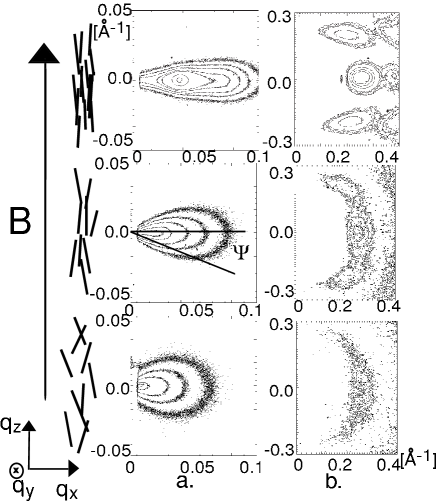
Because of the short ranged positional order in the nematic phase these intraparticle interference peaks should be independent of interparticle correlations. We confirmed this hypothesis by observing that the location of the peaks do not change with concentration as the interparticle peaks do. We also compared our data to published fiber diffraction results for M13Glucksman et al. (1992); mak . M13 is also a filamentous bacteriophage, which only differs from fd by one amino acid per coat protein: their structures are otherwise identical and virtually indistinguishable by x-ray fiber diffraction Bhattacharjee et al. (1992). Upon comparing published fiber diffraction data with our data from nematic fd, we observed that they were similar, but that the fiber diffraction patterns had Bragg peaks due to the hexagonal packing of the virus in the fiber which were absent in our nematic diffraction data. We also noticed that the horizontal location of the single particle peaks in the fiber diffraction was 4% larger than the location of our solution diffraction peaks, indicating that the fiber diffraction was done on virus which had a smaller diameter than those in our nematic samples. The fibers are partially dehydrated, so it is not surprising that they become compressed. The layer line spacing, however, was not altered, indicating that no stretching of the virus occurs in the fibers. From these observations we concluded that the high angle scatter from the nematic fd was independent of interparticle correlations. Detailed analysis of both the interparticle and intraparticle diffraction continues in the following sections.
IV Orientational Analysis Technique
Because of the short ranged positional order of the nematic phase, the high angle scattered intensity should be independent of interparticle correlations . We have demonstrated above that this is true for fd. In this case, the intraparticle scattered intensity of a system of rods is related to the orientation of those rods in the following manner Oldenbourg et al. (1988); Holmes and Leigh (1974):
| (3) |
Where is the solid angle () a rod makes with respect to the nematic director and azimuthally with respect to the incident beam . Because fd is axially symmetric simplifies to ). is the axially symmetric three dimensional form factor of a single rod. is the orientational distribution function (ODF) of the rods. Because the form of the ODF is not known exactly, three test functions were used:
| (4) | |||||
| (5) | |||||
| (6) |
where sets the width of each of the peaked functions, and is the normalization constant such that . Eq. 6 is normalized. The first ODF is the Gaussian used by Odijk Odijk (1986), the second is the function used by Oldenbourg et al. Oldenbourg et al. (1988) in their study of diffraction from nematic TMV, and the third was defined by Onsager. The nematic order parameter,
| (7) |
was determined for the orientational distribution functions which best described the diffraction patterns.
The scatter from intraparticle interference was analyzed by comparing it to a simulated scatter created from the evaluation of Eq. 3 using a three dimensional model for the single rod form factor and a trial ODF. Previously Oldenbourg et. al. measured the ODF from the intraparticle interference scatter of TMV by simplifying Eq. 3 to a one dimensional integral at a constant Oldenbourg et al. (1988). This one dimensional method could not be used for intraparticle fd scatter because fd has a protein coat with a pitch much larger than that of TMV, versus respectively, resulting in layer line overlap at low concentrations. Instead, the radial intensity distribution of single rod was modeled by Holmes and Leigh (1974)
| (8) |
is the scattered intensities along the middle of the zeroth and first layer lines of our most aligned nematic sample, and Gaussian as determined by the interparticle interference peak. The intraparticle interference data that fell on the detector in the range of Å, which encompasses the innermost peak on each of the three layer lines visible in the interference pattern, was fitted to the model diffraction images. For each diffraction pattern, an was found for each trial distribution function which minimized a computed chi-squared value
| (9) |
where and are fitting parameters and sums over the pixels in the scattered image. was calculated once for each scattered image, and was not adjusted when comparing different ODF’s. For more details of the model and analysis of the intraparticle diffraction images, refer to Appendix A.
To measure the orientational distribution function from the interparticle peak, the method of Oldenbourg et al. was used, because the scatter consists of only one peak. In this method, Equation 3 simplifies to a one dimensional integral at constant qr. This method is identical to that frequently used for analyzing thermotropic interparticle scatter, with the exception that Oldenbourg’s method approximates the single rod scattering, , as being proportional to 1/ for small . In this equation, is the angle between the rod and the incident beam. This is in contrast to most analysis done on interparticle interference in the past, in which Leadbetter and Norris (1979); Davidson et al. (1995); Deutsch (1991). The proportionality attempts to include finite size of the rod into the calculation of the ODF. For more details refer to Appendix A.
V Results and Discussion
V.1 Spatial Ordering
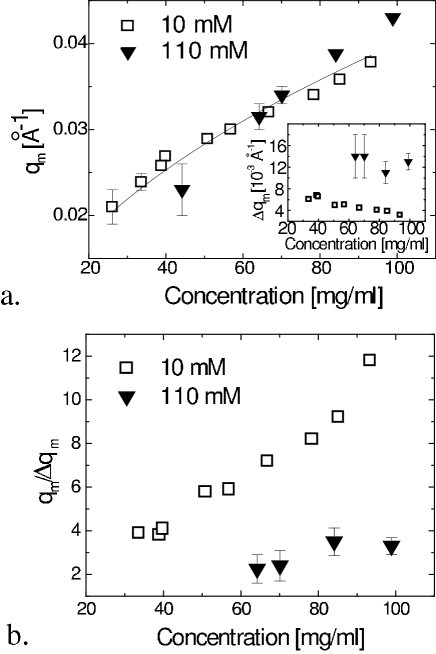
The location of the maximum, , of the first interference peak and its radial width, , were measured along the equator, in order to obtain information about the spatial ordering of the system. Because we are only analyzing data along the equator, these properties can be determined by dividing the equatorial form factor, , from the scattered intensity peaks, , and then by fitting the remaining structure factor peak, , to a gaussian as done in Ref. Sch . and are shown in Fig. 2 for three different samples. The equatorial form factor scatter was approximated by the Fourier transform of the known equatorial projection of the cylindrically averaged electron density of fd Jurnak and McPherson (1984). The electron density was approximated by binning the radial electron density into 10 sections as illustrated in the inset of Fig. 2a. The location of the equatorial peaks produced by the Fourier transform of the electron density agree with the equatorial form factor data obtained at higher angle, but the increase in at high shown in Fig. 2 indicates that this approximation is only qualitatively correct at high and that the presence of background noise in the interparticle diffraction data hides any high form factor information. At high concentrations the scattered intensity is much stronger compared to the readout noise and as a result we are able to analyze the structure factor data to higher than at low concentrations.
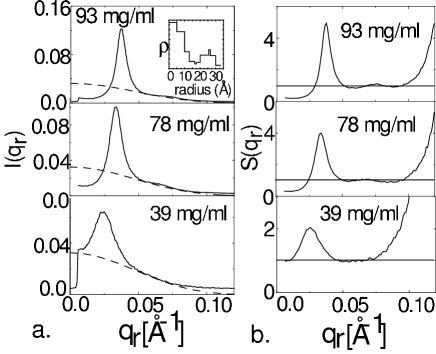
The and measured are plotted as a function of concentration for two different ionic strengths in Fig. 3a. With increasing concentration, the average rod separation decreases as () as expected for any rod system Maier et al. (1992). At a given concentration the rod separation remains constant and the variance increases with decreasing ionic strength. The electrostatic repulsion present between the rods causes the rods to maintain the maximum separation possible, but a smaller effective diameter at low ionic strength allows for more fluctuations. The number of rods per correlation length is plotted as a function of concentration in Fig. 3b. The concentration dependance of is much more significant at 10 mM ionic strength, than at 110 mM, indicating that at high ionic strength the rods are less correlated. It is interesting to note that the second interference peak is much weaker than the first interference peak, indicating a large Debye-Waller factor. This is in contrast to charged 3D spherical and 2D disk systems which show a much stronger second, and even third interference peak Asgari et al. (2001); Rino and Studart (1996). The structure factor of nematic fd also contrasts that of nematic end-to-end aggregated TMV, a very rigid rod, which has a structure factor closely resembling that of the 2D disk systems Sch . One way to interpret the large and sharp first peak in the structure factor of fd is that flexible nematic rods have long range spatial correlations similar to a dense fluid of disks. However the absence of secondary peaks in the structure factor implies that fd particles have a greater degree of positional disorder about their average position than do disks. Perhaps the flexibility of fd accounts for this dramatic difference in spatial organization.
V.2 Orientational Ordering
By examining the values obtained from the inter- and intra-particle scatter analysis, and the residues (Idata-Ifit) from the interparticle scatter analysis we determined that analysis of x-ray diffraction data does not yield a unique orientational distribution function. The Gaussian and the Onsager distribution function each fit the intensity data equally well when comparing residues and values from each of the two functions. However, we were able to eliminate Oldenbourg’s distribution function from the possible ODF forms because it did not accurately model the tails of the diffraction data at low concentration. This insensitivity of x-ray diffraction to the exact form of the ODF was predicted by Hamley who showed that x-ray patterns are insensitive to higher order terms in the spherical harmonic expansion of the orientational distribution function and therefore only an approximation to the full orientational distribution function can be found Hamley (1991).
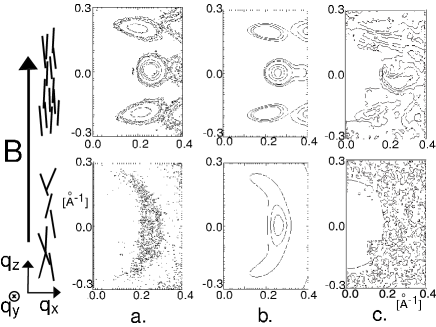
To demonstrate this assertion, the scattered interparticle intensity at a constant radius of = 0.07 0.001 Å-1 is plotted in Fig. 4a with the best-fit model intensities for each of the three ODFs. is the angle from the equator on the detector film. The actual best-fit orientational distribution functions calculated from these interparticle angular scans are shown in Fig. 5. The residues calculated from the interparticle and intraparticle interference results for the three samples are illustrated in Figs. 4b and 6c, respectively. The intraparticle scatter residues shown are for the scattered intensity shown in 6a minus the model images shown in Fig. 6b created with the Gaussian ODF. The intraparticle model scatter produced relatively uniform residues indicating that it was a qualitatively good model. In two dimensions, we were unable to distinguish differences between residue plots of ODFs of the same width, therefore residue analysis was limited to the interparticle scatter.


At high concentration small systematic disagreements between the best-fit models and the data are most visible in the residue plots in Figs. 4b and 6c, but each of the three models and their respective ODFs are nearly indistinguishable. Except at low concentration, the best-fit model intensities obtained from the three distribution functions can not be distinguished from one another both by analyzing residue plots and by comparing minimum values computed from the fitting routine. At low concentration the systematic disagreements between the data and the fits are lost in the noise, but disagreements in fits from different ODFs become visible. The best fit model intensities from the Gaussian and Onsager ODFs are indistinguishable, but the residues from the Oldenbourg ODF show disagreement, and the fits are systematically higher than the background scatter at high angle . At the isotropic-nematic transition the values computed from the Oldenbourg ODF were also consistently higher. The calculated Oldenbourg ODF also looks significantly different from the calculated Gaussian and Onsager ODFs. From these qualitative observations we argue that the distribution function used by Oldenbourg et al. does not describe our diffraction data as well as the Gaussian and the Onsager distribution function at low concentrations. The Gaussian and the Onsager orientational distribution functions fit the diffraction data equally well.
Because of small differences in the trial orientational distribution functions (as illustrated in Fig. 5), best-fit ODFs vary slightly in their width, and subsequently returned slightly different order parameters. But, the order parameters calculated from the best-fit Gaussian and Onsager ODFs were in agreement with one another within the experimental uncertainty of . Order parameters calculated with the Oldenbourg ODF were in common agreement at high concentrations, where model scatter agreed with the data. The nematic order parameter calculated at multiple across interparticle peak also remained relatively constant, . Because we can not distinguish between the Gaussian and the Onsager model scatter, the order parameters to be presented henceforth are an average of the values calculated from only the Gaussian and the Onsager ODF, and the uncertainty on the values given are a combination of experimental error and uncertainty due to variation in order parameters from two trial ODFs.
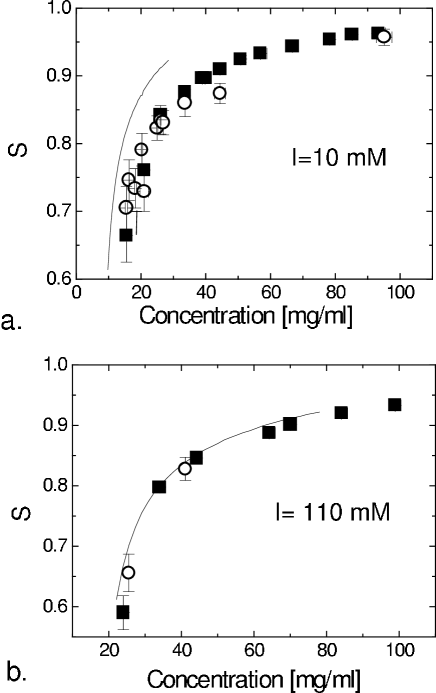
The concentration dependance of the order parameters was measured from both the interparticle and intraparticle peaks and the resulting values are graphed in Fig. 7. In Fig. 8 the order parameter of the nematic phase in coexistence with the isotropic phase is plotted for five different ionic strengths as a function of concentration. The coexistence concentrations are an increasing function of ionic strength. Our analysis shows that the order parameters calculated from the interparticle and intraparticle scatter are consistent with one another both as a function of concentration and of ionic strength, indicating that correlations in the interparticle peak do not visibly change measured nematic order parameters.
Fig. 7a shows data obtained at an ionic strength of 10 mM and Fig. 7b shows data obtained at an ionic strength of 110 mM, pH 8.2. With increasing concentration, the order parameter increases until it saturates near , and at constant concentration, the nematic order parameter decreases with increasing ionic strength. At low concentrations, the scattered intensity is spread over a large area due to the broad orientational distribution function, which leads to a large decrease in the signal to noise ratio. As a result, the variation in the calculated order parameters increases, reaching a maximum of 10%. The theoretical curves shown in Fig. 7 were computed from a scaled-particle theory which includes semi-flexibility in the orientational entropy and electrostatic interactions through an effective diameter. This calculation is outlined in detail in Appendix B. The Onsager ODF was used in calculating these theoretical curves. Our results qualitatively agree with this theory at low ionic strength, and quantitatively agree at high ionic strength.
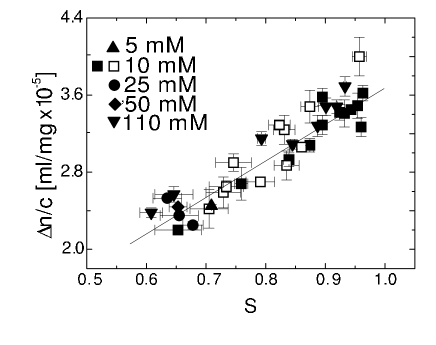
The values for the order parameter calculated from the x-ray diffraction data were also compared to birefringence measurements for the whole range of concentrations and the results are plotted in Fig. 9. Theoretically we expect
| (10) |
where is the sample birefringence and is the birefringence of perfectly aligned fd Maret and Dransfeld (1985). The saturation birefringence per unit concentration was measured as ml/mg using data from samples at five different ionic strengths. Our value for the saturation birefringence is lower than the previously calculated value by Torbet et. al. of ml/mg which was calculated for solutions of fd at 16 mg/ml in 10 mM Tris-HCL buffer at pH 7.5 placed in a 2-4 T magnetic field Torbet and Maret (1981).
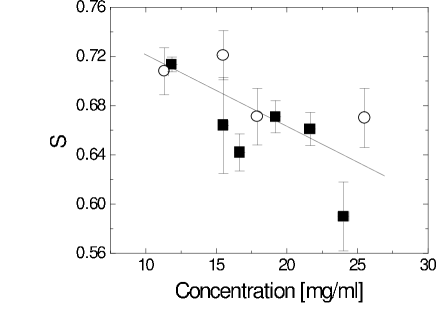
For long rods Onsager predicts that the nematic order parameter at coexistence remains constant independent of ionic strength, but in Figs. 8 and 10, a weak dependance of the order parameter with ionic strength is seen. In Fig. 10, the ionic strength dependance of the nematic order parameter at coexistence is plotted as deduced from both x-ray diffraction and birefringence measurements. The change in ionic strength from 5 mM to 110 mM corresponds to an for the rods changing from to . As the effective aspect ratio for our rods approaches the long rod limit, , the coexistence order parameter decreases, approaching the theoretically predicted value of , as calculated by Chen for long semi-flexible rods with a length to persistence length ratio, Chen (1994). Even though the persistence length of fd virus is more than twice its contour length, and thus can be considered fairly rigid, all of our co-existing samples had a nematic order parameter significantly lower than the Onsager prediction of as measured by both diffraction and birefringence.
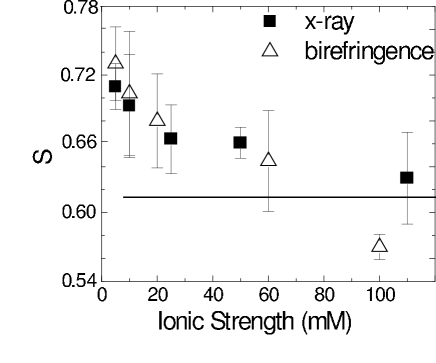
Stroobants et al., have shown that there is an additional electrostatic twisting factor which acts to misalign adjacent particles and may effect the nematic order parameter at coexistence Stroobants et al. (1986b). This effect scales as where is the Debye screening length. The effect of on the coexistence concentrations of the system is predicted to be small Fraden (1995), and the predicted decrease in the nematic order parameter is only 2.4% when increasing ionic strength from 5mM to 110mM, whereas we measure an decrease in the order parameter of 15%. Nevertheless, the observed trend of decreasing order parameter with increasing ionic strength indicates that the electrostatic twisting effect might be influencing the system in addition to the changing effective aspect ratio of the charged virus. It is also important to note that below about 10 mM, the concentration of the virus may begin to have an effect on the ionic strength of the solution in that the concentration of the virus counterions may act to increase the ionic strength. Overall, we expect and observe better agreement with the theoretical predictions for the nematic order parameter at high ionic strength.
VI Conclusion
To summarize, we have observed, as predicted by Hamley, that the method of using x-ray diffraction to calculate the orientational distribution function is insensitive to the details of the form of distribution function used. Nevertheless, we were able to rule out the function used by Oldenbourg et al. because we could qualitatively see that models created using this function did not fit the data at low concentration and at high angle from the equator on the detector. The Onsager and Gaussian trial angular distribution functions fit the angular distribution of both the intraparticle and interparticle diffraction peaks equally well and returned similar values for the nematic order parameter. The concentration dependence of the nematic order parameter at high ionic strength, or large , as determined from both the interparticle and intraparticle scatter agrees with that predicted by a scaled particle theory of charged semi-flexible rods. At low ionic strength, theoretical predictions qualitatively reproduce the concentration dependance of the order parameter. Similar agreement of the concentration dependence of nematic ordering to Onsager’s theory has been measured for the system of persistence lengthed DNA fragments using neutron scattering Groot et al. (1994); Kassapidou et al. (1995). This similarity demonstrates the universality of Onsager’s theory and its applicability to semi-flexible systems.
The nematic order parameters derived from both interparticle and intraparticle scatter return similar results, implying that it is sufficient to use the easier, one dimensional analysis of the interparticle interference peak to calculate nematic order parameters as has been done for many years for thermotropic liquid crystals. It has also been shown that the relationship between the birefringence and the nematic order parameter as calculated by x-ray diffraction is linear. From this relationship the saturation birefringence of fd was calculated. Subsequently, the order parameter can also be obtained simply by measuring the birefringence of a sample of nematic fd and rescaling it by the saturation birefringence. We note that the birefringence measurements were much less repeatable than diffraction measurements, as can be observed by the large error bars throughout the entire range of data shown in Fig. 9.
At high ionic strength, or large effective aspect ratio, we observed that the order parameter of the nematic phase coexisting with the isotropic phase was , close to the theoretically predicted value for semi-flexible rods and significantly lower than the theoretical value of for rigid rods. With decreasing ionic strength however, a weak systematic increase in the nematic coexistence order parameter was found. This is consistent with both an decrease in the twist parameter and a deviation of from the long rod limit. In order to fully understand the interactions which are producing the nematic phase diagrams, particularly at lower ionic strength where is small new theories and simulations need to be developed which include a more complete picture of the complicated electrostatic interactions.
Acknowledgements.
We thank E. Belamie for helping with data collection at the beamline. Work at Brandeis is supported by the NSF(DMR-0088008). Work at Yale was supported by the NSF(DMR-0071755). 8-ID beamline at the Advanced Photon Source is supported by the DOE (DE-FG02-96ER45593) and NSERC. The Advanced Photon Source is supported by the DOE (W-31-109-Eng-38).Appendix A X-ray Diffraction Angular Analysis
If we assume we are at sufficiently high scattering angle where intensity variations due to interparticle interactions are negligible then , and we can measure the orientational distribution function from intraparticle interference by comparing it to a simulated scatter created from the evaluation of Eq. 3. To evaluate Eq. 3 a three dimensional model for the single rod form factor was developed.
A long rod Fourier transforms as a disk of thickness oriented perpendicular to the long axis of the rod. Because of the helical periodic structure along the long axis of fd, the Fourier transform of a single fd consists of a series of disks separated by a distance proportional to the reciprocal of the period Holmes and Blow (1966). This is shown schematically in Fig. 11a. The radial intensity along these disks is a summation of Bessel functions whose exact form depends on the structure of the rod. When projected onto a screen these disks are visible as layer lines. The images shown in Figure 6b show the zeroth and first layer lines. For our model, the radial intensities of the disks were approximated by the scattered intensities along the middle of the zeroth and first layer lines, , of our most aligned nematic sample, times the radius at which that intensity is located and the width, , of the Gaussian ODF,
| (11) |
is the disorientation correction term. For a small amount of disorientation of rods, the radial intensity decreases as . The effect of the disorientation is illustrated in Fig. 11b. This approximation method was developed by Holmes and Leigh, and is valid if the sample from which the is taken was well aligned Holmes and Leigh (1974). The nematic order parameter of our most aligned sample was as measured from the interparticle interference peak.
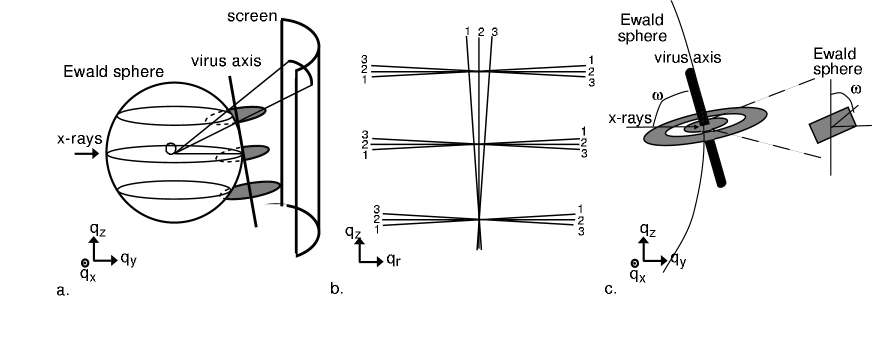
In order to model diffraction from a nematic phase of fd, this single particle scattered intensity is multiplied by a test ODF and integrated over all possible angles of orientation, as in Eq. 3. The intersection of the resulting three dimensional nematic form factor and the Ewald sphere is then “projected” onto a two dimensional “screen” and a final two dimensional image is created, as shown in Fig. 11a. The width of the Ewald sphere was chosen to equal the energy uncertainty of the experimental beam . The “screen” image is then convolved with the Gaussian point spread function of the experimental x-ray beam approximated as exp[ with Å. A series of two dimensional images were made for different orientational distribution functions with different amounts of disorder, examples can be seen in Fig. 6b. All collected data within the range of Åis fitted to these simulated images to find the ODF which minimized a computed chi-squared value shown in Eq. 9. This -range encompassed the innermost peak on each of the three layer lines visible in the intraparticle interference scatter.
To measure the orientational distribution function from the interparticle peak, the method of Oldenbourg et al. was used. Because we measure the angular spread of only one diffraction peak, Eq. 3 simplifies to a one dimensional integral at constant :
| (12) |
where is the angular intensity distribution along an arc drawn at constant radius, is measured from the equator on the detector film, is the angular distribution function of the rods and is the angle between the rod and the incoming beam. , and are related by . Even thought it was originally used for analyzing intraparticle scatter, this equation is identical to that used for analyzing thermotropic interparticle scatter, except that Oldenbourg’s method includes a term which accounts for the length of the rod by defining the single rod scattering as , for small , where is the angle between the rod axis and the x-ray beam as illustrated in Fig. 11c. This proportionality comes from the understanding that the Fourier transform of a rod of finite length is a ring with a finite thickness, and as decreases increases and more of the disk intersects the Ewald sphere and is subsequently projected onto the detector screen.
Analysis done on interparticle interference from thermotropic liquid crystals typically defines Leadbetter and Norris (1979); Davidson et al. (1995); Deutsch (1991). It has been previously shown through calculations that neglecting the angular width when calculating the order parameter from interparticle interference scatter results in inaccurate values for the nematic order parameter for Leadbetter and Norris (1979). But, in our analysis we observed that changing from to one in the interparticle interference scatter analysis did not have a significant effect on the calculated value of the nematic order parameter, nor did the values reveal any information as to which better describes the data. We chose to include the effect of rod length in our interparticle scatter analysis to be consistent with our intraparticle scatter analysis, which requires a knowledge of the rod length.
Appendix B Scaled Particle Theory
To compare the experimental results for the order parameter to the theory, we use the scaled particle expression for free energy of hard rods as was developed by Cotter and coworkers Cotter and Wacker (1978); Cotter (1979). The main advantage of the scaled particle theory is that it takes into account third and all higher virial coefficients in an approximate way and leads to very good agreement with simulation results for the I-N coexistence Kramer and Herzfeld (1998). Therefore this theory should be more adequate at describing data at higher concentrations of rods. We also note that the expression for the free energy (Eq. B) reduces to Onsager’s second virial approximation for very long rods (). The free energy derived by Cotter is :
| (13) |
where is the volume fraction of rods
| (14) |
The coefficients and are given by the following expressions:
| (15) |
| (16) |
and parameter is the overall length over diameter ratio of the spherocylinder given by . The functions is the excluded volume interaction between two rods as derived by Onsager
| (17) |
The expression that accounts for the rotational entropy of the rods and the entropy associated with the loss of configurations due to confinement of the bending modes of the semi-flexible rods in the nematic phase has been derived by extrapolating between the hard rod and the flexible chain limits Hentschke (1990); Odijk (1986); DuPre and Yang (1991). In this paper the expression obtained by Hentschke is used for numerical calculations
| (18) |
After the expression for the free energy is obtained, we use Onsager approximation for the orientational distribution function (Eq. 6) and minimize the scaled particle free energy in Eq. B with respect to the parameter to find the order parameter of the nematic phase at different rod concentrations. To find out the concentrations of rods in the coexisting isotropic and nematic phases we solve the conditions for the equality of the osmotic pressure and chemical potential.
To take into account the fact the rods are charged, instead of using the hard core diameter in our calculations we use an effective diameter Tang and Fraden (1995). Strictly speaking this re-scaling procedure by is valid only for densities at which the system is described by the second virial approximation, therefore our theoretical prediction has an uncontrolled approximation. Despite this fact the agreement between the theory and the experiments is quite satisfactory. It is worth mentioning that there have been recent effort to extend the validity of the scaled particle theory to include repulsive interactions, however this theory was not included in our calculations Kramer and Herzfeld (1999, 2000).
References
- Onsager (1949) L. Onsager, Ann. NY Acad. Sci. 51, 627 (1949).
- Odijk (1986) T. Odijk, Macromolecules 19, 2313 (1986).
- Lasher (1970) G. Lasher, J. Chem. Phys. 53, 4141 (1970).
- Kayser and Raveche (1978) R. F. Kayser, Jr. and H. J. Raveche, Phys. Rev. A 17, 2067 (1978).
- Lekkerkerker et al. (1984) H. N. W. Lekkerkerker, P. Coulon, V. der Haegen, and R. Deblieck, J. Chem. Phys. 80, 3427 (1984).
- Herzfeld et al. (1984) J. Herzfeld, A. E. Berger, and J. W. Wingate, Macromolecules 17, 1718 (1984).
- Lee and Meyer (1986) S. D. Lee and R. B. Meyer, J. Chem. Phys. 84, 3443 (1986).
- Tang and Fraden (1995) J. Tang and S. Fraden, Liquid Crystals 19, 459 (1995).
- Stroobants et al. (1986a) A. Stroobants, H. N. W. Lekkerkerker, and T. Odijk, Macromolecules 19, 2232 (1986a).
- Straley (1973) J. P. Straley, Mol. Cryst. Liq. Cryst. 24, 7 (1973).
- Chen (1994) Z. Y. Chen, Macromolecules (1994).
- Gelbart and Barboy (1980) W. M. Gelbart and B. Barboy, Acc. Chem. Res. 13, 290 (1980).
- Lekkerkerker and Vroege (1993) H. N. W. Lekkerkerker and G. J. Vroege, Phil. Trans. R. Soc. Lond. A 344, 419 (1993).
- Sato and Teramoto (1996) T. Sato and A. Teramoto, Adv. in Poly. Sci. 126, 85 (1996).
- Fraden (1995) S. Fraden, in Observation, Prediction, and Simulation of Phase Transitions in Complex Fluids, edited by M. Baus, L. F. Rull, and J. P. Ryckaert (Kluwer Academic Publishers, 1995), pp. 113–164.
- Forsyth et al. (1978) P. A. Forsyth, S. Marcelja, D. J. Mitchell, and B. W. Ninham, Adv. in Coll. and Int. Sci. 9, 37 (1978).
- Kassapidou et al. (1995) K. Kassapidou, R. K. Heenan, W. Jesse, M. E. Kuil, and J. R. C. van der Maarel, Macromolecules 28, 3230 (1995).
- Davidson et al. (1997) P. Davidson, C. Bourgaux, P. Sergot, and L. Livage, J. Appl. Cryst. 30, 727 (1997).
- Maier et al. (1992) E. E. Maier, R. Krause, M. Deggelmann, M. Hagenbuchle, R. Weber, and S. Fraden, Macromolecules 25, 1125 (1992).
- Oldenbourg et al. (1988) R. Oldenbourg, X. Wen, R. B. Meyer, and D. L. D. Caspar, Phys. Rev. Lett. 61, 1851 (1988).
- Leadbetter and Norris (1979) A. Leadbetter and E. Norris, Mol. Phys. 38, 669 (1979).
- Davidson et al. (1995) P. Davidson, D. Petermann, and A. M. Levelut, J. Phys II 5, 113 (1995).
- Oldenbourg and Phillips (1986) R. Oldenbourg and W. C. Phillips, Rev. Sci. Instrum. pp. 2362–2365 (1986).
- Groot et al. (1994) L. C. A. Groot, M. E. Kuil, J. C. Leyte, and J. R. C. van der Maarel, Liquid Crystals 17, 263 (1994).
- Lapointe and Marvin (1973) J. Lapointe and D. A. Marvin, Mol. Cryst. Liq. Cryst. 19, 269 (1973).
- Wen et al. (1989) X. Wen, R. B. Meyer, and D. L. D. Caspar, Phys. Rev. Lett. 63, 2760 (1989).
- Dogic and Fraden (1997) Z. Dogic and S. Fraden, Phys. Rev. Lett. 78, 2417 (1997).
- Dogic and Fraden (2000) Z. Dogic and S. Fraden, Langmuir 16, 7820 (2000).
- Sambrook et al. (1989) J. Sambrook, E. F. Fritsch, and T. Maniatis, in Molecular Cloning: A Laboratory Manual (Cold Spring Harbor Laboratory Press, 1989), chap. 4, 2nd ed.
- Torbet and Maret (1981) J. Torbet and G. Maret, Biopolymers 20, 2657 (1981).
- de Gennes and Prost (1993) P. G. de Gennes and J. Prost, The Physics of Liquid Crystals (Oxford Science, 1993), 2nd ed.
- Tang and Fraden (1993) J. Tang and S. Fraden, Phys. Rev. Lett. 71, 3509 (1993).
- Makowski and Caspar (1981) L. Makowski and D. L. D. Caspar, J. Mol. Bio. 145, 611 (1981).
- Glucksman et al. (1992) M. J. Glucksman, S. Bhattacharjee, and L. Makowski, J. Mol. Biol. 226, 455 (1992).
- (35) Layer line data from M13 at PH 2 provided by L. Makowski in private communication.
- Bhattacharjee et al. (1992) S. Bhattacharjee, M. J. Glucksman, and L. Makowski, Biophys. J. 61, 725 (1992).
- Holmes and Leigh (1974) K. C. Holmes and J. B. Leigh, Acta Cryst. A 30, 635 (1974).
- Deutsch (1991) M. Deutsch, Phys. Rev. A 44, 8264 (1991).
- (39) D. Schneider and D. L. D. Caspar, 1980. (unpublished).
- Jurnak and McPherson (1984) F. Jurnak and A. McPherson, Biological Macromolecules and Assemblies (Wiley, New York, 1984).
- Asgari et al. (2001) R. Asgari, B. Davoudi, and B. Tanatar, Phys. Rev. E 64 (2001).
- Rino and Studart (1996) J. Rino and N. Studart, Mod. Phys. Lett. B 10, 1507 (1996).
- Hamley (1991) I. W. Hamley, 95, 9376 (1991).
- Maret and Dransfeld (1985) G. Maret and K. Dransfeld, in Strong and Ultrastrong Magnetic Fields and Their Applications, edited by F. Herlach (Springer-Verlag, 1985), chap. 4.
- Stroobants et al. (1986b) A. Stroobants, H. N. W. Lekkerkerker, and D. Frenkel, Phys. Rev. Lett. 57, 1452 (1986b).
- Holmes and Blow (1966) K. C. Holmes and D. M. Blow, The Use of X-ray Diffraction in the Study of Protein and Nucleic Acid Structure (Interscience Publishers, 1966).
- Cotter and Wacker (1978) M. A. Cotter and D. C. Wacker, Phys. Rev. A 18, 2669 (1978).
- Cotter (1979) M. A. Cotter, in The Molecular Physics of Liquid Crystals, edited by G. R. Luckhurst and G. W. Gray (Academic Press, London, 1979), pp. 169–189.
- Kramer and Herzfeld (1998) E. M. Kramer and J. Herzfeld, Phys. Rev. E 58, 5934 (1998).
- Hentschke (1990) R. Hentschke, Macromolecules 23, 1192 (1990).
- DuPre and Yang (1991) D. P. DuPre and S. Yang, J. Chem. Phys. 94, 7466 (1991).
- Kramer and Herzfeld (1999) E. M. Kramer and J. Herzfeld, J. Chem. Phys. 110, 8825 (1999).
- Kramer and Herzfeld (2000) E. M. Kramer and J. Herzfeld, J. Chem. Phys. 61, 6872 (2000).