Neutral-ionic phase transition : a thorough ab-initio
study of TTF-CA
Abstract
The prototype compound for the neutral-ionic phase transition, namely TTF-CA, is theoretically investigated by first-principles density functional theory calculations. The study is based on three neutron diffraction structures collected at 40, 90 and 300 K (Le Cointe et al., Phys. Rev. B 51, 3374 (1995)). By means of a topological analysis of the total charge densities, we provide a very precise picture of intra and inter-chain interactions. Moreover, our calculations reveal that the thermal lattice contraction reduces the indirect band gap of this organic semi-conductor in the neutral phase, and nearly closes it in the vicinity of the transition temperature. A possible mechanism of the neutral-ionic phase transition is discussed. The charge transfer from TTF to CA is also derived by using three different techniques.
pacs:
71.20.-b, 71.30.+h, 71.20.Rv, 64.70.KbI Introduction:
Charge transfer salts presenting mixed stacks with alternating donor (D) and acceptor (A) molecules have been extensively studied over the last 20 years for their original neutral-ionic phase transitions (NIT).Mayerle et al. (1979); Torrance et al. (1981) Very recently, this class of materials has gained renewed interest as it has been demonstrated experimentally that in some cases the conversion from the neutral state (N) to the ionic state (I) or from I to N can also be induced by photo-irradiation.y. Koshihara et al. (1999) Despite intensive theoretical work, the mechanism of the phase transition and photo-conversion has not yet been clarified. In these systems, unlike in other classes of compounds, no dominant interaction has been evidenced and the nature of the NIT must be related to a subtle interplay of different type of interactions.
Depending on the choice of D and A molecules as well as on molecular packing, different type of NIT have been observed mainly under pressure and sometimes also under temperature variation. Continuous and discontinuous NIT have been reported presenting different amplitudes of charge transfer (CT) variations from D to A, often with a dimerization in DA pairs along the stacking axis. The TTF-CA complex made from tetrathiafulvalene (D = TTF) and p-chloranil (A = CA) molecules is considered as the prototype compound for NIT. At atmospheric pressure, it undergoes a first order NIT at a critical temperature of about 80 K. This symmetry breaking phase transition leads to a ferroelectric low temperature phase where the initially planar D and A molecules are both deformed and displaced to form DA pairs along the stacking chains.Le Cointe et al. (1995) According to vibrational spectroscopy Girlando et al. (1983) and CT absorption spectra Jacobsen and Torrance (1983) the CT has been estimated to be about 0.2 e- in the neutral high temperature phase and 0.7 e- in the ionic low temperature phase. TTF-CA is also a typical example showing N-I and I-N conversion under photo-irradiation.y. Koshihara et al. (1999) Recently, ultrafast (ps) optical switching from I to N has been observed by femtosecond reflection spectroscopy.Iwai et al. (2002)
Numerous theoretical approaches have been developed to study the NIT. For many years, the balance between the energy needed to ionize molecules and the gain in the Madelung energy has been at the heart of the concept of NIT.Torrance et al. (1981); Iwai et al. (2002) More advanced models mainly concern extensions of the one-dimensional (1D) modified Hubbard model which includes on-site Coulomb repulsion, transfer integral and on-site energy. Anusooya-Pati et al.Anusooya-Pati et al. (2001) have recently shown that such a model has a continuous NIT between a diamagnetic band insulator and a paramagnetic Mott insulator. Therefore, the ground state at the NIT may be metallic but unconditionally unstable to dimerization. Such a metallic behavior near the N-I borderline has been indeed reported.Saito et al. (2001) Depending on the strength of other interaction such as long range Coulomb interaction, electron-phonon (Peierls) or electron-molecular-vibration (Holstein) couplings, continuous or discontinuous ionicity changes can be generated and the dimerization instability is more or less affected.Anusooya-Pati et al. (2001)
Despite increasing computer power, first-principles calculations are still very rare in the field of molecular crystals. These calculations offer a unique tool for analyzing, at a microscopic level, CT salts without any beforehand assumption concerning the relative strengths of electronic interactions. They have already contributed to evidence the coupling between CT variation and anisotropic three-dimensional (3D) lattice contractions in the presence of hydrogen bonds Oison et al. (2001) and to analyze the quantum intra and inter-chain interactions in the mixed stack CT crystal of TTF-2,5Cl2BQ.Katan and Koenig (1999) This compound has twice as less atoms per unit cell as TTF-CA which makes the computational effort considerably lower, but only few experimental work is available and structural data are limited to the ambient condition phase. From an artificial structure obtained by relaxing all atomic positions within the experimental unit cell, it has been shown that the weak molecular distortion due to symmetry breaking induces a non-negligible contribution to the total CT variation at the NIT.Katan and Koenig (1999)
Starting from first-principles Density Functional Theory (DFT) calculations, we present here a thorough study of TTF-CA. Our main purpose is not to describe the phase transition itself but to reach a precise understanding of the electronic ground states on both sides and far from the transition point. This work gives a new and complementary insight for this family of CT complexes. After a brief section concerning computational details, we present, in Section III, a complete analysis of the valence and conduction bands with the help of a tight-binding model fitted to the ab-initio results. This will lead us to discuss a possible mechanism of the phase transition itself. In Section IV, the 3D total electron density at 300 and 40 K will be analyzed in details using Bader’s topological approach.Bader (1990) Section V will be devoted to the determination of the CT in the high and low temperature phases from our tigh-binding model, from Bader’s approach and from a simple model based on isolated molecules calculations. The last method will only be briefly mentionned as we defer detailed description to a forthcoming publication.
II Computational details
Our ab-initio ground state electronic structure calculations (frozen lattice) are based on the experimental structures obtained by neutron-scattering experiments at 300, 90 and 40 K.Le Cointe et al. (1995) The symmetry is monoclinic with two equivalent chains with alternation of TTF and CA molecules along the stacking axis . This leads to 52 atoms per unit cell. Above 81 K, the space group is and TTF and CA are located on inversion centers. At 300 K : , , Å and and at 90 K : , , Å and . At 40 K, the space group is with , , Å and . TTF and CA are slightly distorded and displaced and form DA pairs in a ferroelectric arrangement in the a direction.
We performed electronic structure calculations within the framework of DFT using the local density approximation (LDA) parametrization by Perdew and Zunger Perdew and Zunger (1981), Becke’s gradient correction to the exchange energy Becke (1992) and Perdew’s gradient correction to the correlation energy.Perdew (1986) The main difficulty in treating the molecular compounds of this family is the presence of non negligible contributions of dynamical electronic interactions of van der Waals type. They are known to be poorly described within traditional DFT approximations, more advanced treatments being far too time consuming for such complex systems. Nevertheless, we believe that the presence of a significant CT between D and A makes our ab-initio results reliable for the determination of the occupied electronic states, especially in the I phase where electrostatic interactions largely dominate.
We used the projector augmented wave (PAW) method Blöchl (1994) which uses augmented plane waves to describe the full wave functions and densities without shape approximation. The core electrons are described within the frozen core approximation. The version of the CP-PAW code used for all our calculations considers only points where the wave functions are real. In order to increase the number of points along , we had to double and treble the unit cell along the direction and our calculations showed that with 3 points along results are well converged as for TTF-2,5Cl2BQ.Katan and Koenig (1999) The band structures calculations have been carried out with a plane wave cutoff of 30 Ry for the wave functions and 120 Ry for the densities, using 8 points: , , , , , , , and in units of .
As the topological analysis requires very accurate electron densities, we have first verified that results do not deteriorate when using only 3 points along instead of 8 and then increased the plane wave cutoff to 50 Ry for the wave functions. The subsequent topological analysis was performed using the new InteGriTy software package Katan et al. (2002) which achieves topological analysis following Bader’s approach Bader (1990) on electron densities given on 3D grids. In order to obtain very accurate results, a grid spacing close to 0.10 a.u has been choosen.
III Ab-initio band structure
Our ab-initio DFT calculations in the crystal provide not only the total electron density but also for each band the energies and wave functions at all points given in section II. The present section is devoted to the sole valence bands (VB) and conduction bands (CB) which are directly related to the strong anisotropy observed experimentally in transport and excitation properties.Tokura et al. (1982); Mitani et al. (1987); Okamoto et al. (1991) The detailed analysis of will be given in section IV.
III.1 Quasi 1D shape of valence and conduction bands
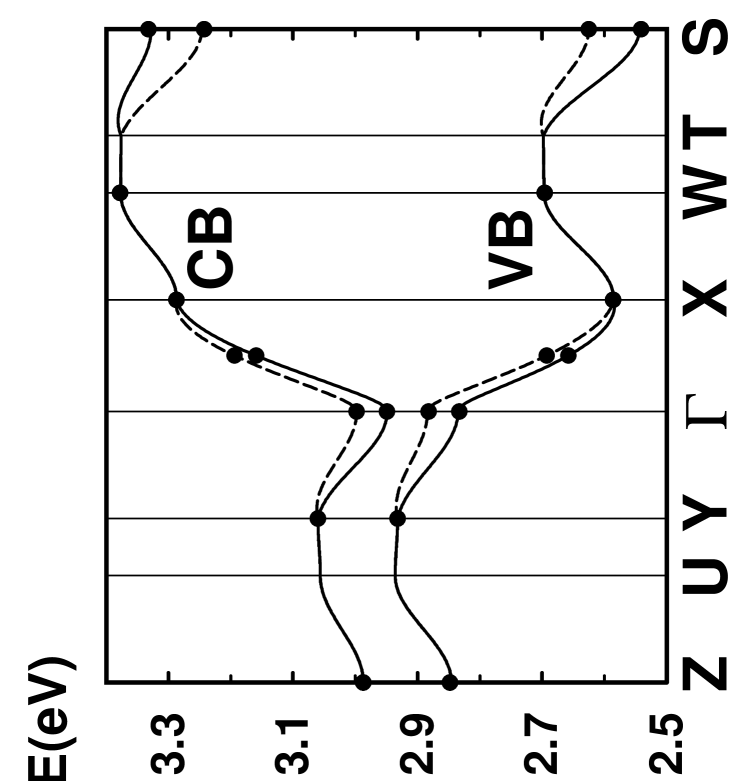
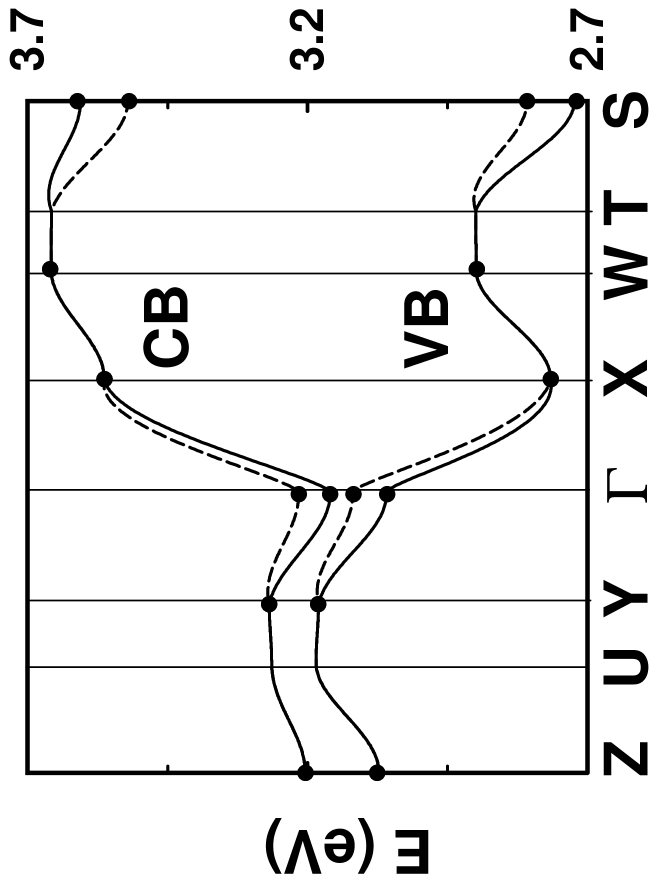
The dispersion curves for the VB and CB are given in Fig. 1 for the experimental structures at 300 K (high temperature phase) and 40 K (low temperature phase). In both cases, they are separated by more than 1 eV from the other occupied and unoccupied bands forming thus a nearly isolated four-band system. The presence of two equivalent chains in the unit cell related by a gliding plane makes the VB and CB twofold, splittings in some particular directions being due to small interactions between the symmetry related chains. The dispersion is maximum along which is the direction of reciprocal space corresponding to the chain axis .Katan et al. (1997)

300 K 40 K
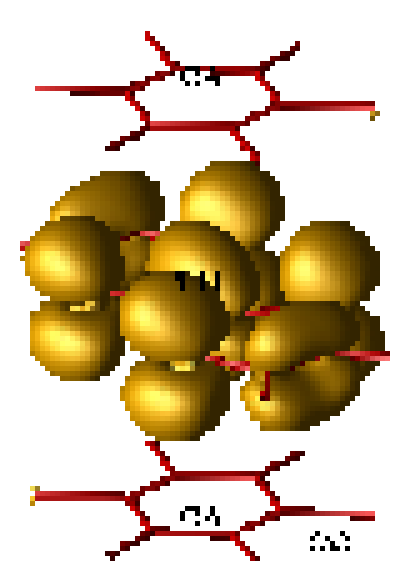
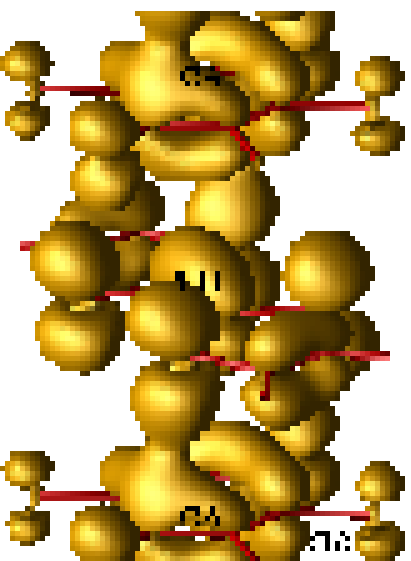
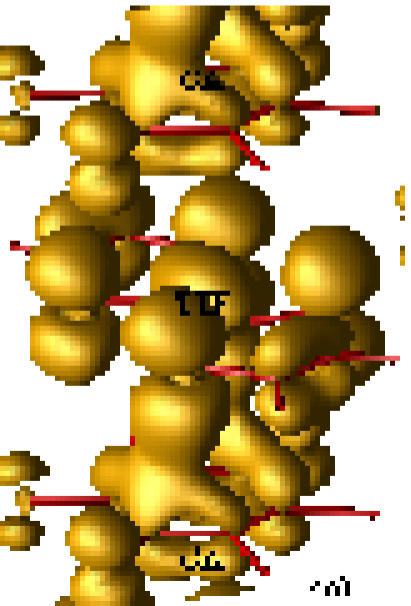
The isodensity representation of the VB states are given in Fig. 2. At 300 K for (Fig. 2a), the density is located on TTF with a shape very close to that of the highest occupied molecular orbital (HOMO) of TTF.Katan (1999) At , (Fig. 2b), hybridization occurs and the density centered on the acceptor molecule is similar to the one of the lowest unoccupied molecular orbital (LUMO) of CA.Katan et al. (1996) The same happens in TTF-2,5Cl2BQ Katan et al. (1997) and is a direct consequence of the presence of an inversion center in the crystal combined to different symmetries of the molecular orbitals which are involved. As the inversion center is lost at 40 K, hybridization is no more symmetry forbidden at and the pairing of TTF and CA is clearly evidenced in Fig. 2c (DA pair on the bottom). On these figures one can identify the regions of wave function overlap responsible for the intra-chain hopping integrals.
at 300 K at 300 K at 40 K
The dispersion is much less important along , nearly vanishing in the third direction and very similar for both structures. As for TTF-2,5Cl2BQ,Katan and Koenig (1999) the band gap is most probably indirect: at 300 K and at 40 K. It is well known that the LDA used in our calculations underestimate the gap of semiconductors; these values are thus lower estimates of the true band gap. However, because of missing data a direct comparison to experiments is impossible. Optical absorption measurements Torrance et al. (1981) showed a first broad peak around 0.7 eV for the N phase which is attributed to the ionization of one DA pair. It may correspond either to band to band transitions or to an exciton peak. The optical spectra of TTF-2,5Cl2BQ Torrance et al. (1981) shows a shift to higher energies which is coherent with a larger calculated band gap for TTF-2,5Cl2BQ: 0.14 eV in the high temperature structure.Katan and Koenig (1999)
III.2 Tight-binding model
As shown in Fig. 2, the ab-initio VB and CB can be interpreted in the frame of a tight-binding model as linear combinations of the HOMO of TTF and the LUMO of CA. One should emphasize that in such a model, hybridizations with lower bands are completely neglected. The interaction with deeper occupied states is nevertheless indirectly taken into account via the values of the parameters, which are fitted to the VB and CB given by an ab-initio calculation of all states. We will follow a similar procedure to the one used for TTF-2,5Cl2BQ,Katan and Koenig (1999) but here the task is more involved as we have to handle four bands instead of two. Let us write and respectively the HOMO of TTF located at position and the LUMO of CA at . The VB Bloch functions are then defined by:
| (1) | |||||
Here is the band index; corresponds to a primitive translation; represents a translation between A and D along the chain axis and a translation between the two symmetry equivalent chains, the molecules from the second chain being denoted by and . The molecular orbitals , , and are calculated using ab-initio simulations for isolated molecules in their experimental crystalline conformations. For each point, the weight ( A or D) is obtained by mean square minimization in the unit cell of the difference between the ab-initio value of calculated in the crystal and the one deduced from expression (1). Fig. 3 displays these weights at the 6 corners of the reduced Brillouin zone used in these calculations for both the high (left) and low (right) temperature phases. In the former, the valence band at the is a pure TTF state for symmetry reasons: . The band gap separates nearly pure D occupied states from nearly pure A empty states in the whole plane, whereas electronic states are of mixed D-A nature in the plane. In the latter, a significant mixing of D-A states takes place in the whole Brillouin zone, for the VB as well as for the CB.


300 K 40 K
The charge transfer from TTF to CA is given by the mean value of the weights of the acceptors in the VB:
| (2) | |||||
Fig. 3 shows clearly that the increase of in the low temperature phase results mainly from additionnal hybridization, which is no longer symmetry forbidden, in the whole plane.
In order to model VB and CB in terms of a tight-binding scheme, we define the on-site energies by and Two families of intermolecular interactions have been defined, the first corresponding to interactions between molecules of the same species shown on Fig. 4 and the second to interaction between TTF and CA shown on Fig. 5 and Fig. 6. Due to the different symmetries of the HOMO of TTF and LUMO of CA, the sign of the hopping integrals between TTF and CA is alternately plus and minus. For example, along the stacking chains one has and . The symmetry breaking in the low temperature phase leads to additionnal terms so that the latter hopping integrals become respectively and whereas , and ( or and or ) become , and respectively.
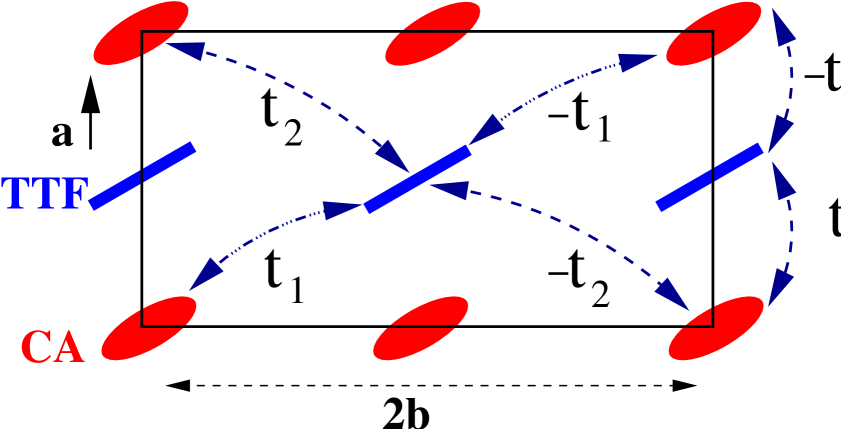
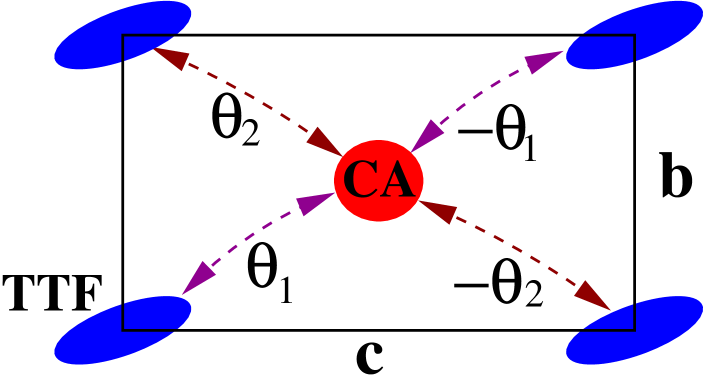
Using the ab-initio energies and the weights at the 6 corners of the reduced Brillouin zone used in these calculations, we determine the parameters given on Table 1 to 3 and the curves plotted in Fig. 1 and Fig. 3. Some parameters like and (Fig. 4) cannot be determined separately because of the small number of points available, but all these contributions are found to be negligible. In Fig. 1 the degeneracy is lifted at due to the small inter-chain interactions (Fig. 4), at due to (Fig. 6) and, in the low temperature phase at due to . The are also responsible for the small HOMO-LUMO hybridization at and (Fig. 3).
The transfer integral along the chain axis (Fig. 5) dominates and its estimate is in agreement with previous ones.Jacobsen and Torrance (1983); Girlando et al. (1993); Tokura et al. (1982); Katan et al. (1997) In the low temperature phase, increases significantly (Table 2) partly due to the lattice contraction and partly to the symmetry breaking.Katan and Koenig (1999) As for TTF-2,5Cl2BQ, the main effect of the latter is expressed by the additional parameter which is as large as a third of (Table 3) and which leads to a large HOMO-LUMO hybridization in the plane. The other additional parameters , and have negligible values.
| 300 K | 40 K | 300 K | 40 K | ||
|---|---|---|---|---|---|
| 2.894 | 3.191 | 3.048 | 3.348 | ||
| 0.002 | 0.001 | 0.017 | 0.024 | ||
| 0.022 | 0.005 | 0.023 | 0.003 | ||
| 0.003 | 0.004 | 0.002 | 0.003 | ||
| 0.002 | 0.003 | 0.004 | 0.004 | ||
| 0.004 | 0.005 | 0.002 | 0.003 |
| 300 K | 40 K | |
|---|---|---|
| 0.167 | 0.206 | |
| 0.003 | 0.005 | |
| 0.016 | 0.012 | |
| 0.005 | 0.010 |
| 0.061 | 0.001 | -0.002 | -0.003 | -0.004 |
III.3 Towards a metallic state?
Our calculations at 300 and 40 K present the electronic structure far from the transition. In order to understand how the band structure is changed by thermal contraction, we performed also a calculation just above the NIT for the crystal structure known at 90 K. The corresponding dispersion curves are given on Fig. 7. They display a closed indirect band gap between and , with nearly pure D occupied states at at a higher energy than nearly pure A empty states at , as our method imposes a fully occupied VB. This is of course unphysical and is due to the DFT-LDA error on the band gap value. It leads however to interesting conclusions: (i) the thermal lattice contraction reduces the indirect band gap in the neutral phase, going toward a metallic state and (ii) as this band gap closes, an electron transfer occurs necessarily from D to A in the vicinity of the transition temperature, leading to an increase of the ionicity of the molecules, even in a frozen lattice.
Within our tight-binding model, the band gap decrease results from (i) the decrease of the difference between the on site energies, (ii) the increase of the interaction between two TTF molecules along () which increases the energy of the valence band at and (iii) the increase of the interaction between the two CA molecules along () which decreases the energy of the CB at (Table 4). The cell contraction increases also resulting in a slight increase of the weights of the acceptors in the VB in the plane from 0.36 to 0.38 and a very small variation of as observed experimentally Jacobsen and Torrance (1983) before the transition. One can notice that in the plane has already reached at 90 K the value that we obtained at 40 K.
Of course, in the actual crystal, the charge transfer is largely facilitated by dynamical effects in the vicinity of the transition temperature, when the gap becomes narrow. Thermal 1D excitations from D to A have already been observed.Lemée-Cailleau et al. (1997) They are precursors of the global changes in the crystal which certainly involve intra and intermolecular vibrations. Calculations on a A-D-A model complex Oison et al. (2001) have recently shown that the CT variation occuring in the VB (along the mixed stack -chains) induces an intra-molecular electronic redistribution, affecting deep molecular states as far as 10 eV below the frontier orbitals. These deep states are also concerned in the hydrogen bonds (along OH-chains resulting from coplanar alternating D and A molecules in the direction) so that their modifications are directly related to the lateral lattice contractions. In the low temperature phase, the gap opens again between mixed D-A states both in the VB and CB, in the whole Brillouin zone. This suggest an electronic mechanism for the NIT where the electronic redistribution associated to the structural phase transition allows the crystal to avoid the metallic state.Anusooya-Pati et al. (2001)
| 300 K | 90 K | |
|---|---|---|
| 0.154 | 0.135 | |
| 0.022 | 0.028 | |
| 0.017 | 0.022 | |
| 0.167 | 0.189 |
IV Intermolecular interactions
The previous section showed that VB and CB are clearly 1D. The aim of the present section is to explore thoroughly the total electron density given by our first-principle calculations. This is essential to elucidate all features, not only the 1D aspects, presented by this NIT.
We could plot isodensity representations of in some selected planes to evidence the most important intermolecular couplings. But, the presence of two chains per unit cell related by a gliding plane makes it an endless task and Bader’s approach Bader (1990) is a clever manner to circumvent this difficulty.
IV.1 Bader’s theory
Within the Quantum Theory of Atoms in Molecules Bader (1990) can be analysed in details by means of its topological properties. The topological features of are characterized by analysing its gradient vector field . Here we will focus on bond critical points (CP) where vanishes. They are characterized by the density at the CP , a positive curvature () parallel and two negative curvatures () perpendicular to the bond path. The ellipticity of a bond, defined as , describes the deviation from cylindrically symmetric bonds. For closed shell interactions, further information is obtained by using Abramov’s Abramov (1997) expression for the kinetic energy density , and, combined with the local form of the Virial theorem Bader (1990), the local contribution to the potential energy density which have already been used to study hydrogen bond strengths.Espinosa et al. (1998) In the present work, will be used to quantify the strength (intensity) of the intermolecular interactions. It allows to quantitatively compare interactions between two or more atoms. This procedure is less speculative than the comparison of interatomic distances to the sum of van der Waals radii Le Cointe et al. (1995), or related criteria Zefirov (1997); Collet et al. (2001), as van der Waals radii are not defined with sufficient accuracy Pauling (1960); Bondi (1964); Baur (1972) and fail to take into account different relative orientations.
IV.2 Intra-chain interactions
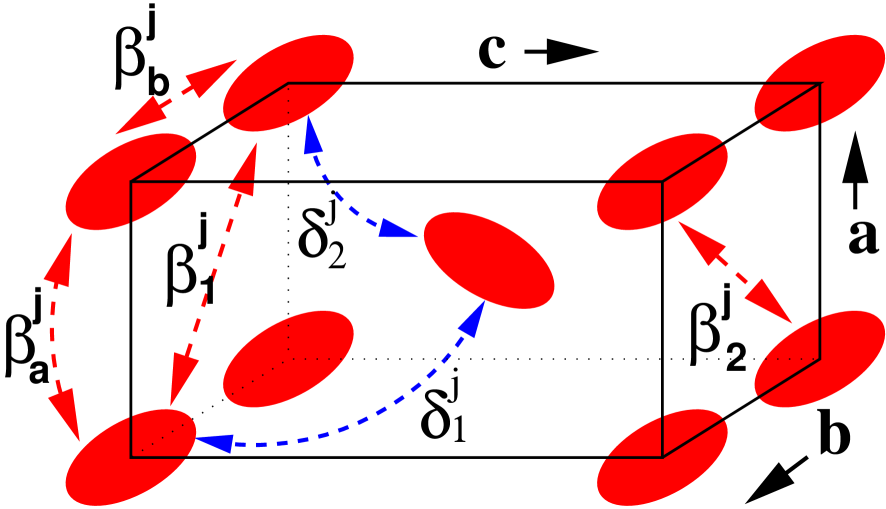
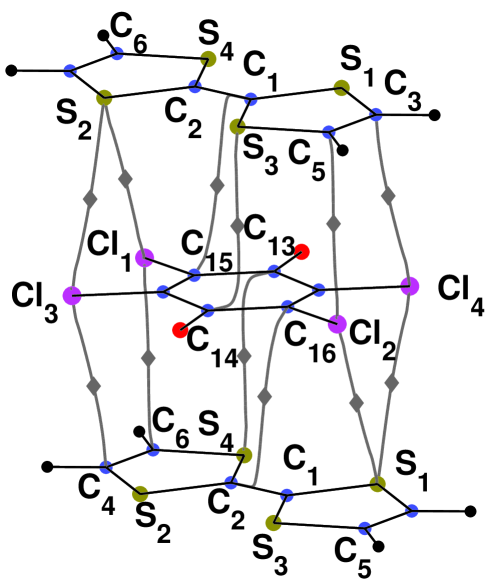
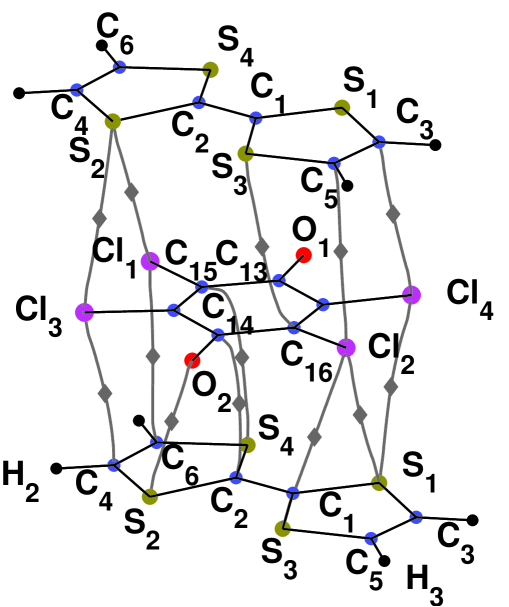
In the high temperature phase (300 K), the strongest contact within the chains is the one connecting to - (Fig. 8 and Table 5). It corresponds to the one already visible in the VB (Fig. 2) and has thus a significant contribution resulting from HOMO-LUMO overlap. It has a quite large ellipticity which is related to the fact that interaction do not occur between two atoms but rather between and the bridge of -. Such a 2D attractor is also found for the interaction - which is 40 less intense than the former and somewhat less than , , and . These four latter atom-atom interactions show that plays an important role for the electronic coupling along the chains. The acceptor in the middle (left) of Fig. 8 is coupled to TTF on bottom (top) by () on the left side and () on the right side.
In the low temperature phase (40 K), the pairing of the molecules in DA pairs is clearly visible on these local contacts (bottom of the figure on the right part of Fig. 8 and Table 5). The - contact remains the dominant one with a 50 increase of its strength. Due to molecular reorientation, the contact - has changed into a more atom-atom like contact between and . Its intensity has more than doubled and with - they dominate all other local contacts. The latter have also increased by about 35 and additionnal strong contacts and have appeared. These contacts confirm Le Cointe et al. (1995) that inside the pair, the CA molecule is essentially connected to the left part of the TTF molecule below. Between the DA pairs (top of the right part of Fig. 8), we observe a small decrease and a more atom-atom like contact for - whereas the and contacts moderately increase, being the strongest one.
300 K 40 K
| 300 K | 40 K intra | 40 K inter | ||||
| - | 7.4 | -9.3 | 5.8 | -16.5 | ||
| - | 7.4 | -9.3 | 4.4 | -7.8 | ||
| 1.3 | -7.0 | 1.6 | -10.6 | |||
| 1.3 | -7.0 | 1.3 | -7.8 | |||
| 1.3 | -6.7 | 1.3 | -8.9 | |||
| 1.3 | -6.7 | 1.2 | -8.7 | |||
| 2.1 | -8.9 | |||||
| 2.2 | -6.0 | 2.5 | -8.1 | |||
| 2.2 | -6.0 | 1.9 | -6.8 | |||
| 2.2 | -8.1 | |||||
| 1.3 | -6.0 | 1.6 | -7.8 | |||
| 1.3 | -6.0 | 1.1 | -7.1 | |||
| - | 6.0 | -5.6 | ||||
| 4.5 | -11.7 | |||||
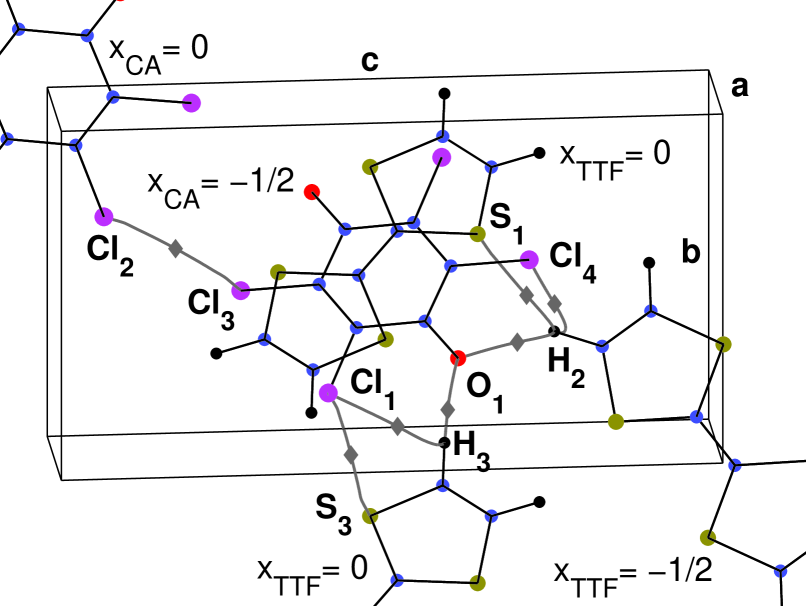
IV.3 Inter-chain interactions
The inter-chain interactions can be split in two groups, the first corresponding to interactions between two chains separated by a primitive translation along and the second to the interactions between two chains related by the gliding plane. In the direction the chains are too far from each other to allow direct atom-atom interactions. In Fig. 9 and Table 6 we have reported the properties of the strongest inter-chain contacts. For all of them except the two contacts, is quite small and the interactions are diatomic. On Fig. 9, it is clear that interacts with the bond. In TTF-CA, the importance of hydrogen bonds has already been underlined. Batail et al. (1981); Le Cointe et al. (1995); Oison et al. (2001) Our results show clearly that they dominate all other intra and inter-chain interactions in both high and low temperature phases. in the OH chains is stronger than as it is shorter and more straight, the CA and TTF molecular planes being aligned in the direction. The other strong interactions reported in Table 6 have comparable ’s to the intra-chain ones given in Table 5 but there are fewer of them in the same energy range.
In the low temperature phase, the loss of inversion symmetry leads to two inequivalent distances for each contact. As already discussed by Le Cointe et al. Le Cointe et al. (1995), some of the distance reductions (Table 6) are larger than those expected from the thermal unit cell contraction which is about 1 along and and 3 along directions. The hydrogen bonds are the most affected and become 80 and 50 stronger for the short and long bonds respectively. All other interactions except the long bond, undergo a smaller strengthening.
| 300 K | 40 K short | 40 K long | ||||
| d | d | d | ||||
| -16.3 | 2.35 | -26.7 | -7 | -24.3 | -5 | |
| -6.8 | 3.57 | -10.3 | -5 | -8.7 | -3 | |
| -6.7 | 3.03 | -10.8 | -6 | -8.0 | -1 | |
| -12.0 | 2.50 | -21.4 | -8 | -18.3 | -6 | |
| -8.8 | 3.53 | -11.6 | -3 | -11.0 | -2 | |
| -7.8 | 2.93 | -10.4 | -4 | -7.1 | +1 | |
| -7.5 | 3.53 | -9.1 | -2 | -8.1 | -1 | |
IV.4 Discussion
Most of the contacts discussed in the Section IV.2 and IV.3 have already been pointed out on the basis of a detailed comparison between interactomic distances and van der Waals radii. Le Cointe et al. (1995) Our results demonstrate that a topological analysis of the total charge density allows to go a step further. It leads to a very precise picture of the atoms involved in the different contacts (bond path) and provides a quantative way to compare their shape () and intensity (). From Table 6 for the inter-chain interactions and Table 5 and Ref. Le Cointe et al., 1995 for the intra-chain ones, we find the following relation between the relative variations of the potential energy density and the length of the bonds :
| (3) |
Thus, the strengthening (diminution) of a given contact defined by is directly correlated to the reduction (augmentation) in distance.
All our results on TTF-CA show that HOMO-LUMO overlap and hydrogen bonds dominate the intermolecular interactions in both high and low temperature structures and drive the molecular deformation and reorientation occuring at the NIT. The other inter-chain contacts do not show any peculiar behavior and are dragged along with the former. In addition, many strong interactions inside and between the chains involve Cl atoms which must largely contribute to stabilize these crystal structures.
V Charge Transfer
CT is a key factor of the NIT but it is is well known that it is not a well defined quantity and there are numerous ways to extract it from experimental or theoretical results. In TTF-CA it has already been estimated from the intensity of the CT absorption band Jacobsen and Torrance (1983), from the dependence on molecular ionicity of either bond lengths Le Cointe et al. (1995) or vibrational frequencies. Girlando et al. (1983) In this section, we will use three different techniques to estimate the CT between TTF and CA. The first two are based on our ab-initio calculations in the crystal while the third is obtained from a model build on isolated molecules calculations.
V.1 From the tight-binding model
Within our tight-binding model, the CT in the VB is obtained by integrating the analytic expression of (Eq. (2)). We have first estimated by using the parameters determined in Section III.2, leaving out all those which are smaller than 0.005 eV in both phases. A second estimate has been obtained by keeping only the parameters related to the dispersion along . In that case, is given by
Both approaches lead to the same values of indicated in Table 7 where the corresponding experimental values have also been reported in the last column. Even though experiments lead to coarse estimates of the CT as its determination is always indirect, our high temperature value seems too large. Two reasons can be put forward to explain this discrepancy: (i) the tight-binding model is based on a linear combination of molecular orbitals of isolated molecules which disregards their deformation due to intermolecular interactions in the crystal and (ii) the underestimate of the dynamical part of the electron-electron interactions due to the LDA approximation. Among other things, the later will affect the band gap which is directly included via in Eq. V.1. In order to get a feeling for the influence of the band gap on , we increased it by 0.5 eV in both phases to locate it approximately near the first absorption peak.Torrance et al. (1981) The corresponding values have also been reported in Table 7. In the high temperature phase, it produces a significant decrease of 0.16 e- whereas it is only of 0.03 e- in the low temperature phase. Thus as well as its variation between 300 and 40 K becomes in much better agreement with the experimental results.
| Tight | Tight | Integration | Isolated | exp.111From Ref. Jacobsen and Torrance,1983 | |
| Binding | Binding | Atomic | molecules | ||
| Basin | Model | ||||
| 300 K | 0.59 | 0.43 | 0.48 | 0.47 | 0.20.1 |
| 40 K | 0.72 | 0.69 | 0.64 | 0.60 | 0.70.1 |
V.2 From Bader’s theory
Within Bader’s approach, a basin can be uniquely associated to each atom. It is defined as the region containing all gradient paths terminating at the atom. The boundaries of this basin are never crossed by any gradient vector trajectory and atomic moments are obtained by integration over the whole basin.Bader (1990); Katan et al. (2002) The CT between TTF and CA is obtained by summing the atomic charges belonging to each molecule. For this purpose very high precision is needed as we are looking for a few tenths of an electron out of a total of 116 valence electrons. The corresponding CT are reported in Table 7. These estimates are no more directly affected by the band gap error due to the LDA as they are based on the sole occupied states. Accordingly, they are both at 300 and 40 K smaller than those obtained by the tight-binding model and thus closer to the experimental results. Nevertheless, in the high temperature phase, the CT seems still somewhat overestimated.
V.3 From a molecular model
We obtained a third estimate of the CT by means of a simple model based on isolated molecules calculations which will only be briefly reported in the present paper. Here, we are looking for the charge transfer which minimizes the total energy in a fixed structure, i.e. either in the high or low temperature structure. The first contribution to the variation of the total energy is the molecular one (Carloni et al. Carloni et al. (1995)):
| (5) |
where the reference state is the one without any CT,
is the energy of the relevant orbital in
the reference state and the Coulomb repulsion of
an electron in that orbital. The second contribution
is the electrostatic one limited to
the Madelung contribution . The atomic charges
and are
deduced from PAW calculations on isolated molecules
by using a model density reproducing the multipole moments of
the true molecular charge density.Blöchl (1995)
The remaining contributions to the total energy are usually accounted
for by a van der Waals term which is constant in a given structure
and which can thus be disregarded.
The CT values given by this simple model are also given in
Table 7.
V.4 Discussion
It is satisfying that all our three estimates are in close agreement
with each other in both low and high temperature phases. At 40 K,
they are also in good agreement with the experimental value.
At 300 K, we observe a systematic overestimate of about 0.2 e-
with respect to the values obtained by Jacobsen et al. Jacobsen and Torrance (1983),
our result being closer to the one deduced from intermolecular
bond lengths (0.4 e-).Le Cointe et al. (1995)
This discrepancy may have different origins. First of all, the CT
is not a uniquely defined quantity as its evaluation relies on different
(and not necessarily equivalent) models based either on theoretical or
on experimental results.
Starting from experimental data, the models can only
be very simple and most of the results published in the literature are
based on the behavior of isolated molecules upon ionization: bond-lengths,
intramolecular vibration frequencies, optical spectra…, neglecting thus all
crystalline effects apart from the charge transfer on these molecular
properties.
On the other hand, our theoretical results are based on the determination of the charge density. They are all affected by the error due to the LDA approximation to the exchange-correlation potential. It is well known that this approximation, even in its gradient-corrected version, underestimates the dynamical part of the electron-electron interactions. In weakly interacting systems where these dynamical effects (or so-called van der Waals interactions) are dominant, this leads to an overestimate of the electron delocalization and an overbinding effect, together with an underestimate of the band-gap. An overestimate of the intermolecular CT is thus expected. However, it has already been shown Oison et al. (2001) that in the ionic phase the multipolar static effects are considerably stronger than in the neutral phase, so that the LDA error on the CT should also be considerably reduced in the low temperature phase.
In our tight-binding model we have clearly evidenced the effect of the underestimate of the band gap. Within Bader’s approach, the CT determination only relies on the occupied states, but leads nevertheless to an overestimate in the neutral phase. Regarding our model based on isolated molecules calculations, it has been shown that the ionization energy of TTF Katan (1999) and the electron affinity of CA Katan et al. (1996) are correctly obtained within the gradient-corrected LDA approximation used in the present study. But our model takes into account neither the atomic multipolar contributions nor the polarization due to the crystal field.
Thus, our three estimates are coherent and lead probably to a correct determination of the CT in the ionic phase, and a too large one in the neutral phase. At this stage however, the discrepancy with the available experimental values has not to be attributed to the sole LDA problem, but also to the definition itself of this CT. A good way to check the rather high value obtained in this work at 300 K is to perform an experimental charge density acquisition by X-ray diffraction and use Bader’s approach to extract an experimental CT value coherent with our theoretical estimate.
VI Conclusion
This is the first extensive ab-initio study of the electronic ground states of TTF-CA, prototype compound of the NIT. We should remind here that temperature is included only via the experimental structures, all calculations being performed in a frozen lattice.
The valence and conduction bands are dominantly of 1D character along the stacking chains and are essentially a linear combination of the HOMO of D and the LUMO of A as in TTF-2,5Cl2BQ.Katan and Koenig (1999) The weak molecular distorsion due to the symmetry breaking part of the NIT is responsible for the main contribution to the charge transfer variation. We found also that the thermal lattice contraction leads to a decrease of the band gap in the neutral phase, going toward a metallic state. This is consistent with the theoretical work of Anusooya-Pati et al. Anusooya-Pati et al. (2001) who found a metallic ground state at the transition which is unstable to dimerization. It has also to be related with the metallic behavior observed by Saito et al. Saito et al. (2001) in an other DA alternating CT complex.
A detailed analysis of all intermolecular bond critical points shows that molecular deformation and reorientation occuring at the NIT are driven by both the HOMO-LUMO overlap and the hydrogen bonds. Quite many intermolecular contacts involving chlorine atoms have also been evidenced. Moreover, we have found a direct relationship between the relative variations of the potential energy density at the critical point and the distance between the atoms involved in the intermolecular bond.
Three estimates of the charge transfer have been obtained from
our tight-binding model, from integration over the atomic basins
defined within Bader’s approach and from a simple model based
on isolated molecules calculations. All three estimates are in
close agreement with each other and give a value of about
0.45 e- at 300 K and 0.65 e- at 40 K. Experimental charge
density collection on TTF-CA is under progress in order to
check the rather high value obtained at 300 K.
All these results provide a possible picture for the mechanism of the NIT. The energy dispersions in VB and CB are mainly along and with an indirect gap between and . Above the transition temperature, the VB has dominant D character at and the CB a pure A character at . When temperature is lowered, the slow decrease of the cell parameters induces a slow variation of all transfer integrals and the band gap progressively vanishes. There is a point where the indirect band gap closes. Pockets of holes at and electrons at appear which activate a new mechanism assisted by intra Katan (1999); Venuti et al. (2001) and intermolecular Moreac et al. (1996); Okimoto et al. (2001) vibrations creating DA pairs (and longer DADA strings) for which the inversion symmetry is locally broken. This picture is consistent with the observed pretransitionnal effects Lemée-Cailleau et al. (1997) described as ionic segments in the neutral phase Okimoto et al. (2001); Nagaosa (1986); y. Koshihara et al. (1999); Luty (1997) sometimes called CT exciton strings.Kuwata-Gonokami et al. (1994) The rapid increase of CT along the chains may then activate the hydrogen bonds via intra-molecular electron-electron interactions between the valence and deep molecular orbitals.Oison et al. (2001) This enables the whole crystal to topple into the ionic state at the transition point and is consistent with the sudden decrease of the cell parameter .Le Cointe et al. (1995) Once the whole crystal has switched the band gap opens and both VB and CB have strong D-A character leading to a macroscopic change of the CT.
Acknowledgements.
This work has benefited from collaborations within (1) the -ESF Research Program and (2) the Training and Mobility of Researchers Program “Electronic Structure” (Contract: FMRX-CT98-0178) of the European Union and (3) the International Joint Research Grant “Development of charge transfert materials with nanostructures” (Contract: 00MB4). Parts of the calculations have been supported by the “Centre Informatique National de l’Enseignement Supérieur” (CINES—France). We would like to thank P.E. Blöchl for his PAW code and A. Girlando for useful discussions.References
- Mayerle et al. (1979) J. J. Mayerle, J. B. Torrance, and J. I. Crowley, Acta Cryst. B 35, 2988 (1979).
- Torrance et al. (1981) J. B. Torrance, J. E. Vasquez, J. J. Mayerle, and V. Y. Lee, Phys. Rev. Lett. 46, 253 (1981).
- y. Koshihara et al. (1999) S. y. Koshihara, Y. Takahashi, H. Sakai, Y. Tokura, and T. Luty, J. Phys. Chem. B 103, 2592 (1999).
- Le Cointe et al. (1995) M. Le Cointe, M. H. Lemée-Cailleau, H. Cailleau, B. Toudic, L. Toupet, G. Heger, F. Moussa, P. Schweiss, K. H. Kraft, and N. Karl, Phys. Rev. B 51, 3374 (1995).
- Girlando et al. (1983) A. Girlando, F. Marzolai, C. Pecile, and J. B. Torrance, J. Chem. Phys. 79, 1075 (1983).
- Jacobsen and Torrance (1983) C. S. Jacobsen and J. B. Torrance, J. Chem. Phys. 78, 112 (1983).
- Iwai et al. (2002) S. Iwai, S. Tanaka, K. Fujinuma, H. Kishida, H. Okamoto, and Y. Tokura, Phys. Rev. Lett. 88, 057402 (2002).
- Anusooya-Pati et al. (2001) Y. Anusooya-Pati, Z. G. Soos, and A. Painelli, Phys. Rev. B 63, 205118 (2001).
- Saito et al. (2001) G. Saito, S.-S. Pac, and O. O. Drozdova, Synth. Met. 120, 667 (2001).
- Oison et al. (2001) V. Oison, C. Katan, and C. Koenig, J. Phys. Chem. A 105, 4300 (2001).
- Katan and Koenig (1999) C. Katan and C. Koenig, J. Phys.: Condens. Matter 11, 4163 (1999).
- Bader (1990) R. F. W. Bader, Atoms in Molecules: A quantum theory, The international Series of Monographs on Chemistry (Oxford University, Clarendon Press, 1990).
- Perdew and Zunger (1981) J. P. Perdew and A. Zunger, Phys. Rev. B 23, 5048 (1981).
- Becke (1992) A. D. Becke, J. Chem. Phys. 96, 2155 (1992).
- Perdew (1986) J. P. Perdew, Phys. Rev. B 33, 8822 (1986).
- Blöchl (1994) P. E. Blöchl, Phys. Rev. B 50, 17953 (1994).
- Katan et al. (2002) C. Katan, P. Rabiller, C. Lecomte, M. Guezo, V. Oison, and M. Souhassou, J. Appl. Cryst. (2002).
- Tokura et al. (1982) Y. Tokura, T. Koda, T. Mitani, and G. Saito, Solid State Comm. 43, 757 (1982).
- Mitani et al. (1987) T. Mitani, Y. Kaneko, S. Tanuma, Y. Tokura, T. Koda, and G. Saito, Phys. Rev. B 35, 427 (1987).
- Okamoto et al. (1991) H. Okamoto, T. Mitani, Y. Tokura, S. Koshihara, T. Komatsu, Y. Iwasa, T. Koda, and G. Saito, Phys. Rev. B 43, 8224 (1991).
- Katan et al. (1997) C. Katan, C. Koenig, and P. E. Blöchl, Solid State Commun. 102, 589 (1997).
- Katan (1999) C. Katan, J. Phys. Chem. A 103, 1407 (1999).
- Katan et al. (1996) C. Katan, P. E. Blöchl, and C. Koenig, Phys. Rev. B 53, 12112 (1996).
- Girlando et al. (1993) A. Girlando, A. Painelli, C. Pecile, G. Calestani, C. Rizzoli, and R. M. Metzger, J. Chem. Phys. 98, 7692 (1993).
- Lemée-Cailleau et al. (1997) M. H. Lemée-Cailleau, M. Le Cointe, H. Cailleau, T. Luty, F. Moussa, J. Roos, D. Brinkmann, B. Toudic, C. Ayache, and N. Karl, Phys. Rev. Lett. 79, 1690 (1997).
- Abramov (1997) Y. A. Abramov, Acta Cryst. A 53, 264 (1997).
- Espinosa et al. (1998) E. Espinosa, E. Molins, and C. Lecomte, Chem. Phys. Lett. 285, 170 (1998).
- Zefirov (1997) Y. V. Zefirov, Cryst. Reports 42, 866 (1997).
- Collet et al. (2001) E. Collet, M. Buron-Le Cointe, M. H. Lemée-Cailleau, H. Cailleau, L. Toupet, M. Meven, S. Mattauch, G. Heger, and N. Karl, Phys. Rev. B 63, 054105 (2001).
- Pauling (1960) L. Pauling, The Nature of Chemical Bond (Cornell University Press, Ithaca, New-York, 1960).
- Bondi (1964) A. Bondi, J. Phys. Chem. 68, 441 (1964).
- Baur (1972) W. H. Baur, Acta Cryst. B 28, 1456 (1972).
- Batail et al. (1981) P. Batail, S. J. LaPlaca, J. J. Mayerle, and J. B. Torrance, J. Am. Chem. Soc 103, 951 (1981).
- Carloni et al. (1995) P. Carloni, P. E. Blöchl, and M. Parrinello, J. Phys. Chem. 99, 1338 (1995).
- Blöchl (1995) P. E. Blöchl, J. Chem. Phys. 103, 7422 (1995).
- Venuti et al. (2001) E. Venuti, R. Della Valle, L. Farina, A. Brillante, C. Vescovi, and A. Girlando, Phys. Chem. Chem. Phys. 3, 4170 (2001).
- Moreac et al. (1996) A. Moreac, A. Girard, Y. Delugeard, and Y. Marqueton, J. Phys.: Condens. Matter 8, 3553 and 3569 (1996).
- Okimoto et al. (2001) Y. Okimoto, S. Horiuchi, E. Saitoh, R. Kumai, and Y. Tokura, Phys. Rev. Lett. 87, 187401 (2001).
- Nagaosa (1986) N. Nagaosa, J. Phys. Soc. Jpn. 55, 2754 (1986).
- Luty (1997) T. Luty, Relaxations of Excited States and Photo-induced Phase Transitions (edited by K. Nasu, Springer-Verlag, Berlin, 1997).
- Kuwata-Gonokami et al. (1994) M. Kuwata-Gonokami, N. Peyghambarian, K. Meissner, B. Fluegel, Y. Sato, K. Ema, R. Shimano, S. Mazumdar, F. Guo, T. Tokihiro, et al., Nature 367, 47 (1994).