Electronic structure of magnetic molecules V15: LDA+U calculations, X-ray emission and photoelectron spectra
Abstract
Electronic structure of V15 magnetic molecules (K6[V15As6O42(H2O)]8H2O) has been studied using LSDA+U band structure calculations, and measurements of X-ray photoelectron (valence band, core levels) and X-ray fluorescence spectra (vanadium K and L2,3, and oxygen K). Experiments confirm that vanadium ions are tetravalent in V15, and their local atomic structure is close to that of CaV3O7. Comparison of experimental data with the results of electronic structure calculations show that the LSDA+U method provides a description of the electronic structure of V15 which agrees well with experiments.
pacs:
75.50.Xx, 75.30.Et, 71.20.-bIntroduction
A new class of magnetic compounds, molecular magnets, have attracted much attention due to their unusual magnetic properties that in general are associated with mesoscopic-scale magnetic particles 1 ; 1a . These materials are the objects of studies for spin relaxation in nanomagnets, quantum tunneling of magnetization, topological quantum phase interference, quantum coherence, etc. 5 ; 6 ; 7 . In this work, we study the polyoxovanadate K6[V15As6O42(H2O)]8H2O molecules (denoted below as V15), which possess an interesting layered structure 11 ; 16 ; v15str1 . This molecule contains fifteen antiferromagnetically coupled vanadium ions, each having spin , see Fig. 1. In contrast with many other molecular ferrimagnets (such as Mn12 or Fe8), V15 is a molecular antiferromagnet with small net uncompensated spin 1/2, and it exhibits weak anisotropy. It presents unusual features, such as “butterfly-like” hysteresis loops bfly , and, as theoretical estimates suggest 2 , might exhibit rather long decoherence time. Previous considerations 11 ; 16 ; v15str1 ; 3 ; 4 advocate that vanadium ions in this compound have valency of 4+. However, experimental studies elucidating the electronic structure of V15 are absent. Such studies are important for theoretical considerations of this complex compound, and firm experimental evidence of the tetravalent nature of vanadium ions in V15 is crucial.
We have addressed these issues by investigating V15 with X-ray photoelectron (XPS) and X-ray emission (XES) spectroscopies. These techniques allow determination of the charge (valence) state of the ions, provide information about the total density of states (DOS) normalized to photoionization cross-sections and the partial DOS of atomic components in the valence band, indicate variations in chemical bonding character, etc. We present the complete XPS and XES study of valence states of the V ions, and the distribution of the total and partial DOS in the valence band of V15. The experimental data obtained are compared with theoretical LSDA and LSDA+U calculations, and we show that the results obtained using LSDA+U technique agree well with experiments.
I Sample preparation and experimental details
The XPS measurements have been carried out with a PHI 5600ci multi-technique spectrometer using monocromatized Al K radiation (E eV). Estimated energy resolution is 0.35 eV, and the base pressure in the vacuum chamber during measurements is about Torr.
The XES V K spectra ( transition) were measured using a fluorescent Johan-type vacuum spectrometer with a position-sensitive detector 9 . Cu K X-ray radiation from the sealed X-ray tube has been used for excitation of the V K XES. A quartz crystal (rhombohedral plane, second-order reflection) curved to m was used as an analyzer. The spectra were measured with an instrumental energy resolution 0.22 eV. The vanadium L2,3 ( transitions) and oxygen K ( transition) XES have been recorded at the Advanced Light Source (Beamline ) employing the soft X-ray fluorescence endstation 10 . The vanadium L2,3 and oxygen K XES have been measured resonantly, through the V L2,3 and O K-edges, and non-resonantly (far from the threshold). The instrumental energy resolution of the V L and O K spectra is about 0.8 and 0.3 eV, respectively. The V and O X-ray absorption spectra have been measured in the total electron yield (TEY) mode.
The total resolution of XES measurements is composed of the instrumental resolution (the values given above), and the width of the core level which depends on the lifetime of the hole. For vanadium K XES, the width of the core level is about 0.79 eV, which gives about 1.0 eV of total energy resolution. For vanadium L emission, the core level width is about 0.8 eV, and for O K XES, the core level width is about 0.2–0.3 eV.
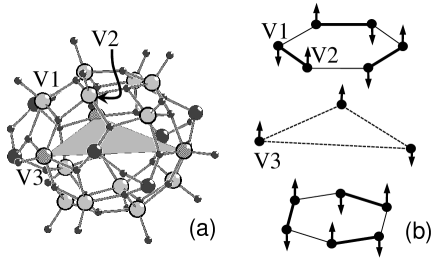
The single crystal of (K6[V15As6O42(H2O)]8H2O) was prepared as desribed in Ref. 11, . It has a trigonal symmetry (space group ), as shown in Fig. 1a. The overall structure consists of three sets of non-equivalent vanadium atoms V1, V2, and V3. V1 and V2 belong to two nonplanar hexagons separated by a triangle of V3 centers forming the “layer structure” (Fig. 1b).
II Discussion of experimental results
The X-ray emission valence spectra originate from the electron transitions between the valence band and the core hole. The wave functions of the core states are strongly localized, and the angular momentum symmetry of the core electrons is well defined. Thus, according to the dipole selection rules, these spectra reflect the site-projected, and symmetry restricted partial densities of states (DOS). However, it is rather difficult to extract information about the occupied V states from non-resonant V L2,3 XES because V L3 () and V L2 () transitions are strongly overlapped due to the small spin-orbital splitting of V states (7.7 eV). To overcome this difficulty, we have used resonant excitation of V L2,3 XES, where the energy of incoming photons was tuned near V -thresholds, and in this way we could selectively excite V L3 XES.
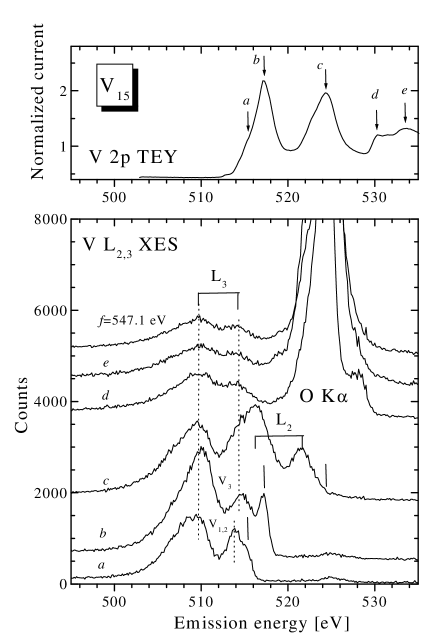
Fig. 2 shows the results of measurements of V L2,3 XES resonantly excited near the V -thresholds. The excitation energies were selected in accordance with the features (–) on V TEY (upper panel of Fig. 2), and indicated by vertical lines on V L-emission spectra (lower panel of Fig. 2). These energies exactly correspond to the energy of the elastic peaks which probe the unoccupied states, and the resulting intensities follow the absorption cross section. As one can see, the selectively excited V L3 XES (curves and , Fig. 2) reveal two peaks at 510.0 eV, and at 513.8–514.4 eV, which reproduce the structure of the undistorted distribution of V states in the valence band, and can be related to O and V bands, respectively 13 . The V -like peaks have different emission energies (513.8 and 514.4 eV), which can be attributed to the contributions of non-equivalent vanadium atoms in the crystal structure of K6[V15As6O42(H2O)]8H2O (Fig. 1). The ratio of V and O (V )-like peaks is higher for the curve than for the curve , which allows us to associate the peak at 513.8 eV with the contributions of V1 and V2 atoms from hexagons (we denote this contribution as 1-2), and the peak at 514.4 eV — with the contribution of V3 atoms (we denote this contribution as 3). At higher excitation energies, the peaks at 513.8–514.4 eV are strongly overlapped with the main peak of V L2 XES (curves –, Fig. 2), which makes it very difficult to establish their location and width.
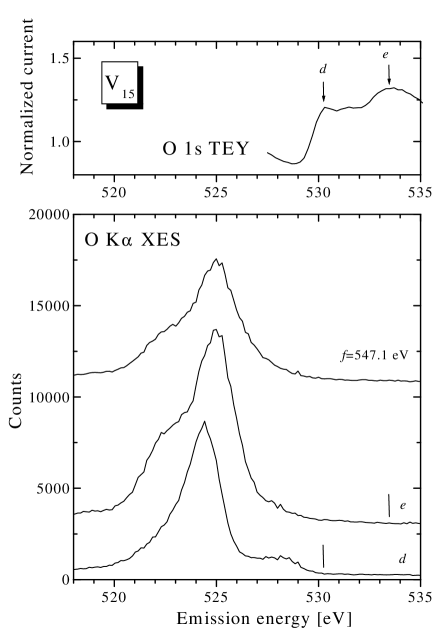
The resonantly excited O K XES of V15 (Fig. 3) reveal significant changes in the fine structure, depending on excitation energy. These changes can be explained by contributions of different oxygens belonging to the polyoxovanadate part and the water of hydration in the V15 structure, which are selectively excited by tuning the energy of incoming photons. Using the X-ray fluorescence measurements of liquid water 12 , we can attribute the feature of O TEY (upper panel, Fig. 3) and corresponding O K XES (curve , lower panel, Fig. 3) to the oxygens belonging to the water of hydration. We believe that the curve of O K XES (lower panel, Fig. 3) corresponds to the contribution of oxygen atoms from the polyoxovanadate part of V15.
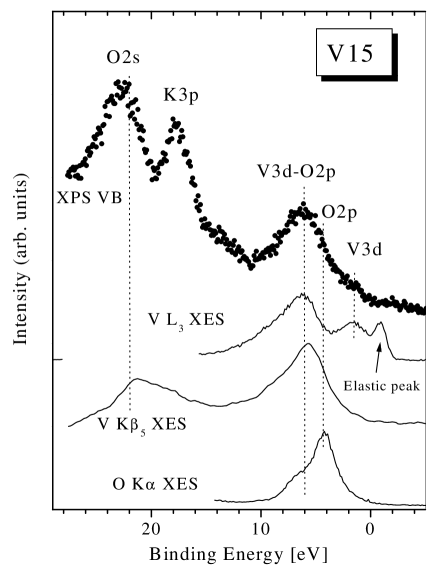
In Fig. 4, we compare the XPS VB and X-ray emission spectra for V K, V L3, and O K XES. To convert the X-ray emission spectra to the binding energy scale, we have used XPS binding energies of core levels (V 2, O ), emission energy of V K ( transition), V L3 ( transition) and O K ( transition) measured for V15. Such a comparison provides a direct interpretation of XPS VB (which probes total DOS), because the XES of the constituents probe partial DOS’s due to the dipolar selection rule. As one can see, at the bottom of the valence band, the O ( eV) and K states ( eV) are located, as revealed in the XPS VB. V K XES also consist of an energy band (K) around 21 eV, because of the hybridization between V and O states. Such hybridization is typical for all vanadium oxides 13 . According to Fig. 4, in the middle of the valence band V (V ) and O states are concentrated, and strong mixing is present. Our spectra demonstrate that at the top of the valence band, the V states prevail.
To analyze the oxidation state of V ions and their local atomic structure, we have compared V L3 and V K XES of V15 with the corresponding spectra of the reference samples VO2 (where V ions have valency 4+), V2O5 (where V ions have valency 5+) and CaV3O7 (where V ions have valency 4+) (Figs. 5a,b). Fig. 5 shows that V K and V L3 XES of V15 are closer to those of VO2 than to V2O5, which suggests that vanadium ions are tetravalent in V15. We need to point out that the relative intensity of elastic peak with respect to the main peak of the L spectrum of V15 is much higher than that of VO2 (Fig. 5a), although the vanadium ion has the same oxidation state (4+) in both compounds. The elastic peak corresponds to the transitions from vacant -states occupied by a photoelectron in the intermediate state of the absorption-emission process. We can assume that its high intensity indicates that the -electrons in V15 are more localized as a result of larger V–V distances. Indeed, the average V–V distance in VO2 is about 2.62 Å, whereas in V15 the distance V1–V2 is 2.86 Åand 3.063 Å16 . The V3–V3 distances (6.926 Å) in V15 are even larger.
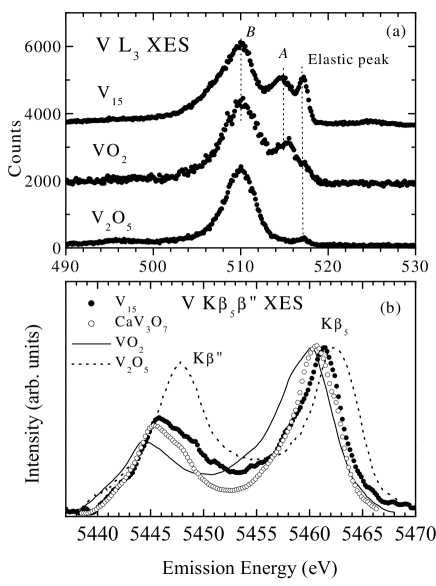
It is known that the spectral parameters of V K XES (the energy position, the K intensity ratio) are very sensitive not only to the oxidation state of V ions in compounds, but also to their nearest neighbors 13 . Therefore, we have chosen CaV3O7 (V4+ oxidation state) and V2O5 (V5+ oxidation state) as the reference samples: in these compounds, as well as in V15, vanadium atoms are situated inside a distorted pyramid made by five oxygen atoms 14 ; 15 . Comparison of the V K spectra of V15, VO2, V2O5, and CaV3O7 (Fig. 5b) shows that the energy position, the K intensity ratio, and the spectrum shape of V15 are practically identical to the spectrum of CaV3O7, but significantly differ from the V2O5 spectrum. This gives experimental confirmation that vanadium ions in V15 have the oxidation state (4+) and the configuration of neighboring atoms is similar to that of CaV3O7.
III Discussion of the results of electronic structure calculations
To obtain deeper understanding of the electronic structure of V15, and to compare the experimental data with theoretical predictions, we have performed a series of LSDA+U calculations ldau . This method is known to provide a good theoretical description for most metal-oxide crystalline systems MnO ; MnO1 , since in most metal-oxide crystals the account of the on-site Coulomb repulsion (characterized by the value of the parameter ) is crucial for correct description of their properties. Moreover, this method has been successfully applied mn12ldau for the molecular magnet Mn12, and account of the on-site Coulomb repulsion yields the correct value for the gap in the electronic spectrum. Therefore, we expect that the LSDA+U approach should also be successful in describing the electronic structure of V15. As shown below, this is indeed the case. Details of application of the LSDA+U technique to electronic structure calculations of molecular magnets are described in Ref. mn12ldau, .
To make the calculations feasible and reasonably precise, we have followed standard practice mn12ldau ; ellis , excluding from consideration the molecules of water of hydration, but retaining completely the polyoxovanadate part of the V15 molecule. The positions of constituent ions have been obtained from the X-ray data. The calculations presented below have been made for eV and for eV. The calculations for other values of , from 3.8 eV to 5.4 eV, do not significantly change the DOS, but the distance between the bands increases with .
We note that our calculations with (which coincide with the ASA-LMTO LSDA approach) do not give correct results, exhibiting qualitatively erroneous non-zero DOS at the Fermi level. As reported in Refs. 4, ; 4a, , the use of LSDA approach with Gaussian basis and GGA functional, along with theoretical optimization of the structure of V15 molecule, gives a gap between the occupied and non-occupied states, with zero DOS at the Fermi energy. As can be concluded from Ref. 4a, , this approach does not agree with some details present in XES spectra, e.g. the O and V bands are separated by larger interval than obtained experimentally, and than given by our LSDA+U calculations with eV. The situation is not yet clear, further work is needed to clarify the details of the electronic structure of V15, therefore we do not discuss this issue further here.
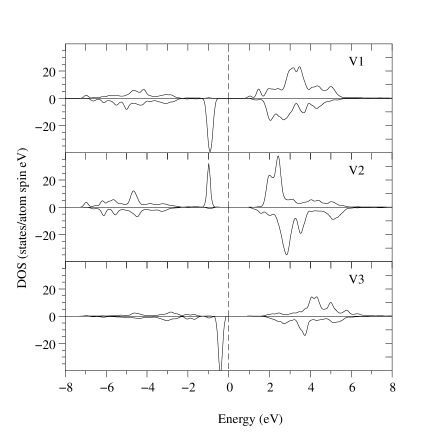
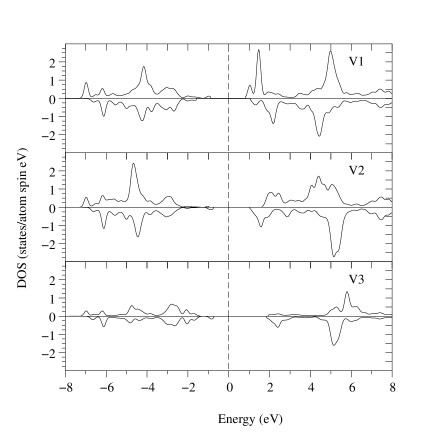
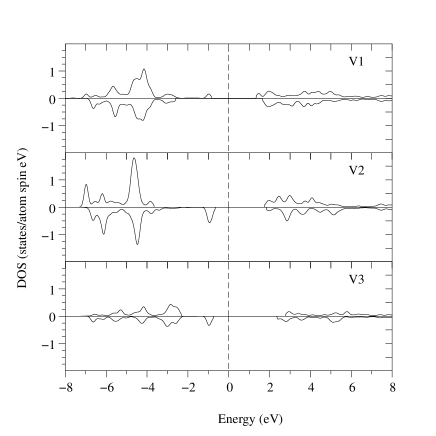
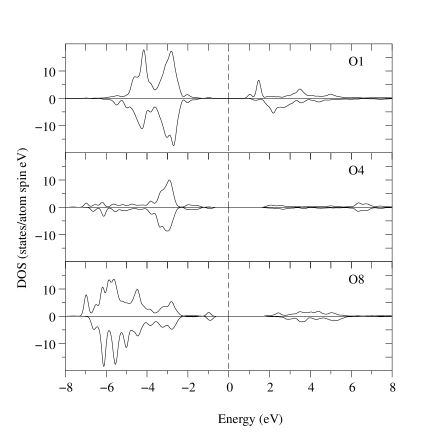
The calculated DOS of , , and electrons of inequivalent V1, V2, and V3 ions are presented in Figs. 6,7,8, and the DOS of oxygen ions belonging to the polyoxovanadate part of the V15 molecule are shown in Fig. 9. The total DOS of electrons in the V15 molecule is presented in Fig. 10. Until now, detailed quantitative experimental information on the electronic structure of V15 has been lacking, but the results of our calculations agree with available qualitative experimental facts. E.g., a finite gap ( eV) in the total DOS is correctly reproduced by the LSDA+U calculations. In this work, using the results of XES and XPS investigations described above, we can make quantitative comparison between theory and experiment.
The electrons of the vanadium ions determine the magnetic behavior of V15. Previous magnetic measurements 11 ; 16 ; v15str1 , and the results of XES/XPS studies presented above, confirm that V ions are tetravalent, with the total spin 1/2 per ion. Moreover, the measurements of dc spin susceptibility and EPR data suggest that the intra-molecular exchange interactions between V1 and V2 (belonging to the upper and lower hexagons) are strong, while the exchange with V3 ions is much smaller.
These facts agree well with our theoretical results. The calculated DOS of all vanadium ions (see Fig. 6) demonstrate two pronounced features: the sharp peaks located at about eV from the Fermi level for V1 and V2 (for V3, about eV), and the broad bands extended between eV and eV. The sharp peaks correspond to localized V -electrons responsible for formation of well-defined local spin of vanadium ions. Our calculations, indeed, give the values of magnetic moments very close to 1, namely:
| (1) | |||||
The broad bands in the spectrum of V electrons clearly demonstrate the signatures of hybridization between the V and states, on one hand, and the O states, on the other. The broad structure of O DOS is reproduced in V1 and V2 and DOS, and, somewhat weaker, in V3 and DOS. This is in agreement with the fact that magnetic superexchange interactions between V1 and V2 (located in upper and lower hexagons) are very strong ( K, according to Ref. 16, ), and involve strong hybridization between V and O orbitals, while the interactions of V3 (located in the central triangle) are much weaker, implying weaker hybridization. Similar hybridization signatures between V orbitals and O orbitals (see Figs. 8,9) correspond to chemical bonding of V with surrounding oxygens.
The calculated DOS are in agreement with the results of XES measurements. The two features of vanadium DOS’s, the sharp peaks and the broad bands, correspond to the two wide peaks, at about eV and eV clearly seen in the vanadium L3 XES spectrum in Figs. 2,4. In agreement with experimental data, the sharp “magnetic” peak in V3 is closer to the Fermi level, than the “magnetic” peaks of V1 and V2 (Fig. 2,6). The difference between the peak widths and intensities in the calculated DOS and in the measured XES spectra can be attributed to the difference in matrix elements corresponding to different V states. It is known that such a difference can be very large nemoshk , and it can lead to significant differences between the “bare” peak widths/heights in the DOS and the widths/intensities of corresponding peaks as observed in XES spectra. Therefore, following the common practice, we have restricted our discussion to the peak positions, rather than widths and heights. Furthermore, the structure of calculated V states DOS is in good agreement with the XES spectra, Figs. 7,4. The broad band extending between eV and eV is revealed in the V K XES spectra as a wide peak located in the same energy interval. Similarly, the calculated DOS for O states (a broad band from eV to eV) exhibits itself as a broad feature in the O K XES spectra in the same energy range, see Figs. 3,4.

The X-ray emission is a selective tool which probes only the states allowed by dipolar selection rules, but XPS probes the total density of states. The calculated total DOS (Fig. 10) exhibits a number of peaks and dips. But the XPS spectra, apparently, lacks sufficient energy resolution to see this fine structure, since the resolution of XPS measurements on dielectric crystals, such as V15, is considerably reduced due to the charging effect. Therefore, the total DOS in the energy range of interest (between the Fermi level and eV) is seen as a single hump of the shape similar to the smeared total DOS as obtained from LSDA+U calculations. This is in qualitative correspondence with the fact that the “magnetic” peaks in the V states constitute only a small fraction of the total states in V15. Along with the insufficient resolution, other reasons might reduce the intensity of “magnetic” peak, e.g. contamination of the surface (XPS, in contrast with XES, is surface-sensitive, and the peak seen in the bulk XES spectra, can be suppressed if the surface is spoiled), or the final state effects.
IV Summary
In this work, we have performed an extensive experimental and theoretical investigation of the electronic structure of V15 magnetic molecules. Using XPS and XES spectroscopies, we have confirmed that vanadium ions are tetravalent, and their local atomic structure is close to that of CaV3O7. We have managed to separate, identify, and study in detail the contributions from inequivalent vanadium ions V1,2 (belonging to the upper and lower hexagons), and V3 (located in the triangle sandwiched between the hexagons) to the XES spectra. For theoretical studies, we have employed the LSDA+U approach with eV, which results in agreement with the experimental data.
We found good agreement between the experimental data and the results of calculations. Our calculations also confirm the oxidation state of vanadium ions in V15. The main features of the calculated DOS correspond to the peaks seen in XES and XPS spectra for V and O ions. High intensity of the elastic peak of V L3 XES indicates the existence of localized states of V1, which are due to the peculiar crystal structure of V15, where the V–V distances are much larger than the V–X ones. The calculated magnetic moments of V1, V2, and V3 are very close to 1, i.e. to the moment of a free V4+ ion, in contrast with other compounds of tetravalent vanadium.
Acknowledgements.
Funding by the Russian Foundation for Basic Research (Projects 00-15-96575 and 02-02-16674), NATO Collaborative Linkage Grant (PST.CLG.978044), and the Natural Sciences and Engineering Research Council of Canada (NSERC) is gratefully acknowledged. The work is partially supported by the Netherlands Organization for Scientific Research, NWO project 047-008-16. This work was partially carried out at the Ames Laboratory, which is operated for the U. S. Department of Energy by Iowa State University under Contract No. W-7405-82 and was supported by the Director of the Office of Science, Office of Basic Energy Research of the U. S. Department of Energy.References
- (1) O. Kahn, Molecular Magnetism (VCH, New York, 1993)
- (2) D. Gattesehi, A. Caneschi, L. Pardi, and R. Sessoli, Science, 265, 1054 (1994)
- (3) Quantum Tunnelling of Magnetization, (Eds. L. Gunther and B. Barbara), NATO ASI Ser. E, Vol.301 (Kluwer, Dordrecht, 1995)
- (4) J. R. Friedman, M. P. Sarachik, J. Tejada, and R. Ziolo, Phys. Rev. Lett. 76, 3830 (1996)
- (5) L. Thomas, F. Lionti, R. Ballou, D. Gattesehi, R. Sessoli, and B. Barbara, Nature, 383, 145 (1996)
- (6) A. Müller and J. Döring, J. Angew. Chem. Int. Ed. Engl. 27, 1721 (1988)
- (7) D. Gatteschi, L. Pardi, A.L. Barra, A. Müller, and J. Döring, Nature 354, 465 (1991).
- (8) A.-L. Barra, D. Gatteschi, L. Pardi, A. Müller, and J. Döring, J. Am. Chem. Soc. 114, 8509 (1992)
- (9) I. Chiorescu, W. Wernsdorfer, A. Müller, H. Bögge, and B. Barbara, Phys. Rev. Lett. 84, 3454 (2000)
- (10) V. V. Dobrovitski, M. I. Katsnelson, and B. N. Harmon, Phys. Rev. Lett. 84, 3458 (2000)
- (11) C. Raghu, I. Rudra, D. Sen, and S. Ramasesha, Phys. Rev. B 64, 064419 (2001)
- (12) J. Kortus, C. S. Hellberg, and M. R. Pederson, Phys. Rev. Lett. 86, 3400 (2001)
- (13) V. E. Dolgih, V. M. Cherkashenko, E. Z. Kurmaev, D. A. Goganov, E. K. Ovchinnikov, and Yu. M. Yarmoshenko, Nucl. Instrum. Methods. Phys. Res. A 224, 117 (1984)
- (14) J. J. Jia, T. A. Callcott, J. Yurkas, A. W. Ellis, F. J. Himpsel , M. G. Samant, J. Stöhr, D. L. Ederer, J. A. Carlisle, E. A. Hudson, L. J. Terminello, D. K. Shuh, and R. C. C. Perera, Rev. Sci. Instrum. 66, 1394 (1995)
- (15) A. Augustsson, J.-H. Guo and J. Nordgren, MAX-lab Activity Report, p. 152, 2000, Lund, Sweden
- (16) E.Z. Kurmaev, V. M. Cherkashenko, and L.D. Finkestein, X-ray emission spectra of solids (Moscow, Nauka, 1988)
- (17) H. G. Bachman, F. R. Ahmed and W. H. Barnes, Z. Krist. 115, 110 (1961)
- (18) J.-C. Bouloux and J. Galy, Acta Cryst. B 29, 269 (1973)
- (19) V. I. Anisimov, F. Aryasetiawan, and A. I. Lichtenstein, J. Phys.: Condens. Matter 9, 767 (1997)
- (20) I. V. Solovyev and K. Terakura, Phys. Rev. B 58, 15496 (1998)
- (21) I. A. Nekrasov, M. A. Korotin, and V. I. Anisimov, cond-mat/0009107
- (22) D. W. Boukhvalov, A. I. Lichtenstein, V. V. Dobrovitski, M. I. Katsnelson, B. N. Harmon, V. V. Mazurenko, and V. I. Anisimov, Phys. Rev. B 65, 184435 (2002)
- (23) Z. Zeng, D. Guenzburger, and D. E. Ellis, Phys. Rev. B 59, 6927 (1999)
- (24) J. Kortus, M. R. Pederson, C. S. Hellberg, and S. N. Khanna, Eur. Phys. J. D 16, 177 (2001).
- (25) V. V. Nemoshkalenko and V. G. Aleshin, Electron spectroscopy of crystals (New York, Plenum Press, 1979).