Phonon-mediated anisotropic superconductivity in the Y and Lu nickel borocarbides
Abstract
We present scanning tunneling spectroscopy and microscopy measurements at low temperatures in the borocarbide materials RNi2B2C (R=Y, Lu). The characteristic strong coupling structure due to the pairing interaction is unambiguously resolved in the superconducting density of states. It is located at the superconducting gap plus the energy corresponding to a phonon mode identified in previous neutron scattering experiments. These measurements also show that this mode is coupled to the electrons through a highly anisotropic electron-phonon interaction originated by a nesting feature of the Fermi surface. Our experiments, from which we can extract a large electron-phonon coupling parameter (between 0.5 and 0.8), demonstrate that this anisotropic electron-phonon coupling has an essential contribution to the pairing interaction. The tunneling spectra show an anisotropic s-wave superconducting gap function.
pacs:
74.70.Dd, 74.62.Dh, 74.20.MnIn most known superconductors the formation of Cooper pairs is based on an attractive interaction mediated by phonons. However, Cooper pairing driven by other bosonic excitations has also attracted much attention due to its fundamental interest. Some of the proposed mechanisms have been used to interpret the superconducting behavior of different compounds discovered during the last decades. But clear microscopic information is very much needed in this field. The situation is especially puzzling in the borocarbide materials (RNi2B2C, R=Y, Lu, Tm, Er, Ho, Dy), where recent experiments have shown that the question about the pairing interaction, initially thought to be conventional electron-phonon couplingMattheiss94 ; Yanson97 ; Cheon99 , is far from being understood. These compounds show moderate critical temperatures (between 6K and 16.5KCava ; Canfieldgeneral ) and very interesting phase diagrams where superconductivity coexists with antiferromagnetic order (when R is a magnetic rare earth, R=Tm, Er, Ho, Dy). The behaviors observed in the thermal conductivityBoaknin01 ; Izawa02 , photoemission spectroscopyYokoya00 , specific heatIzawa01 ; Nohara00 , microwave surface impedanceIzawa01 ; Jacobs and Raman-scatteringSangYang experiments of the non-magnetic Y and Lu borocarbides (which also present the highest critical temperatures of 15.5 K and 16.5 K respectively) show that the superconducting gap is highly anisotropic. Indirectly, this could be related to an also anisotropic pairing interaction, but no experiment has given an indication of its nature.
On the other hand, Fermi surface nesting seems to be a general feature of the whole family of borocarbide materials. It produces Kohn anomalies and has directly been observed using angular correlation of electron-positron annihilation radiation in YNi2B2C and LuNi2B2CBullock98 ; Zarestky99 ; Dugdale99 . Moreover, the antiferromagnetic ordering found in the borocarbides with a magnetic rare earth has a wavevector very close to the nesting vector Q Lynn ; Rhee (in R=Er, Ho and Dy; in Tm it appears in a magnetic field phase). Nesting is generally considered to play against the formation of a phonon mediated superconducting state, as evidenced in other families of superconductors (e.g. in the dichalchogenidesNalseiro ; CastroNeto ). Here we present measurements of tunneling spectroscopy of the non-magnetic YNi2B2C and LuNi2B2C, which show that the highly anisotropic electron-phonon interaction produced by Fermi surface nesting drives the system to an also anisotropic superconducting state. We give new insight into the nature of the pairing mechanism, the order parameter symmetry and the gap anisotropy.
Tunneling spectroscopy is in principle one of the most powerful experimental tools to investigate the anisotropy of the superconducting gap and to obtain information about the pairing mechanismParks . We use the same scanning tunneling microscopy and spectroscopy (STM/STS) set-up as in ref.Suderow01 , where we studied the magnetic TmNi2B2C, with an improved resolution allowing now measurements down to 0.5K. We have also characterized other materials with the same set-up (AlSuderow02a , Pb and NbSe2) and demonstrated that this is indeed the actual temperature of tip and sample and that we do not need any additional pair breaking parameter Yokoya00 to explain our data. Previous works about the spectroscopy of borocarbides had a lower resolution in energyYokoya00 ; Ekino ; Wilde ; Sakata . The sample is broken in air on the sample holder of the STM and cooled down immediately. The resulting surface presents the same topology as for the Tm borocarbide, which consists of inclined planes and bumps, typical of a conchoidal fracture, presenting no clear crystallographic orientationSuderow01 . So it is crucial to characterize the superconducting behavior in well-differentiated regions of the sample. We use a home made x-y table that gives the possibility to change in-situ the scanning window (of 11m2) in an area of 22mm2. We measured three different samples (in three different cool-downs) of each compound. In the case of LuNi2B2C, all of them were freshly broken pieces of the same single crystal grown by a flux technique described in ref.Canfieldgeneral . The YNi2B2C samples came from two different single crystals, one grown by the same flux technique and the other in an image furnace. The tunneling conditions were always very good, with high valued measured work functions of several eV.
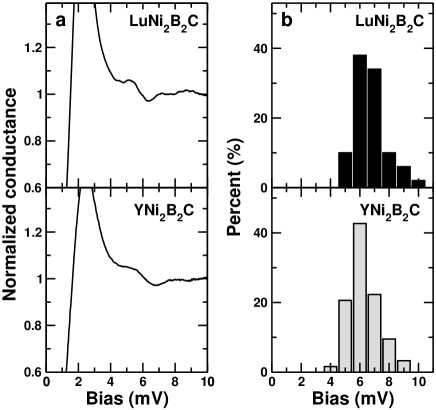
The tunneling differential conductance, =dI/dV, between a normal metal and a superconductor gives a direct (temperature smeared) measurement of the superconducting density of states. Therefore, data show the eventual presence of very low energy excitations within the superconducting gap, , and a high quasiparticle peak at voltages close to the gap. But if the measurement is sufficiently precise, one can also try to resolve tiny features at voltages corresponding to the sum of and the characteristic energy of the bosonic excitations leading to superconductivity, in order to obtain information about the nature of these excitationsParks ; Carbotte90 ; Suderow02b . We could indeed observe these features in the tunneling conductance spectra for the Y and Lu borocarbides. In Fig.1 we show a typical curve together with a histogram where the number of times that such features are observed is presented as a function of the bias voltage (their voltage position is determined from the maximum of the derivative of the conductance above the gapParks ; Carbotte90 ; Suderow02b ). Most of them appear centered at a voltage between 6 and 7mV. Substracting the values of , as estimated below, the maxima become centered between 4 and 5 mV. This is precisely the energy at which a high peak develops in neutron scattering experiments due to a low energy phonon modeBullock98 ; Zarestky99 . An estimation of the electron phonon coupling constant from our data gives rather high values between 0.5 and 0.8 in both compoundsnote . On the other hand, previous estimations using thermodynamic measurements, which take into account the Eliashberg function at all relevant phonon frequencies, but which do not directly specify the nature or spectral weight of each mode, have given values of between 0.75 and 1.2Manalo ; Michor . The fact that we find values of smaller but very close to the ones estimated with thermodynamic measurements means that the structures in the Eliashberg function associated with higher energy phonon modes El-Hagary ; Shulga are more spread-out in energy than the peak corresponding to the 4mV phonon mode and fall below our experimental resolution. It also means that the low energy phonon mode measured here is essential in the formation of superconducting correlations.
The most striking point however is that the phononic density of states at these energies results from a mode having a wavevector comparable to the nesting vector Q (0.5,0,0) Rhee ; Dugdale99 . Neutron scattering experiments show indeed pronounced Kohn anomaliesBullock98 ; Zarestky99 , where the nesting feature of the Fermi surfaceRhee ; Dugdale99 leads to a significant softening, when decreasing temperature, of the low-lying transverse phonon branches at wavevectors close to (0.5,0,0). This behavior results in a strong and highly anisotropic electron-phonon coupling. Our experiment demonstrates for the first time that this anisotropic electron-phonon interaction, produced by Fermi surface nesting, leads to superconducting correlations, having an important contribution to the total electron-phonon coupling constant . Correspondingly, we can expect the superconducting gap to be also highly anisotropic.
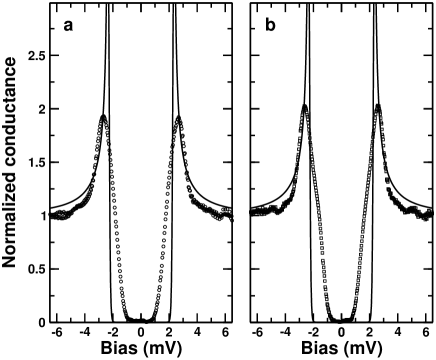
Tunneling conductance measurements done with a STM give the superconducting density of states averaged over part (but not all) of the Fermi surface, depending on the relative position of the tip onto the sampleChen . In most cases we measure tunneling conductance curves as the ones shown in Fig.2, where the conductance is zero below 0.8mV and then increases up to a peak located at 2.6mV in Lu and 2.3mV in Y. These curves cannot be fitted by conventional BCS theory. The discrepancy with most simple BCS theory is not due to a lifetime smeared BCS density of states, which leads to a non zero density of states at low energies, not observed in our data. The situation is clearly very different from the one found in the very similar borocarbide material TmNi2B2C Suderow01 , where the spectra can be fitted by BCS theory. The form of the curves in Fig.2 shows that the electrons contributing to the tunneling current at this precise location come from parts of the Fermi surface with a continuous distribution of values of the superconducting gapHess90 ; Hayashi . This reveals that the gap function must be anisotropic. Moreover, the spectra in (Y,Lu)Ni2B2C remain with the same shape over regions much larger than the coherence length (usually dimensions about 200200nm2 or bigger whereas 7nm Izawa01 ), maintaining their overall form when we increase the temperature, and becoming completely flat at the bulk critical temperature. Similar observations have been made in the anisotropic superconductor NbSe2 Hess90 ; Hayashi , where the spectra have, qualitatively, the same form.
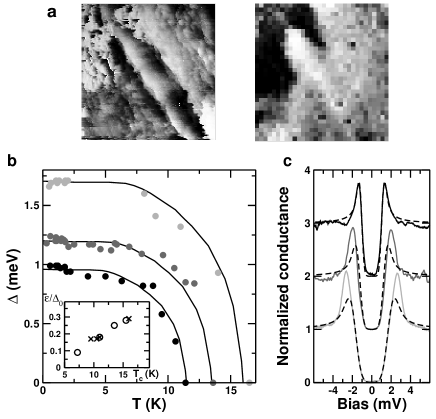
On the other hand, although the behavior shown in Fig.2 appears most frequently on the surface, we can also find different topographical regions of similar sizes with very different spectra, as shown in Fig.3a. In Fig.3b we compare the temperature dependence of , as estimated from the voltage position of the maximum of d/dV, and in Fig.3c the corresponding tunneling density of states at 0.5K in three different locations of YNi2B2C (the same is observed in LuNi2B2C). Clearly, the differences in the spectra are associated with smaller values of the superconducting gap and also a reduced critical temperature. Remarkably, the mean value of the superconducting gaps shown in Fig.3b follows well the temperature dependence predicted by simple BCS theory (lines). What is more, the curves corresponding to a smaller critical temperature in Fig.3c (top curve) approach much better an isotropic BCS s-wave behavior than those corresponding to the bulk Tc (bottom curve). This must be related to changes in the anisotropy as a function of the local Tc. To obtain more quantitative information about this effect we have fitted the experiment to a modified BCS s-wave density of states assuming that the dispersion in the values of the superconducting gap can be modelled by a gaussian distribution centered around with a width of (a similar approach has been previously used in the anisotropic superconductor NbSe2Hayashi ). The dashed lines in Fig.3c give the best fit to this model. The agreement with the experiment is much better in regions with a smaller Tc, where decreases. The inset in Fig.3b represents the dependence of the estimated anisotropy, , as a function of the measured critical temperature in several topographical regions of the same samples. Note that these values do not give an indication of the whole distribution of values of the superconducting gap, as a given STM spectrum is a local measurement which probes only part of the Fermi surfaceChen . Therefore, our data are in good agreement to previous macroscopic measurements Nohara00 ; Izawa01 ; Boaknin01 ; Izawa02 ; Jacobs ; Yokoya00 ; SangYang ; Cheon ; Gammel .
Anisotropic superconductivity is expected to be very sensitive to even non-magnetic defects that reduce Tc and decrease the anisotropyCarbotte81 ; Golubov97 . Therefore, in an anisotropic superconductor, local measurements in topographically different positions on the surface can in principle show different forms of the superconducting gap and values of the local critical temperature, associated with the presence of defects lying near the surface or with an irregular topographyBascones02 . Isotropic superconductors, by contrast, present BCS spectra and the bulk critical temperature over the whole surfaceSuderow01 ; Suderow02a ; Pan .
In (Y,Lu)Ni2B2C we observe a gradual decrease of the local critical temperature down to about half its bulk value and of the anisotropy (inset of Fig.3b) in different locations which also show a different topography (Fig.3a). Our measurements show a direct correlation between the local depression of Tc with a local change of the form of the gap. This also demonstrates that the superconducting gap must be highly anisotropic, and it provides an additional test of the nature of the order parameter in these materials. If the anisotropy is due to a d-wave order parameter, the defects tend to suppress superconductivity altogether and low energy excitations appear, filling the density of states below the gap. If, however, the superconducting wave function is anisotropic s-wave, the defects tend to suppress the anisotropy, leading to a more isotropic gap and a decreased critical temperatureHirschfeld ; Norman . The curves plotted in Fig.3c, with no low energy excitations, definitely imply that superconductivity in YNi2B2C and LuNi2B2C is highly anisotropic but s-wave.
Using the same experimental protocol, we find a completely different behavior in the chemically very similar magnetic TmNi2B2C compound (Tc=11K), where BCS s-wave like spectra without a significant anisotropy (and bulk critical temperature) are measured over the whole surfaceSuderow01 . However, we can state that the surface is analogous in all three compounds, because the measured work function and the topographical images are similar. This could be interpreted as an indication that mechanisms inducing anisotropy in YNi2B2C and LuNi2B2C are not operating in this borocarbide, or that the intrinsic magnetic disorder already smears out homogeneously the anisotropy.
In conclusion, we have studied the tunneling spectroscopy in the non-magnetic borocarbides using high resolution STM/STS. We have been able to characterize important microscopic aspects of the superconducting state, which is an anisotropic s-wave state, where a significant part of the electron-phonon coupling leading to superconducting correlations is also highly anisotropic and due to soft phonons. The demonstration of this new mechanism strengthens the hope for further discoveries in the area of new high-Tc superconducting materials.
We acknowledge discussions with F. Guinea, A. I. Buzdin, J. Flouquet, A. Levanyuk and support from the ESF programme VORTEX, from the MCyT (Spain; grant MAT-2001-1281-C02-0), from FERLIN and from the Comunidad Autónoma de Madrid (Spain). The Laboratorio de Bajas Temperaturas is associated to the ICMM of the CSIC. Ames Laboratory is operated for the U. S. Department of Energy by Iowa State University under Contract No. W-7405-Eng-82. This work was supported by the Director for Energy Research, Office of Basic Energy Sciences.
References
- (1) L.F. Mattheiss, Phys. Rev. B, 49, 13279 (1994).
- (2) I.K. Yanson et al., Phys. Rev. Lett. 78, 935 (1997).
- (3) K. O. Cheon, I. R. Fisher and P. C. Canfield, Physica C 312(1-2), 35 (1999).
- (4) R. J. Cava et al., Nature 367, 146 (1994); R. Nagarajan et al., Phys. Rev. Lett. 72, 274 (1994).
- (5) P. C. Canfield, P. L. Gammel and D. J. Bishop, Phys. Today 51, 40 (1998).
- (6) E. Boaknin et al., Phys. Rev. Lett. 87, 237001, (2001).
- (7) K. Izawa et al., Phys. Rev. Lett. 89, 137006, (2002).
- (8) T. Yokoya et al., Phys. Rev. Lett. 85, 4952 (2000).
- (9) K. Izawa et al., Phys. Rev. Lett. 86, 1327 (2001).
- (10) M. Nohara, H. Suzuki, N. Mangkorntong and H. Takagi, Physica C 341-348, 2177 (2000).
- (11) T. Jacobs et al., Phys. Rev. B 52, R7022 (1995).
- (12) In-Sang Yang et al., Phys. Rev. B 62, 1291 (2000).
- (13) M. Bullock et al., Phys. Rev. B 57, 7916 (1998).
- (14) J. Zarestky et al., Phys. Rev. B 60, 11932 (1999).
- (15) S. B. Dugdale et al., Phys. Rev. Lett. 83, 4824 (1999).
- (16) J. W. Lynn et al., Phys. Rev. B 55, 6584 (1997).
- (17) J. Y. Rhee, X. Wang and B. N. Harmon, Phys. Rev. B 51, 15585 (1995).
- (18) C. A. Balseiro and L. M. Falicov, Phys. Rev. B 20, 4457 (1979).
- (19) A. H. Castro Neto, Phys. Rev. Lett. 86, 4382 (2001).
- (20) W. L. McMillan and J. M. Rowell in Superconductivity, edited by R.D. Parks (Marcel Dekker Inc., New York, 1969).
- (21) H. Suderow et al., Phys. Rev. B 64, R020503 (2001).
- (22) H. Suderow et al., Physica C 369, 106 (2002).
- (23) T. Ekino et al., Phys. Rev. B 53, 5640 (1996).
- (24) Y. De Wilde et al., Phys. Rev. Lett. 78, 4273 (1997).
- (25) H. Sakata et al., Phys. Rev. Lett. 84, 1583 (2000).
- (26) J. P. Carbotte, Rev. Mod. Phys. 62, 1027 (1990).
- (27) H. Suderow et al., Phys. Rev. B 65, R100519 (2002).
- (28) . is obtained following Phys. Rev. B 50, 7177 (1994). This leads to the same result as the conventional inversion procedure of Phys. Rev. Lett. 14, 108 (1965).
- (29) S. Manalo et al., Phys. Rev. B 63, 104508 (2001).
- (30) H. Michor et al., Phys. Rev. B 52, 16165 (1995).
- (31) M. El-Hagary, H. Michor and G. Hilscher, Phys. Rev. B 61, 11695 (2000).
- (32) S. V. Shulga et al., Phys. Rev. Lett. 80, 1730 (1998).
- (33) C. J. Chen, Introduction to Scanning Tunneling Microscopy, Oxford University Press (1993).
- (34) H. F. Hess, R. B. Robinson, and J. V. Waszczak Phys. Rev. Lett. 64, 2711-2714 (1990)
- (35) N. Hayashi, M. Ichioka and K. Machida, Phys. Rev. B 56, 9052 (1997).
- (36) J. M. Daams and J. P. Carbotte, J. Low Temp. Phys. 43, 263 (1981).
- (37) A. A. Golubov and I. I. Mazin, Phys. Rev. B 55, 15146-15152 (1997)
- (38) E. Bascones and F. Guinea, Phys. Rev. B 64, 214508 (2001) and private communication.
- (39) S. H. Pan, E. W. Hudson and J. C. Davis, Appl. Phys. Lett. 73, 2992 (1998).
- (40) L. S. Borkowski and P. J. Hirschfeld, Phys. Rev. B 49, 15404 (1994).
- (41) R. Fehrenbacher and M. R. Norman, Phys. Rev. B 50, 3495 (1994).
- (42) K. O. Cheon et al., Phys. Rev. B 58, 6463 (1998).
- (43) P. L. Gammel et al., Phys. Rev. Lett. 82, 4082 (1999).