Raman Scattering versus Infrared Conductivity: Evidence for 1D Conduction in La2-xSrxCuO4
Abstract
Raman and Infrared (IR) spectra of an underdoped La1.90Sr0.10CuO4 single crystal have been measured as a function of temperature. Both techniques provide unconventional low-energy spectra. The IR conductivity exhibits features peaked at finite frequencies which do not have a counterpart in the Raman response. Below approximately 100 K a transfer of both Raman and IR spectral weight towards lower energies is found and a new component in the Raman response builds up being characterized by a very long lifetime of electrons propagating along the Cu-O bonds.
pacs:
PACS numbers: 74.72.-h, 33.20.fb, 74.20.FIn conventional metals infrared (IR) and dc () conductivity as well as electronic Raman scattering are expected to reveal a consistent picture of the electronic properties even in lowest order approximation. In metals with strong electronic interactions the spectral response will be characteristically renormalized (vertex corrections) for the IR and the Raman response. In spite of the strong correlations in high- superconductors such as YBa2Cu3O6+y (Y123) or Bi2Sr2CaCu2O8+y (Bi2212) the electron dynamics derived from IR and Raman spectroscopies agree quite reasonably as long as the selection rules are properly taken into account.opel2000 On the other hand, in low- cuprates such as La2-xSrxCuO4+y (LSCO) the far-infrared conductivity exhibits strong additional contributionsLobo ; basov peaked between 100 and 500 which do not have a counterpart in the Raman spectra.naeini In Bi2Sr2CuO6 (Bi2201) a similar peak in has been observed at low temperatures which is well separated from a conventional Drude termlupi00 having a width of only a few . This indicates the existence of states with a very long lifetime well below the pseudogap temperature Timusk and above the superconducting transition at . So far there is neither an explanation for this type of behavior, nor experimental information from a complementary spectroscopy.
In the present paper we compare IR and Raman spectra taken on the very same surface of a high-quality single crystal of underdoped LSCO. We observe strong absorption features in the far-infrared and, in the Raman response, a novel component for a given combination of photon polarizations. We show that these IR and Raman anomalies are related with each other and consistently point towards one-dimensional conductivity in the Cu-O planes.
The LSCO single crystal was grown by the traveling-solvent floating-zone technique. The Sr content was determined with energy-dispersive X-ray spectroscopy to be . The resistively measured transition temperature is K with a width (10-90%) K. After polishing the sample was reannealed in flowing oxygen for 50 hours at 920∘C, slowly (50 hours) cooled down to 500∘C where it was kept for another 50 hours. Finally it was cooled down to ambient temperature (50 hours). This procedure ensured that the crystal surface was strain free and of comparable quality as those used for photoemission experiments.
In the infrared experiment, the sample was mounted on the cold finger of a two stage closed-cycle cryostat, whose temperature was kept constant within K and could be varied from 20 to 295 K. The reflectance of the crystal was measured at quasi-normal incidence (8∘) with the radiation field polarized in the CuO2 () planes. The reference was obtained by evaporating a gold layer onto the sample by using a hot filament placed in front of the surface. Homes Spectra from 20 to 20,000 cm-1 were collected by a rapid scanning interferometer. In the far infrared, different combinations of mylar beamsplitters and bolometers were used to exclude that “ghost” spectral features might appear when connecting different spectral ranges. For the Raman experiment the sample was mounted on the cold finger of a He-flow cryostat. The spectra were measured with a resolution of . All polarizations were in the plane. For different polarization combinations of the incoming and the outgoing photons different regions on the Fermi surface can be probed independently.
Spectra of the normal-state electronic Raman response of La1.9Sr0.1CuO4 are shown in Fig. 1 for the two symmetries projecting out electrons with momenta approximately along the principal axes and the diagonals of the CuO2 plane, respectively. The structures from vibrational excitations are very weak in the plane (typically 10% of the total intensity) and have been subtracted out. At high energies, , the spectra are qualitatively similar to earlier results naeini and to those measured in Y123 and Bi2212. opel2000 ; chen93 ; Sugai Up to approximately the continuum is essentially constant in symmetry (Fig. 1 (b)) and increases linearly in symmetry (Fig. 1 (a)).
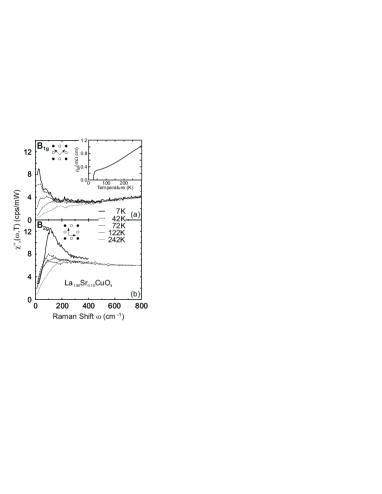
In the range below we observe the usual increase of the spectral weight in symmetry upon reducing the temperature (Fig. 1 b)) leading to an increasing slope of the response in the dc limit. Since with the static lifetime of the quasiparticles opel2000 this is compatible with the metallic decrease of the resistivity. In the superconducting state the characteristic redistribution of spectral weight and the formation of a pair-breaking peak is found.
In symmetry a similar metallic increase towards low temperature is revealed between approximately 250 and 100 K. The spectra are more flat indicating a larger relaxation rate or a shorter lifetime as well as a weaker temperature dependence than in symmetry. Similarly as in previous studies no pair-breaking feature can be observed below at this doping level. opel2000 ; naeini ; Sugai Completely unexpectedly, however, the low-energy response increases strongly for K. Although the spectra are measured down to the linear decrease (inevitably present for causality) towards zero energy cannot be resolved any more. Consequently, the lifetime must become very long and exceed the one observed at symmetry by far. The reason why this has not been observed before in LSCO is most likely because the spectra were not measured at energies below . For Y123 and Bi2212 such type of an increase can be excluded, hence we are facing a type of electron dynamics which has escaped observation so far. Are there corresponding features in the IR conductivity?
The raw reflectivity of the La1.90Sr0.10CuO4 crystal is shown in the inset of Fig. 2 at different temperatures. The real part of the optical conductivity was extracted from by usual Kramers-Krönig transformations. A Drude-Lorentz fit was used to extrapolate the reflectivity to . On the high-energy side, the data were extrapolated with the reported in Ref. Tajima, . The resulting infrared conductivity of La1.90Sr0.10CuO4 is shown in Fig. 2. At all temperatures one observes strong spectral features below 200 cm-1 that are not related to infrared-active lattice vibrations of LSCO in the plane, as a comparison with the weak phonon line at 360 cm-1 demonstrates immediately. They cannot be wings of a Drude contribution either, because the dc conductivity at the respective temperatures is much lower than the conductivity in the peak at finite energies (see Fig. 2 and its caption). Below 100 K the spectral structures merge into a huge peak, and the conductivity reaches about 13,000 cm-1 at 40 cm-1 and 20 K. This softening goes along with a transfer of spectral weight which depletes the region between 100 and 200 cm-1.
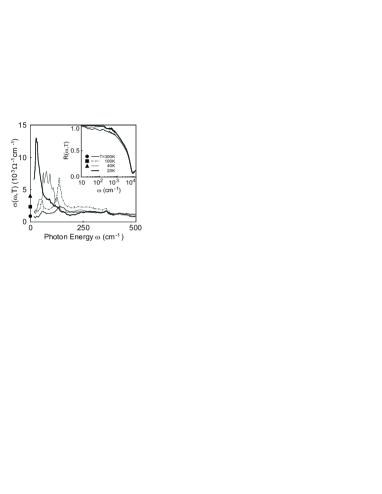
The resulting peak is similar to those observed in systems with one-dimensional (1D) charge ordering such as organic conductors Schwartz and laddersOsafune . In the latter compounds, an infrared pseudogap opens at low along the axis that is parallel to the rungs, while a gapless strong peak is observed along the axis, parallel to the legs.Osafune . The latter behavior is remarkably similar to that reported in Fig. 2. Strong infared peaks at finite frequencies are also reported for other superconducting cuprates with low such as La2SrCuO4.06,Lobo Nd2-xCexCuO4-y,lupi99 Bi2Sr2CuO6, lupi00 , and assigned to isolated, interacting, and ordered polarons, respectively. In overdoped La2-xSrxCuO4 similar far-infrared features were observed. They were attributed to disorder and analyzed in terms of an “anomalous Drude” model.Startseva
In the present work, the comparison of IR and Raman data allows us to get deeper insight into the origin of the strong absorption peaks of LSCO shown in Fig. 2. The fully developed pair-breaking feature in the Raman spectrum (Fig. 1 (b)) indicates that the sample is very clean. In the presence of disorder the spectral weight at approximately twice the maximal gap energy would be reduced tpd92 ; tpd95 , and the pair-breaking peaks would be smeared out rapidly and disappear for . First of all, we can therefore exclude that the high conductivity at approximately (Fig. 1 (a)) originates from the presence of a significant amount of impurities. Secondly, the low-energy low-temperature Raman response in symmetry shows a pronounced increase of the lifetime of quasiparticles propagating along the principal axes (Fig. 1 (a)). This high “Raman conductivity” in the dc limit goes along with the occurrence of the conductivity peak in the IR at low but finite energies (Fig. 2).
The relationship between the two phenomena can be quantified by calculating the spectral weight. The quantity
| (1) |
is the first moment of the infrared spectrum between and . In lowest order one obtains for the Raman response opel2000 ; viro92 . Hence, we determine
| (2) |
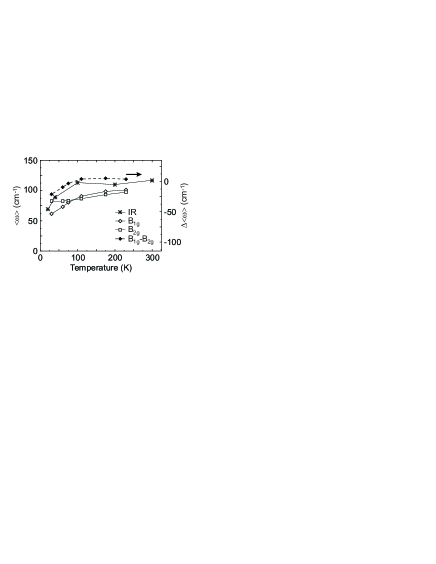
In Fig. 3, all moments are plotted vs. temperature using = 20 cm-1 and = 200 cm-1. The moment derived from the conductivity is temperature independent down to approximately 100 K and decreases by up 35% for K. The moments of the Raman response do not have a constant part since there is no sum rule. At symmetry an essentially linear decrease is found while at symmetry a crossover of two linear regimes with different slopes occurs. In the high-temperature range the slopes of and symmetry are similar. In order to better visualize the changes in symmetry we also plot the difference in Fig. 3. Apparently, closely follows the behavior of . Both quantities are nearly constant at high and exhibit a kink around 100 K. Of course, the relative changes cannot be expected to be equal since different quantities are being measured. However, the comparison demonstrates that the enhanced conductivity at finite energy observed in the IR spectra and the exceptionally long quasiparticle lifetime derived from the Raman response are apparently two aspects of a common underlying change in the electronic properties.
For the similarity of the IR response in LSCO and 1D ladder compoundsOsafune we consider charge ordering as a possible scenario for an explanation of our results. The selection rules and the coherence factors help clarifying the different spectral shape of the response. In crystals or subunits such as the CuO2 planes with a center of inversion the mutual exclusion principle holds, and IR-active (odd or polar) excitations cannot be observed in the Raman spectrum (even excitations) and vice versa tinkham . In addition, due to the coherence factors collective phenomena such as superconductivity or density waves which are a possible way to look at charge ordering lead to different spectra in the Raman response and in the conductivity einzel ; dora2000 . For instance, in the superconducting state the Raman response is characterized by a pile up of spectral weight around while the conductivity is partially or fully suppressed below twice the gap, and the weight is transferred towards . In case of a density wave the roles of IR and Raman response are essentially reversed. For a pinned density wave there is an additional collective mode developing inside the gap indicating that a finite energy is required to trigger an in-phase motion of the charges dora2000 . Hence, the IR and Raman spectra observed in underdoped LSCO can, at least on a qualitative level, be understood in terms of density wave with incipient pinning. Recently, in a numerical study on the basis of the model using parameters realistic for LSCO the strong Drude weight for the conductivity parallel to the stripes and an incoherent contribution at finite energy were predicted.tohyama99
There is indeed a wealth of experimental evidence for fluctuating stripes in LSCO bianconi and static ones in Nd-doped LSCOTranquada ; noda99 . In underdoped LSCO with they are oriented parallel to the CuO bonds (principal axes).Fujita This orientation of the stripes would be compatible with the observed symmetry dependence in Raman scattering, i.e. the long lifetime seen in the spectra where, as opposed to the symmetry, the polarizations of both the incoming and outgoing photons have a finite projection in the direction of the 1D structures. Hence, the combination of IR and Raman spectroscopies provides not only additional evidence for the formation of stripes in LSCO but also clarifies the low-energy electron dynamics. The onset temperature for the formation of stripes is identified by several authors Sharma ; Tsuei with the temperature where a pseudogap,Timusk anisotropic in the momerntum space, Loeser ; Williams opens in the charge excitation spectrum. is of the order of 400 K for LSCO with 0.10, consistent with the present IR observations which already show a well-defined excitation peak at room temperature. The influence of charge-ordering phenomena on the electron dynamics increases with decreasing temperature. Significant changes of the physical properties can be expected when one-dimensional objects becomes longer than the distance between the stripes and comparable to the electron mean free path. Indications of an enhanced dc conductivity along the stripe direction have indeed been found recently by longitudinal transport ando2001 close to temperatures at which the moments start to decrease (Fig. 3). Similarly, the transverse (Hall) conductivity decreases below approximately 80 K when the stripes are being completely pinned in Nd-doped LSCO.noda99 Finally, recent results of inelastic neutron scattering on La1.93Sr0.07CuO4 showHiraka a strong increase in the stripe fluctuations below 100 K for energies between 2 and 8 meV (16 and 64 cm-1, respectively).
In summary, we have studied a single crystal of underdoped LSCO by
both IR an Raman spectroscopy. At high temperatures the Raman
response is similar to that in other cuprates, while the IR
spectrum shows an anomalous absorption peak around 150 cm-1.
Below approximately 100 K a new type of electronic state is
observed to develop in the Raman response, while the IR peak
rapidly displaces to lower energies. The high IR conductivity in
the range between 20 and and the high dc
conductivity found in the Raman response are interpreted
in terms of a collective mode and an enhanced 1D dc transport,
respectively, in a charge-density-wave (CDW) scenario or, equivalently,
by low-energy stripe fluctuations with a correlation length of
several lattice constants. It appears that this state is
preferably building up in compounds with low possibly due to
structural peculiarities that favor the pinning of the CDW.
We would like to express our gratitude to C. Castellani, C.
Di Castro, P. Giura, M. Grilli, A. Nucara, and A. Virosztek for
important discussions and useful comments. Financial support by
the DAAD and the CRUI via the Vigoni program 2000/2001 is
gratefully acknowledged. Part of the project has been supported by
the DFG under grant number HA2071/2-1. F.V. and Q.-M.Z. would like
to thank the Gottlieb Daimler - Karl Benz Foundation and the
Alexander von Humboldt Foundation, respectively.
Note added in proof: Along with or briefly after the submission of the manuscript two papers on the IR properties of LSCO samples in a similar doping range appeared. takenaka2002 ; dumm2002 There are certain discrepancies between the 3 papers which cannot be discussed in detail here. However, they concern mainly the temperature range where a far-infrared peak at finite frequency is observed. Indeed, in Ref. takenaka2002 a far-infrared peak is resolved from the Drude term at K while in Ref. dumm2002 the peak is resolved at low temperature, both in Nd-doped (Fig. 1) and Nd-free (Fig. 3) LSCO. The discrepancies among the three papers are possibly related to a different spectral weight of the Drude term in different samples. In Ref. dumm2002 the interpretation of the peak is slightly different from ours, but also in terms of charge ordering.
References
- (1) Permanent address: National Laboratory of Solid State Microstructures, Department of Physics, Nanjing University, Nanjing 210093, P. R. China
- (2) M. Opel et al., Phys. Rev. B 61, 9752 (2000).
- (3) R. P. S. M. Lobo et al., Europhys. Lett. 37, 341 (1997).
- (4) T. Startseva et al., Phys. Rev. B 59, 7184 (1999)
- (5) J. G. Naeini et al., Can. J. Phys. 5-6, 483 (2000).
- (6) S. Lupi et al., Phys. Rev. B 62, 12418 (2000).
- (7) For a review on the pseudogap problem, see T. Timusk and B. Statt, Rep. Prog. Phys. 62, 61 (1999).
- (8) C. C. Homes et al., Appl. Optics 32, 2976 (1993).
- (9) X. K. Chen et al., Phys. Rev. B 48, 10530 (1993).
- (10) S. Sugai and T. Hosokawa, Phys. Rev. Lett. 95, 1112 (2000).
- (11) S. Tajima et al., J. Opt. Soc. Am. B6, 475 (1989).
- (12) A. Schwartz et al., Phys. Rev. B 58, 1261 (1998).
- (13) T. Osafune et al., Phys. Rev. Lett. 82, 1313 (1999).
- (14) S. Lupi et al., Phys. Rev. Lett. 83, 4852 (1999).
- (15) T. Startseva et al., Physica C 321, 135 (1999).
- (16) T. P. Devereaux, Phys. Rev. B 45, 12965 (1992).
- (17) T. P. Devereaux, Phys. Rev. Lett. 74, 4313 (1995).
- (18) A. Virosztek and J. Ruvalds, Phys. Rev. B 45, 347 (1992).
- (19) M. Tinkham, Group Theory and Quantum Mechanics (McGraw-Hill, New York, 1964).
- (20) T. P. Devereaux and D. Einzel, Phys. Rev. B 51, 16336 (1995).
- (21) B. Dora and A. Virosztek, Eur. Phys. J. B 22, 167 (2001).
- (22) T. Tohyama, S. Nagai, Y. Shibata, and S. Maekawa, Phys. Rev. Lett. 82, 4910 (1999).
- (23) A. Bianconi et al., Phys. Rev. Lett. 76, 3412 (1996).
- (24) J. M. Tranquada et al., Nature 375, 561 (1995).
- (25) T. Noda, H. Eisaki, and S. Uchida, Science 286, 265 (1999).
- (26) Fujita et al., Phys. Rev. B 65, 64505 (2002), and references therein.
- (27) R. P. Sharma et al., Nature 404, 736 (2000).
- (28) C. C. Tsuei and T. Doderer, Eur. Phys. J. 10, 257 (1999).
- (29) A. G. Loeser et al., Science 273, 325 (1996).
- (30) G. V. M. Williams et al., Phys. Rev. Lett. 78, 721(1997).
- (31) Y. Ando et al., cond-mat/0108053 (2001).
- (32) H. Hiraka et al., cond-mat/0104087 (2001).
- (33) K. Takenaka et al., Phys. Rev. B 65, 092405 (2002).
- (34) M. Dumm et al., Phys. Rev. Lett. 88, 147003 (2002).