Neutron Scattering Study of
Relaxor Ferroelectric (1-)Pb(Zn1/3Nb2/3)O3-PbTiO3
Abstract
Neutron elastic diffuse scattering experiments performed on Pb(Zn1/3Nb2/3)O3 (PZN) and on its solid solution with PbTiO3(PT), known as PZN-PT, with =4.5% and 9% around many reflections show that diffuse scattering is observed around reflections with mixed indices in the transverse and diagonal directions only. From the width of the diffuse scattering peak a correlation length is extracted. In PZN, we have reported that the diffuse scattering is more extended in the transverse than in the diagonal directions La-Orauttapong-etal:2001 . In the present work, the results show that the addition of PT leads to a broadening of the diffuse scattering along the diagonal, relative to the transverse directions, indicating a change in the orientation of the polar regions. Also, with the addition of PT, the polar nanoregions condense at a higher temperature above the transition than in pure PZN ( 40 K), due to stronger correlations between the polar regions. Neutron inelastic scattering measurements have also been performed on PZN-PT. The results show the broadening of the transverse acoustic (TA) phonon mode at a small momentum transfer upon cooling. We attribute this broadening to the appearance of the polar nanoregions.
pacs:
77.84.Dy, 61.12.-q, 64.70.Kb, 77.80.BhI Introduction
Lead-based complex perovskite relaxor ferroelectrics, such as the mixed compound (1-)Pb(Zn1/3Nb2/3)O3-PbTiO3 (PZN-PT) and (1-)Pb(Mg1/3Nb2/3)O3-PbTiO3 (PMN-PT), have recently attracted a great deal of attention because of their exceptional piezoelectric and dielectric properties. Particularly important are the compositions near the morphotropic phase boundary (MPB), where these properties are further enhanced. The high values of the piezoelectric and electrostrictive coefficients of PZN-PT and PMN-PT crystals of the compositions near the MPB, when measured in the proper orientations, are an order of magnitude greater than those of PbZr1-xTixO3 (PZT) ceramics Park-etal:1997 ; Viehland-etal:2001 . As a result, PZN-PT and its magnesium analogue PMN-PT are now being considered as the most promising candidates for the next generation of electromechanical transducers.
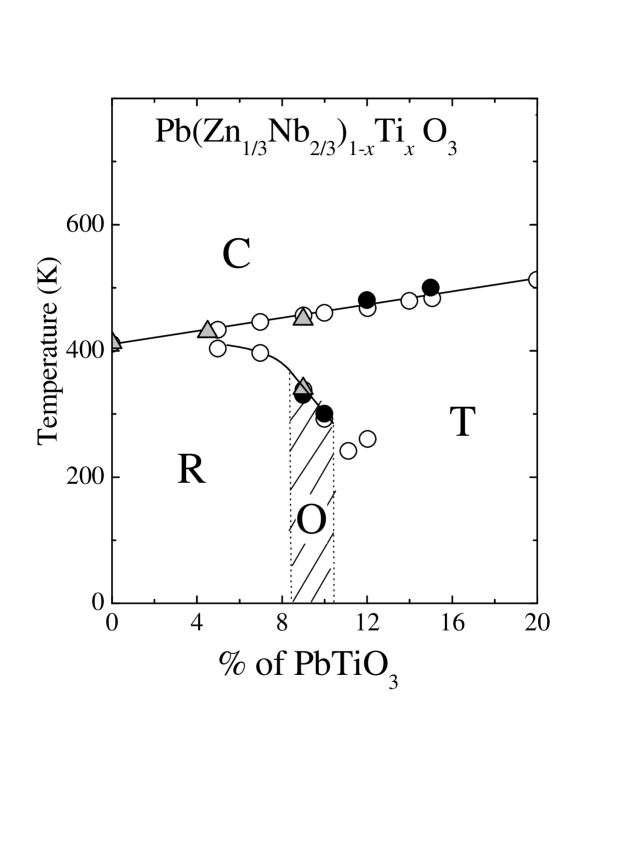
In the phase diagram of these systems, the MPB was initially believed to be an almost vertical boundary that separates the rhombohedral (space group ) from the tetragonal () phase and located close to the value of for PZN-PT and for PMN-PT Kuwata-etal:1981 ; Shrout-etal:1990 . When crossing this boundary along the horizontal concentration axis, the system would change abruptly from one phase to the other. However, near the boundary, there is a delicate microstructural equilibrium that should favor easy local atomic rearrangements. This explains the very large coefficients observed. In addition to the known rhombohedral and tetragonal phases, a recent breakthrough has been achieved with the discovery of a sliver of a new monoclinic phase in PZT Noheda-etal:PZT:2001 . New orthorhombic and monoclinic phases have also been found in PZN-PT and PMN-PT Cox-etal:2001 ; La-Orauttapong-etal:2002 ; Noheda-etal:phasePMNPT:2002 . These new phases play a key role in explaining the high piezoelectric and electrostrictive responses near the MPB. In PZN-PT, the new phase is of orthorhombic symmetry () and extends in a narrow concentration range around the MPB () with almost vertical phase boundaries on either side (see Fig. 1) La-Orauttapong-etal:2002 . This new phase can be described as a “matching” phase between the rhombohedral and tetragonal phases. This means that the polarization vector, instead of being aligned with a particular crystal axis, may be pointing in an arbitrary direction within a plane, allowing for a very easy reorientation of the polarization vector Fu-Cohen:2000 . Recently, a modelVanderbilt-Cohen:2001 has been proposed, that connects the structural featuresNoheda-etal:PZT:2001 of the lead relaxor systems with their unusual polarization propertiesFu-Cohen:2000 .
In addition to the above structural features, there exists another aspect of the polarization properties of relaxor systems, whose precise connection to these structural features has not been established yet. It is now a well recognized fact that, as relaxors are cooled from high temperatures, any long range structural change, if it develops, is preceded by the appearance and growth of polar nanoregions. The first indirect observation of such regions came from birefringence measurements by Burns and Dacol on PMN and PZN Burns-Dacol:1983 . These measurements revealed deviations from a linear temperature dependence of the birefringence (= ) at a temperature , i.e. far above the temperature range in which PZN displays the relaxor behavior. It is now believed that this birefringence is due to local asymmetric structural distortions that do not yet have a polar character. Since then, several other experimental observations have been reported, that support the appearance of the local distortions in lead relaxors below 650 K for PMN and below 750 K for PZN. The most direct ones have come from measurements of diffuse X-ray or neutron scattering Mathan-etal:1991 ; You-Zhang:1997 . Recently, we have reported diffuse neutron scattering results on a PZN single crystal upon cooling (550 K-295 K), which clearly reveal the development of a medium range or mesoscopic order La-Orauttapong-etal:2001 . The width of the diffuse scattering peak, which is related to a correlation length, is shown to provide a measure of the size of the polar nanoregions. At high temperature, the temperature dependence of the correlation length is consistent with the Curie-Weiss dependence of the dielectric constant. This indicates the purely dynamic character of the polarization, characteristic of paraelectric behavior. At a temperature ( = 40 K) in pure PZN, the lifetime of the polar correlations becomes progressively longer, leading to the formation of the polar nanoregions. Their formation is accompanied by the development of permanent strain fields, which cause the Bragg intensity to increase rapidly (relief of extinction). Other indirect evidence for the formation of the polar regions comes from inelastic neutron scattering measurements Naberezhnov-etal:1999 ; Gehring-etal . Particularly noticeable are the results of Gehring et al. showing the disappearance of the soft transverse optic (TO) mode from the inelastic neutron scattering spectra of PZN and PZN-PT (as well as PMN and PMN-PT) Gehring-etal . This disappearance has been attributed to a coupling of the TO and TA modes, enhanced by the formation of the polar regions but no precise mechanism has been proposed and the role of the polar regions has not been clearly explained. The goal of the present study was (i) to extend the previous PZN study to several reflections in other scattering zones, (ii) to identify more definitely the onset of the polar order and verify its temperature evolution, and (iii) to investigate the local structural and polar order at higher PT concentrations (). In order to understand the dynamic behavior of the polar regions, acoustic phonon measurements were also made.
PZN is a prototype relaxor ferroelectric that possesses an ABO3 cubic perovskite structure in which the B site can be occupied by two different cations, Zn2+ and Nb5+. Because of the different radii and valences of these two cations, PZN exhibits short-range chemical ordering and local fluctuations in composition on a nanometer scale Yokomizo-etal:1970 ; Randall-Bhalla:1990 . It begins to transform from a cubic to a rhombohedral phase at K, which falls in the temperature region of the maximum of the dielectric peak. PbTiO3(PT), on the other hand, is a normal perovskite-type ferroelectric that develops a typical long-range ferroelectric order, when transforming from a cubic to a tetragonal phase at K. In the 1980′s, a series of complete solid solutions of the relaxor PZN and ferroelectric PT were synthesized in the range 0 0.2. This led to a very important development in the field of ferroelectrics Kuwata-etal:1981 . In the present paper, we report the results of a diffuse neutron scattering study of several PZN-PT single crystals with =0, 4.5, and 9% and propose a model that provides a physical basis for the easy reorientation of the polarization in lead relaxors.
| Mass | Collimation | -range | -range | |||
|---|---|---|---|---|---|---|
| Sample | (g) | Spectrometer | (′ = minutes) | ( Å) | (meV) | (K) |
| PZN | 0.55 | HB-1 | 48′-20′-20′-70′ | 2.45 | 0 | 550-295 |
| HB-1A | 40′-20′-20′-68′ | 2.36 | 0 | 550-295 | ||
| PZN-4.5%PT | 2.87 | BT2111Only BT2 was set to measure in the [100]-[010] scattering zone. | 60′-20′-20′-open | 2.36 (1.71)2221.71 was used only for (300) and (310) reflections. | 0 | 720-300 |
| BT7 | 20′-20′-20′-open | 2.47 | 0 | 650-375 | ||
| BT9 | 40′-22′-20′-80′(or open) | 2.36 (1.64)3331.64 was used only for (400) reflection. | 0 | 650-300 | ||
| 40′-44′-60′-80′ | 2.36444Inelastic scan by holding the momentum transfer = - constant, while scanning the energy transfer = . | 0-10 | 650-375 | |||
| PZN-9%PT | 5.15 | HB-1A | 40′-20′-20′-68′ | 2.36 | 0 | 600-295 |
| HB-1 | 48′-40′-40′-240′ | 2.45444Inelastic scan by holding the momentum transfer = - constant, while scanning the energy transfer = . | 0-14 | 600-400 |
II Experiment
Single crystals of PZN and PZN-9%PT were grown by spontaneous nucleation from high temperature solutions, using an optimized flux composition of PbO and B2O3 Zhang-etal:2000 . The PZN-4.5%PT single crystal was grown by the top-cooling solution growth technique, using PbO flux Chen-Ye:2001 . All as-grown crystals used in the experiment exhibited a light yellow color and high optical quality.
The neutron experiments were carried out on BT2, BT7, and BT9 triple-axis spectrometers at the NIST Center for Neutron Research (NCNR) and on HB1 and HB1A triple-axis spectrometers at the High Flux Isotope Reactor (HFIR) of Oak Ridge National Laboratory. Highly oriented pyrolytic graphite (002) (HOPG) was used to monochromate and analyze the incident and scattered neutron beams. A HOPG filter was used to suppress harmonic contamination. The samples were mounted on an aluminum sample holder, wrapped in a copper foil and held in place with either an aluminum or a copper wire. To prevent contamination of the spectra by scattering from aluminum, the sample holder was painted with gadolinium oxide or boron nitride paste. The sample was then placed inside a closed-cycle helium refrigerator capable of reaching temperatures up to 675 K. It is very important to note here that, if the aluminum sample holder is present in the incident neutron beam, it will contribute an extraneous signal near the (200) reflection. This signal is generated from the Al (200) peak and overlaps with that of the sampleKoo-etal:2002 , since both have similar lattice constants ( 4.05 Å). The measurements were made around several reciprocal lattice points in the [100]-[011] or [100]-[010] scattering planes, which allowed access to the [100], [011], and [111] symmetry directions. Data were collected upon cooling and no external electric field was applied. All samples and experimental conditions, including the spectrometers, the collimations, the neutron wavelengths (), the range of energies (), and the temperature ranges () are listed in Table 1.
III Bragg and Diffuse scattering in PZN-PT
Our previous reportLa-Orauttapong-etal:2001 contained results on neutron elastic diffuse scattering from a PZN single crystal around the (011) Bragg reflection. These results provided a measure of the correlation length or size of the polar nanoregions as a function of temperature. In the present work, we have extended the investigation of pure PZN to solid solution crystals of PZN-PT with =4.5% and 9%, and explored several other reflections.
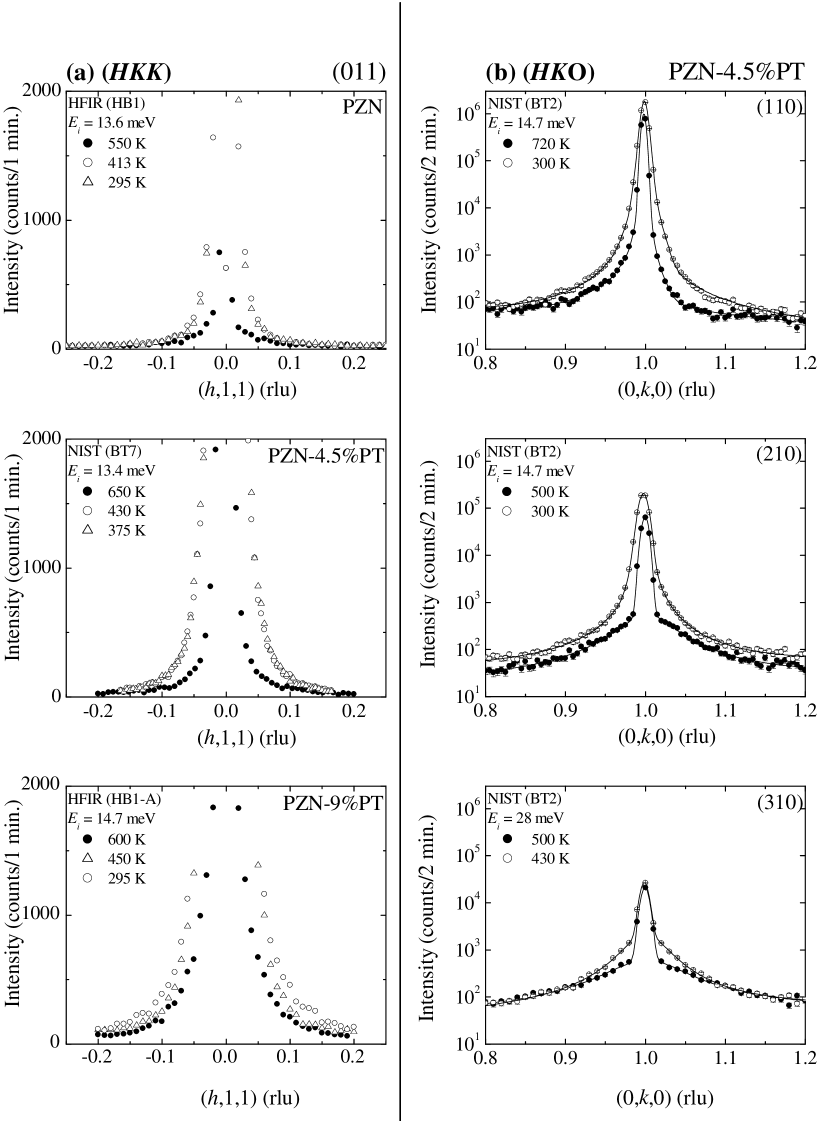
Typical neutron elastic diffuse scattering spectra around the (011) reflection along [100] direction in a [100]-[011] zone are shown in Fig. 2 (a) (left) for =0%, 4.5%, and 9%. Each spectra exhibits a narrow Bragg peak and a relatively broad diffuse scattering peak. When the temperature decreases, the diffuse scattering peaks broaden and become more extended in the transverse [100] direction in pure PZN and in the diagonal [111] direction in PT-doped PZN. The width of the peak also depends on concentration: the peak is broader for the 4.5%PT than for the 9%PT crystal. The broader peak means a shorter correlation length. Accordingly, in pure PZN the correlation length is found to be longer in the [111] direction but with adding PT it becomes longer in the [100] direction. It is also longer for 9%PT than for 4.5%PT. Below the transition, the width of the diffuse scattering peak remains constant, despite a continuing increase in strength of the Bragg peak with decreasing temperature. The fitted spectra around several reflection along [010] direction in a [100]-[010] zone are shown in Fig. 2 (b) (right) for =4.5%. This figure shows that, the higher the order reflections, the lower the Bragg intensities relative to the diffuse scattering. We will discuss this point later.
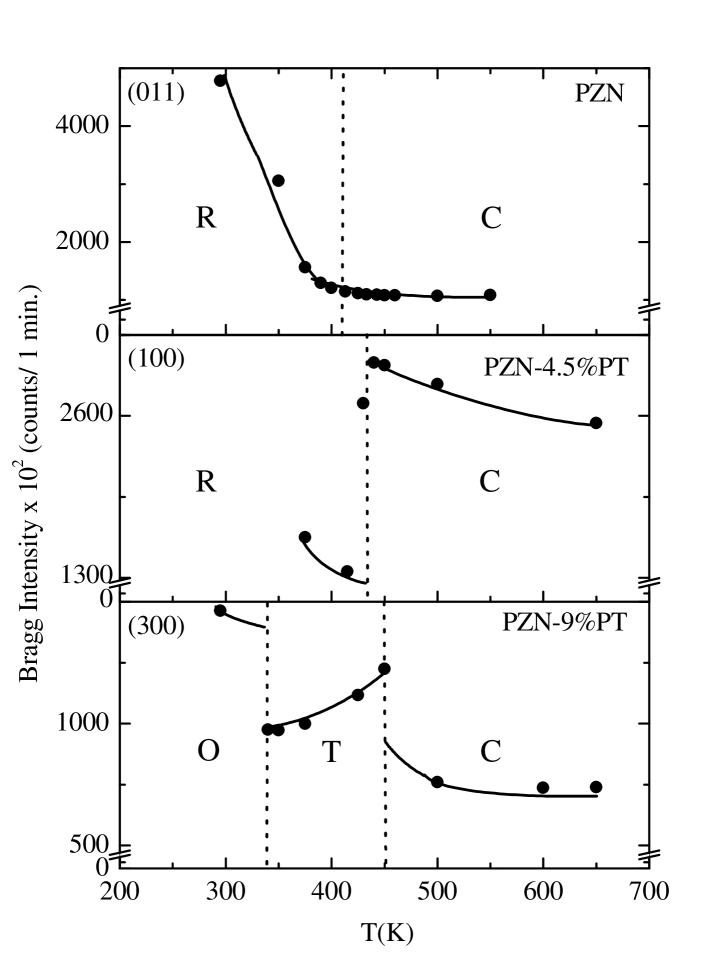
The temperature dependence of the Bragg intensities, presented in Fig. 3 for PZN, 4.5%PT, and 9%PT, reveals the phase transition temperature(s), . Pure PZN and PZN-PT are seen to behave very differently. The former undergoes a continuous structural transition, or freezing, while the latter undergoes abrupt structural changes. The particularly strong increase in Bragg intensity, observed for PZN below 410 K corresponds to the relief of extinction caused by a rapid increase in mosaicity La-Orauttapong-etal:2001 . In 4.5%PT, the Bragg intensity increases moderately as the transition is approached but abruptly drops at 430 K, when the crystal structure transforms from a cubic to rhombohedral symmetry. In the 9%PT crystal, two sharp transitions are observed, respectively at 450 K and at 340 K both marked by an abrupt increase in Bragg intensity. From these results, it is evident that the addition of PT triggers sharp structural changes that are otherwise absent. The transition temperatures observed in the present work are in agreement with those previously reported Kuwata-etal:1981 and plotted in Fig. 1.
| 111Other observed reflections (i.e. unmixed () indices, (111), (200), (022), and (400)) have no diffuse scattering. | |||
|---|---|---|---|
| 1 0 0 | 263 | 5.8 | 0.02 |
| 0 1 1222Results from the [100]-[011] scattering zone. | 982 | 44 | 0.04 |
| 2 1 0 | 63 | 3.3 | 0.05 |
| 3 0 0 | 17 | 3.9 | 0.23 |
| 3 1 0 | 21 | 5.6 | 0.27 |
In order to obtain information about the size and orientation of the polar regions, we fitted the spectra with a combination of a Gaussian (Bragg) function and a Lorentzian (diffuse) function La-Orauttapong-etal:2001 , which was then convoluted with the experimental resolution function, shown as solid lines in Fig. 2 (b). The fit was excellent in almost all cases, with being close to 1. For higher order reflections, (i.e. (300) and (310)), the Bragg intensity is relatively low, which makes the data analysis easier. However, for lower order reflections the data was difficult to analyze because of the very intense Bragg intensity, which was several orders of magnitude stronger than the diffuse intensity part (see Figs. 2 (b) and 3). The fit was nevertheless successful, but the data were fit by the sum of several Gaussian functions plus a Lorentzian function. Table 2 lists the Bragg and diffuse intensities and their ratio (). This ratio is very large at (310) but small at (100). The values found in the present study are in agreement with those reported in earlier neutron scattering studies by Mathan et al. Mathan-etal:1991 and Vakhrushev et al Vakhrushev-etal:1995 . The model calculation of both intensities by Mathan et al. is close to the polar structure of BaTiO3 with antiparallel displacements of cations against oxygen ions.
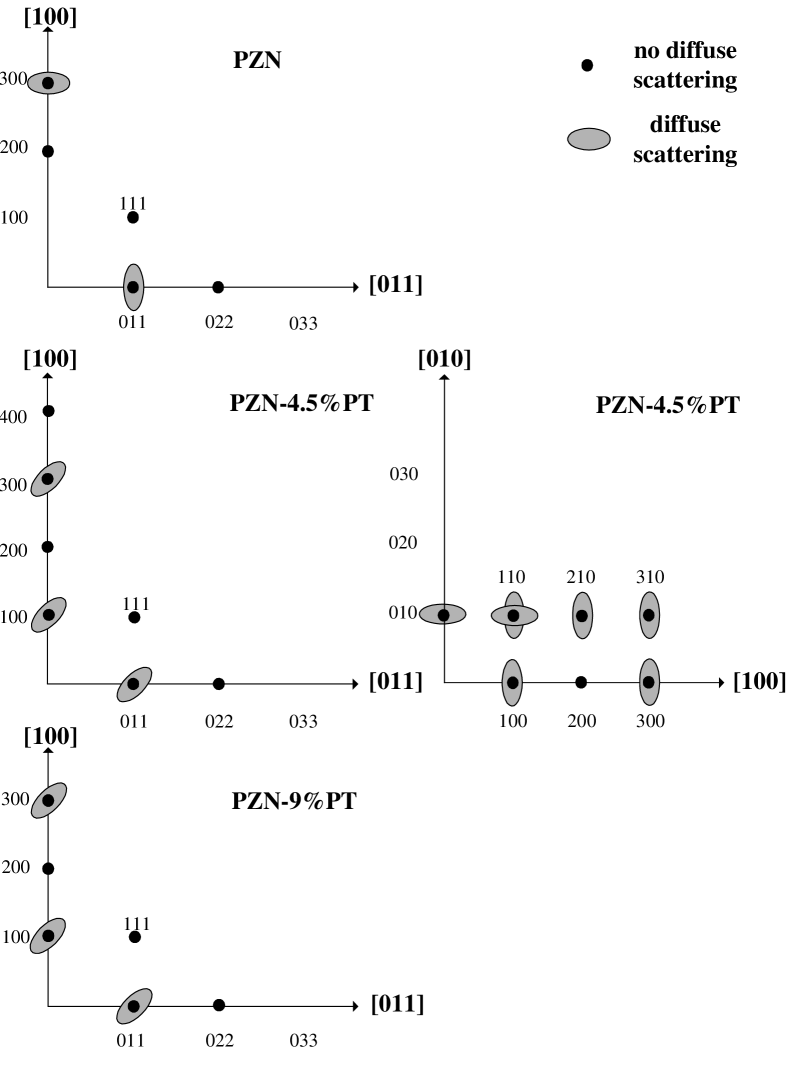
The diffuse scattering results are summarized in Fig. 4. Two major observations can be made in this figure. First, diffuse scattering is observed near the same reciprocal lattice points for all three concentrations. Diffuse scattering was only found for reflections with mixed indices (i.e. or ). None of the unmixed indices (i.e. or ) showed any diffuse scattering (as summarized in Table 2). Secondly, the diffuse scattering spots or ellipses are preferentially oriented in transverse directions for PZN and in the diagonal directions for PZN-PT. No diffuse scattering was found in purely longitudinal scans. The first observation contains information on the internal structure of the polar nanoregions. Because diffuse scattering can be regarded as the Bragg scattering of a nascent phase, the diffuse intensity at different reciprocal lattice points is expected to be proportional to the static structure factors for this new phase at these different points. Hence, the fact that diffuse scattering is observed at the same reciprocal lattice points for all three concentrations indicates that the internal structure of the new phase, and therefore of the polar regions, is the same for all three concentrations. The second observation contains information on the preferred directions in which the polar correlations develop. The width of the diffuse scattering being inversely proportional to the correlation length (, the change in orientation of the diffuse scattering ellipses from PZN to PZN-PT indicates that, upon adding PT, the correlations tend to grow in a different direction.
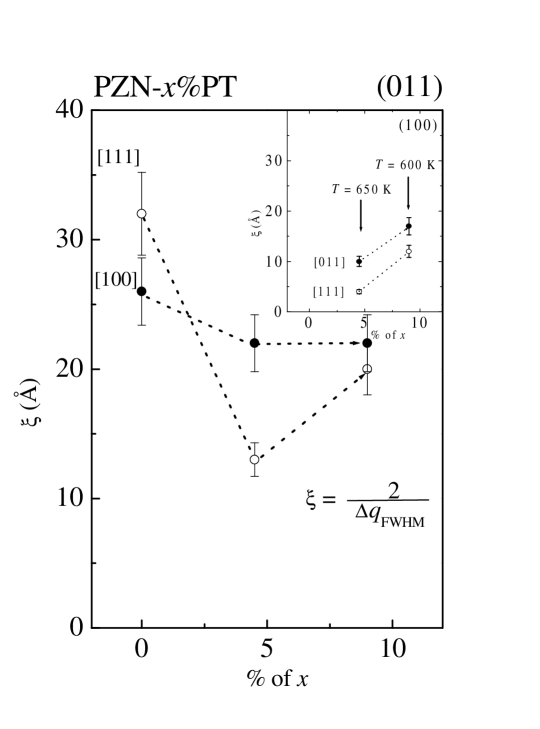
In PZN, the polar regions are preferentially more extended in the diagonal [111] than in the transverse [100] or [110] directions, which is consistent with the larger Pb displacement along [111]. However, upon adding PT, the preferred orientation evolves to the transverse directions. This trend is clearly illlustrated in Fig. 5, in which the correlation length around the (011) and (100) reflections is shown as a function of concentration and at temperatures far above . The crossover from one orientation to the other appears to be around . Values of the correlation lengths obtained from measurements around different reflections in 4.5%PT at three temperatures, 720 K (), 500 K (), and 300 K (), are also summarized in Table 3. For this concentration, the correlation lengths are, respectively, about 4-18 Å (or 1-4 unit cells), 13-30 Å (3-7), and 51-91 Å (13-22), small at high temperature and growing upon cooling. The longest correlation length is observed around (110) and the shortest one around (310). The correlation lengths measured around different reflections are ordered similarly at all three temperatures (eg. the size measured at (110) is always found to be larger than the one at (210)).
The absence of diffuse scattering around the (200) reflection ( unmixed) in PZN as well as in PZN-PT is of particular significance. A calculation of the dynamic structure factor for a perovskite ferroelectric indicates that the diffuse scattering intensity should be large around the (200) reflection, if it were due to correlations associated with the usual soft polar mode Harada-etal:1970 . The present results therefore indicate that the diffuse scattering observed is not due to the soft mode but, rather, to the polar regions that are ubiquitous in relaxor ferroelectrics. This important point is discussed in detail in section V.
| Correlation length (Å) | |||||
| around reflections | |||||
| 100111Results from the [100]-[011] scattering zone are in parenthesis for the [011] and [111] directions, respectively. | 110 | 210 | 300 | 310 | |
| 720222At 720 K, 1-4 unit cells. | 10 | 18 | 4 | 10 | - |
| 500333At 500 K, 3-7 unit cells. | 25(30,18) | - | 15 | 27 | 13 |
| 300444At 300 K, 13-22 unit cells. | 87 | 91 | 51 | 65 | - |
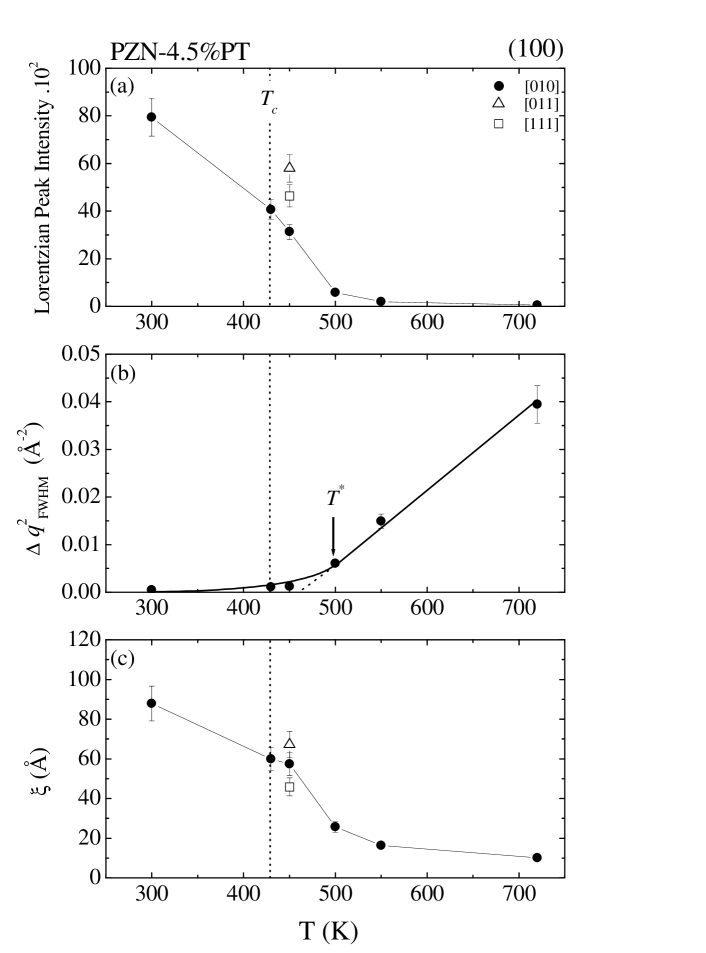
The temperature dependencies of the Lorentzian fit parameters, i.e. the diffuse intensity (top), the square of the diffuse scattering width at half maximum, (middle), and the correlation length (bottom) are presented in Fig. 6 for 4.5% at the (100) reflection. The diffuse scattering intensity, in ferroelectrics, is expected to be proportional to the average polarization squared . In Fig. 6 (a), the diffuse scattering intensity increases continuously with decreasing temperature, first slowly down to 500 K, then faster as it approaches K. Also, the overall diffuse intensity is found to be lower in the [111] direction than in the [011] direction. This is consistent with the observations made earlier concerning the preferred direction of the correlations in the PT crystals by contrast with the preferred direction in pure PZN. In Fig. 6 (b), the full width (at half maximum) squared, , is plotted as a function of temperature. As we have explained earlier La-Orauttapong-etal:2001 , the initial linear dependence, down to 500 K, corresponds to a Curie-Weiss behavior expected in a temperature range in which the polar correlations are purely dynamic. At approximately 500 K (or , with K), deviates from a straight line and finally levels off at lower temperatures. The deviation from this linear dependence marks the appearance of long lived and slowly relaxing polar regions. Not unexpectedly, the appearance of the polar regions and the process of slowing down begins at a higher temperature in PZN-PT than in pure PZN (for which 40 K). This fact can be ascribed to the enhanced correlations between polar clusters and their stabilization by the tetragonal strain introduced by the presence of PT. Below a certain temperature, the size of the polar regions saturates and “freezing” may occur, as indicated by a constant width of the diffuse scattering peak. In Fig. 6 (c), we present the temperature dependence of the correlation length for 4.5%PT at the (100) reflection along the [010] direction. Upon cooling, the correlation length increases continuously, but more rapidly below 500 K, and also tends to saturate at low temperatures. It is important to emphasize that the correlation length in this direction is smaller than in the transverse [011] direction, as measured in the [100]-[011] scattering plane. This is primarily associated with the short-range correlated displacements of the Pb atoms La-Orauttapong-etal:2001 .
IV Transverse acoustic phonon (TA) damping
The electrostrictive effect arises from the coupling between polarization and acoustic waves or strain. In relaxors, the polarization originates from the polar nanoregions. Because of the unusually strong electrostriction exhibited by relaxors Park-etal:1997 ; Viehland-etal:2001 , one should expect changes in the behavior of the acoustic phonons when the polar regions appear. Such changes should also be expected in coupling between the TO and TA phonons. Recent inelastic neutron scattering studies have revealed a very anomalous damping of the TO phonon in lead relaxors Gehring-etal . This so-called “waterfall” effect has been attributed to the TO-TA coupling. However, because the waterfall is not observed in conventional ferroelectrics, it is clear that the TO-TA coupling cannot, by itself, explain this effect. The strong electrostriction and the polar nanoregions must, therefore, play an essential role. In order to understand this role, we have carried out acoustic phonon measurements in 4.5%PT and 9%PT crystals. Constant- scans () were used to collect data on each sample, where is the momentum transfer relative to the = (2,0,0) and (2,1,1) Bragg points, measured along the [] and [] symmetry directions, respectively. The peak position of the scattered neutron intensity as a function of (top) and the full width at half maximum (FWHM) as a function of temperature (bottom) are presented for 4.5%PT in Fig. 7 (a) and for 9%PT in Fig. 7 (b). The most important feature of these data is the increase in the FWHM of the TA phonon peak upon cooling for intermediate values. The results obtained on the 4.5%PT are shown in Fig. 7 (a) for = (2,-0.07,-0.07) (or 0.10 rlurlu ), = (2,-0.14,-0.14) ( 0.20 rlu), and = (2,-0.25,-0.25) ( 0.35 rlu). For small 0.10 rlu, the phonon peak remains narrow at all temperatures, and may even be narrower at 375 K. This is consistent with the fact that no corresponding diffuse scattering was observed at = (2,0,0). Broadening of the phonon occurs only for longer . For 0.35 rlu, the peak is already quite broad at 650 K, suggesting that, the greater the , the higher the temperature at which the phonon becomes heavily damped. This behavior is definitely consistent with the formation of the polar nanoregions, smaller at high temperature and growing with decreasing temperature. These results are also consistent with other neutron studies of similar systems. For example, in an earlier inelastic neutron study of PMN, Naberezhnov et al. reported the broadening of the TA mode at = (2,2,0.2), near the Burns temperature, 650 K Naberezhnov-etal:1999 . Very recently, in a study of PMN-20%PT, Koo et al.Koo-etal:2002 have also reported a similar increase of the TA phonon damping. Finally, it is worth noting that the values of at which the TA phonon is observed to broaden in both the previous studies as well as in the present one, are close to at which the waterfall effect has been reported Gehring-etal .
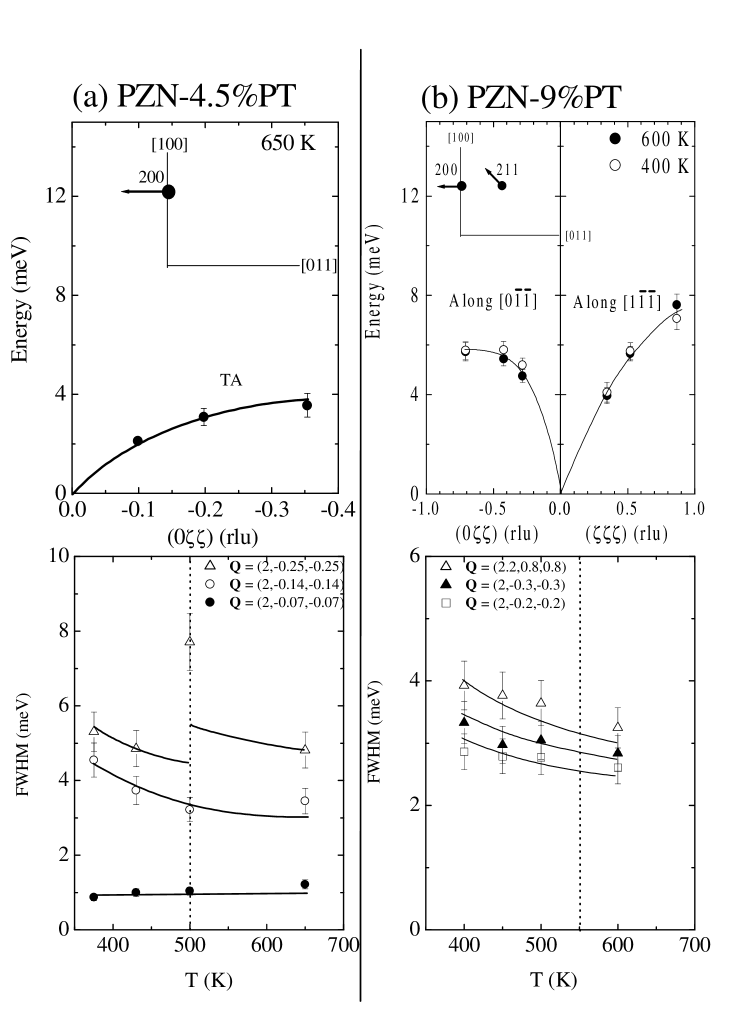
The phonon results obtained on the 9%PT crystal are shown in Fig. 7 (b). The peak positionrlu is clearly temperature independent in both directions (compare solid and open circles). The width or damping of the phonon is greater in the [] direction than in the [] direction. However, in the [] direction, it is smaller for this crystal than for the 4.5%PT one and it does not increase as fast with decreasing temperature (compare the FWHM vs. at = (2,-0.2,-0.2) or 0.28 rlu). This observation suggests that the TA damping decreases with increasing PT concentration. So far 9%PT is the highest concentration that we have studied. It would be interesting to follow the evolution of the TA damping in PZN-PT crystals with higher .
V Discussion
It is by now well established that compositional and/or site disorder brings about the formation of local polar nanoregions in mixed perovskite ferroelectrics, including PMN, PZT, and PZN. These regions result from short-range correlated ionic displacements Mathan-etal:1991 . They nucleate at a temperature well above the transition temperature, , and are dispersed as islands throughout the lattice. Diffuse neutron and X-ray scattering provide the most direct evidence for the morphology of these regions.
Diffuse scattering results provide two distinct types of information. The reciprocal lattice points around which diffuse scattering is observed provide information on the symmetry of the local lattice distortions or internal structure of the polar regions, and the shape or distribution of the diffuse scattering intensity around these points gives information on the morphology of the polar regions or the direction in which they grow. The first type of information concerns the direction of the polarization vector within the polar regions, and the second type, the orientation of the strain fields associated with them. In PZN-PT, the present data show that elastic diffuse scattering is only observed around points where the () indices have mixed parities, in particular (100), (110), (210), (300), and (310). Diffuse scattering is also strongest around (110). These results are identical to those reported for pure PZN, which we interpreted earlier as revealing the rhombohedral internal structure of the polar regions, consistent with the [111] displacement of the Pb2+ ions La-Orauttapong-etal:2001 . If the internal structure and the direction of the polarization vector are the same in both PZN and PZN-PT, the direction in which the polar regions grow is different in both systems. In pure PZN, the diffuse scattering was found to be more extended in a transverse direction ([100] or [011]), indicating the growth of the polar regions in a [111] direction. By contrast, in PZN-PT, the diffuse intensity becomes more extended in the diagonal [111], indicating the preferential growth of the polar regions in a [100] or [011] transverse direction. As shown in Fig. 5, the higher the PT concentration and the closer to a tetragonal [100], the higher the ratio of the correlation lengths in the transverse and [111] directions. This trend is represented schematically in Fig. 8, for PZN, 4.5%PT, and 9%PT in a [110]-[001] plane. Thus, with increasing PT, the local polarization direction remains unchanged ([111] direction), but the polar regions now preferentially grow in a different direction, closer to tetragonal.
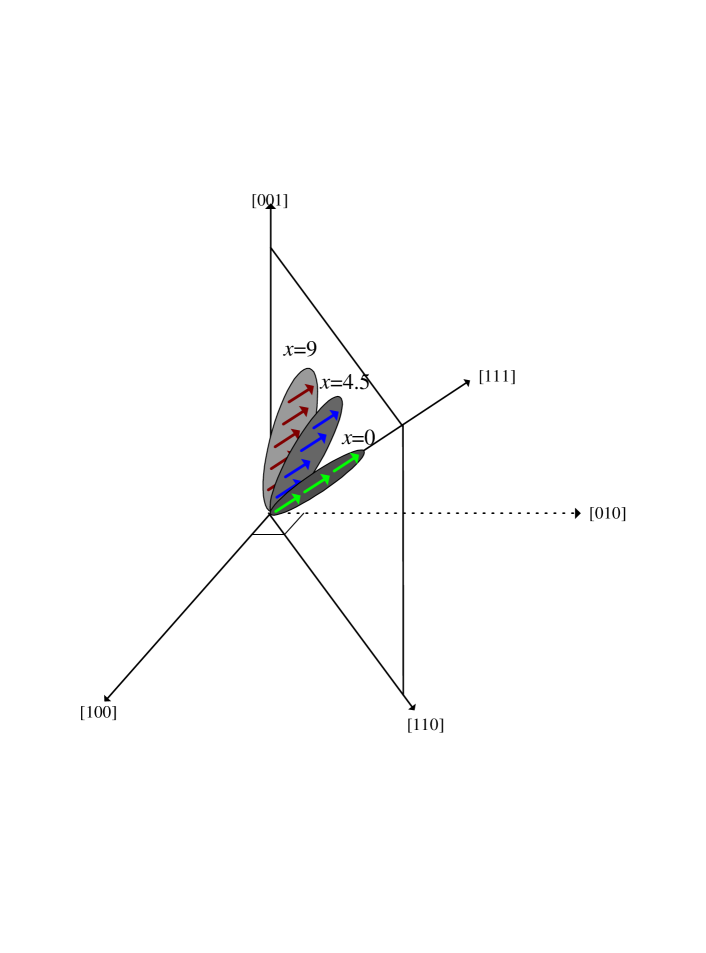
The picture presented in Fig. 8 illustrates the concept of local polarization and strain fields pointing in two different directions. The present picture provides a physical basis for the model proposed earlier by Fu and Cohen, in which the macroscopic polarization vector may be pointing in an arbitrary direction within a plane Fu-Cohen:2000 . The ease of rotation of the macroscopic polarization can now be understood to be due to the fact that the local strain fields only need to reorient by a much smaller angle than the local polarization. However, it is important to note that, although the results reported here clearly support such a picture, the diffuse scattering ellipse observed in a particular scattering plane may only be the projection of the 3D scattering ellipsoid. Additional measurements would be necessary to map out entirely the diffuse scattering ellipsoids. The temperature dependence of the diffuse scattering intensity in PZN and PZN-PT further demonstrates that it is related to the appearance of the polar nanoregions. Another equally strong element of proof is the absence of diffuse scattering around the (200) reflection. This was checked in all possible directions and in two different scattering zones [100]-[011] and [100]-[010]. Because, in perovskites, the static structure factor that corresponds to the soft phonon mode is largest at the (200) reflection, the absence of diffuse scattering around this point clearly indicates that it is related to the presence of the local order that develops below 700-600 K. A similar result had been obtained earlier by one of us in two different relaxors, K1-xLxTaO3 (KLT) and KTa1-xNbxO3 (KTN) Yong-etal:2000 . Hirota et al.Hirota-etal:2002 have recently reported a similar result in PMN and have proposed the concept of the phase-shifted condensed soft mode, to account for the contribution of the polar nanoregions. In their dynamic calculation, the atomic displacements include both the optic mode displacement , satisfying a center of mass condition and the single phase shift within polar nanoregions.
The result presented above also reveal three important temperature ranges in the behavior of PZN and PZN-PT, which seems to be characteristic of all relaxor ferroelectrics. (i) At high temperature, , the correlation length squared, , is inversely proportional to temperature. Because is also proportional to the dielectric constant, this temperature dependence corresponds to a Curie-Weiss law, which indicates that, in this range, the polarization is entirely dynamic and the system behaves as a normal paraelectric. (ii) Below , the deviation from this Curie-Weiss law reflects the appearance of long-lived polar fluctuations in the crystal, accompanied by local strain fields; it is also in this range that the dielectric constant begins to exhibit a strong frequency dispersion, the relaxor behavior. This behavior is clearly due to the reorientation of the polarization or, as seen from the structural results reported here, of the long-lived polar nanoregions. With the addition of PT, increases from +40 K in PZN to +70 K in 4.5%PT. This trend is due to enhanced correlations between polar regions with increasing PT concentration. (iii) As the temperature is further decreased below , and as the polar regions grow, their local strain fields increase in strength and their reorientation becomes slower. In PZN, it is believed that there is no overall preferred [111] orientation, so that individual polar nanoregions eventually freeze out with their polarization in one of eight possible [111] axial directions, each according to their local strain field. Hence, the mosaicity increases and, due to the relief of extinction below K, the Bragg intensity rapidly rises. This interpretation is borne out by the fact that the Bragg intensity remains high at lower temperatures. It is also interesting to note that, simultaneously, the dielectric constant decreases rapidly at lower temperatures, which also confirms the freezing-in of the polar regions in PZN.
The addition of PT increases the magnitude of the local distorsions, with a tendency towards tetragonal symmetry, as in PbTiO3. In all of this, it is important to remember that strain is the dominant cause of orientational freezing and that the strain energy is the same whether the polarization points up or down. Further addition of PT increases the tetragonal strain, leading to an abrupt structural transition in 4.5 %PT at 430 K and two in 9%PT, at 450 K and 340 K, respectively. The abrupt character of these transitions suggests the first order character of strain-driven transitions.
In summary, the present elastic scattering results can be conveniently interpreted within the framework of three main temperature regions: (i) dynamic polarization fluctuations at high temperature (KK), (ii) condensation of polar nanoregions that can still reorient as a unit and progressive slowing down of the reorientational motion at intermediate temperatures (), and (iii) orientational freezing of the polar nanoregions at low temperatures (), with or without an explicit structural transition at .
When investigating the polarization dynamics of relaxors, it is also important to examine the TA phonons, since these can couple to the reorientation of the localized strain fields that are known to accompany the formation of the polar nanoregions Rowe-etal:1979 . In PMN and PMN-20%PT, Naberezhnov et al. and Koo et al.Naberezhnov-etal:1999 ; Koo-etal:2002 have reported broadening of the TA phonon starting at , and near the wavevector at which the TO phonon has been reported to disappear (“waterfall”) Gehring-etal . These authors have linked the onset of damping of the TA and the onset of birefringence at to the appearance of the polar nanoregions. However, both these results only indicate the appearance of local distortions and strain fields but do not provide information as to the possible polar character of these local distortions. In our measurements of 4.5%PT and 9%PT, damping of the TA phonon is seen to increase, starting at . It also starts at a large first and at smaller with decreasing temperature. In other words, we find that, at a given temperature, the larger the , the higher the damping. In fact, we do expect such a trend from the coupling to smaller distorted regions at higher temperatures and to larger and slower ones at lower temperatures. In fact, our results show that, in the temperature range , the correlation length follows a Curie-Weiss law, characteristic of a paraelectric state in which the polarization is completely dynamic. The polar nanoregions only appear in earnest at , which is also the temperature at which the dielectric constant begins to exhibit frequency dispersion, i.e. the relaxor behavior. As seen from Fig. 7 (a) for 4.5%PT, the phonon damping begins to increase at 500 K (i.e. at ) and = (2,-0.14,-0.14) (or 0.20 rlu), which corresponds to about 5 unit cells correlation at 500K . This result is consistent with the size of the polar regions derived from our diffuse neutron elastic scattering data (Table 3). Such an agreement provides evidence that the increase in TA phonon damping is connected to the appearance of the polar regions. The hypersonic damping properties studied by the Brillouin scattering has provided a clear indication of ferroelectric ordering in complex relaxor ferroelectric Tu-etal:1995 . In 9%PT, the TA phonon damping is lower than in 4.5%PT (bottom of Fig. 7) but shows a similar trend. It is important to note that the measured TA phonon corresponds to the C44 elastic modulus, which can couple to the reorientations of a strain field with rhombohedral symmetry between different [111] directions. The higher frequency of the TA phonon in 9%PT than in 4.5%PT (top of Fig. 7) indicates that C44 is higher in 9%PT. Both observations, lower damping and higher TA phonon frequency, suggest that, with increasing PT, the polar regions are less able to reorient and the lattice becomes more rigid. Further work is in progress on the TA phonons as well as on the low frequency rotational dynamics associated with the reorientation of the polar regions in single crystals of PZN-PT.
VI conclusions
Neutron elastic diffuse scattering in PZN, PZN-4.5%PT, and PZN-9%PT appears at temperatures well above the phase transition ( 700-600 K), marking the formation of local distortions at , which acquire a polar character at the lower temperature . In both pure PZN and PZN-PT, diffuse scattering is observed only around reciprocal lattice points with mixed parity indices, which is indicative of the rhombohedral internal symmetry of the polar nanoregions. From the orientation of the diffuse scattering ellipsoids around these points, it appears that, in PZN, the correlations preferentially develop along a diagonal or [111] direction. With increasing PT, these correlations shift towards a transverse direction, most likely [100], consistent with the widening of the tetragonal phase field for higher PT concentrations. Nonetheless, it is important to emphasize that, with the addition of PT, the internal structure of the polar regions remains rhombohedral. This distinction between the [111] distortion of the local unit cells and the [100] orientation of the correlations may constitute an essential feature of the Pb-relaxor ferroelectrics. Upon cooling, PZN and PZN-PT undergo three distinct stages: purely dynamic polarization about 700-600 K, reorienting polar regions and, finally, polar regions with fixed orientations due to freezing in pure PZN and phase transitions in PZN-PT. In the middle range, it appears that the reorienting polar regions couple to the TA phonons, leading to their softening and increased damping. Comparison of the phonon results with the temperature and dependence of the diffuse scattering results does indeed suggests that the TA broadening originates from the reorientation of strain fields associated with the polar nanoregions. This may be a common feature of many relaxor systems.
Acknowledgements.
This work was supported by DOE Grant No. DE-FG02-00ER45842 and ONR Grant No. N00014-99-1-0738 (Z.-G. Ye). We acknowledge the support of the NIST Center for Neutron Research as well as the Oak Ridge National Laboratory in providing the neutron facilities used in this work. One of the authors (D. La-Orauttapong) was supported by a Royal Thai Government scholarship during this work. It is pleasure to acknowledgment R.K. Pattnaik, S. A. Prosandeev, and O. Svitelskiy for helpful discussions.References
- (1) D. La-Orauttapong, J. Toulouse, J.L. Robertson, and Z.-G. Ye, Phys. Rev. B 64, 212101 (2001).
- (2) S.-E. Park and T.R. Shrout, J. Appl. Phys. 82, 1804 (1997).
- (3) D. Viehland, A. Amin, and J. F. Li, Appl. Phys. Lett 79, 1006 (2001).
- (4) J. Kuwata, K. Uchino, and S. Nomura, Ferroelectrics 37, 579 (1981).
- (5) T. Shrout, Z.P. Chang, N. Kim, and S. Markgraf, Ferroelectric Letters, 12, 63 (1990).
- (6) B. Noheda, D.E. Cox, G. Shirane. R. Guo, B. Jones and L.E. Cross, Phys. Rev. B 63, 014103 (2001).
- (7) D.E. Cox, B. Noheda, G. Shirane, Y. Uesu, K. Fujishiro, and Y. Yamada, Appl. Phys. Lett 79, 400 (2001).
- (8) D. La-Orauttapong, B. Noheda, Z.-G. Ye, P.M. Gehring, J. Toulouse, D.E. Cox, and G. Shirane, Phys. Rev. B 65, 144101 (2002).
- (9) B. Noheda, D.E. Cox, G. Shirane, J. Gao, and Z.-G. Ye, Phys. Rev. B 66, 054104 (2002).
- (10) H. Fu and R. Cohen, Nature 403, 281 (2000).
- (11) D. Vanderbilt and M. H. Cohen, Phys. Rev. B 63, 094108 (2001).
- (12) G. Burns and F.H. Dacol, Phys. Rev. B 28, 2527 (1983).
- (13) H. You and Q. M. Zhang, Phys. Rev. Lett. 79, 3950 (1997).
- (14) N. de Mathan, E. Husson, G. Calvarin, J. R. Gavarri, A.W. Hewat, and A. Morell, J. Phys.: Condens. Matter 3, 8159 (1991).
- (15) A. Naberezhnov, S. Vakhrushev, B. Dorner, D. Strauch, and H. Moudden, Eur. Phys. J. B 11, 13 (1999).
- (16) P.M. Gehring, S.-E. Park, and G. Shirane, Phys. Rev. Lett. 84, 5216 (2000), P.M. Gehring, S.-E. Park, and G. Shirane, Phys. Rev. B 63, 224109 (2001), P.M. Gehring, S. Wakimoto, Z.-G. Ye, and G. Shirane, Phys. Rev. Lett. 87, 277601 (2001), and S. Wakimoto, C. Stock, R. J. Birgeneau, Z.-G. Ye, W. Chen, W. J. L. Buyers, P. M. Gehring, and G. Shirane, Phys. Rev. B 65, 172105 (2002).
- (17) Y.Yokomizo, T. Takahashi, and S. Nomura, J. Phys. Soc. Jpn. 28, 1278 (1970).
- (18) C.A. Randall and A.S. Bhalla, Jpn. J. Appl. Phys. Part 1 29, 327 (1990).
- (19) L. Zhang, M.Dong, and Z.-G. Ye, Mater. Sci. Eng. B 78, 96 (2000).
- (20) W. Chen and Z.-G. Ye, J. Mater. Sci. 36, 4393 (2001).
- (21) T.-Y. Koo, P.M. Gehring, G. Shirane, V. Kiryukhin, G. Lee, and S.-W. Cheong, Phys. Rev. B 65, 144113 (2002).
- (22) S. B. Vakhrushev, A. A. Naberezhnov, N. M. Okuneve, and B. N. Savenko, Phys. Solid State 37 (12), 1993 (1995).
- (23) J. Harada, J. D. Axe, and G. Shirane, Acta Crystallogr., Sect. A: Cryst. Phys., Diffr., Theor. Gen. Crystallogr. 26, 608 (1970).
- (24) 1 reciprocal lattice unit (rlu) along [011] = rlu = ( = 2.19 and 1 reciprocal lattice unit (rlu) along [111] = rlu = ( = 2.68 .
- (25) G. Yong, J. Toulouse, R. Erwin, S. Shapiro, and B. Hennion, Phys. Rev. B 62, 14736 (2000) and Toulouse et al. (in preparation).
- (26) K. Hirota, Z.-G. Ye, S. Wakimoto, P.M. Gehring, and G. Shirane, Phys. Rev. B 65, 104105 (2002).
- (27) J. M. Rowe, J. J. Rush, D. G. Hinks, and S. Susman, Phys. Rev. Lett. 43, 1158 (1979).
- (28) According to (see also Ref. rlu ), one obtains a value of 20 , or about 5 unit cells.
- (29) C.-S. Tu, V. Hugo Schmidt, and I. G. Siny, J. Appl. Phys. 78, 5665 (1995).