Anisotropic Elastic Properties of CeRhIn5
Abstract
The structure of the quasi two dimensional heavy fermion antiferromagnet CeRhIn5 has been investigated as a function of pressure up to 13 GPa using a diamond anvil cell under both hydrostatic and quasihydrostatic conditions at room ( K) and low ( K) temperatures. Complementary resonant ultrasound measurements were performed to obtain the complete elastic moduli. The bulk modulus ( GPa) and uniaxial compressibilities ( GPa-1 and GPa-1) found from pressure-dependent x-ray diffraction are in good agreement with the ultrasound measurements. Unlike doping on the Rh site where increases linearly with the ratio of the tetragonal lattice parameters no such correlation is observed under pressure; instead, a double peaked structure with a local minimum around 4-5 GPa is observed at both room and low temperatures.
pacs:
61.10.Nz,62.50.+p,51.35.+a, 71.27.+a,74.70.TxDate text]date
I Introduction
Ce based heavy fermion (HF) antiferromagnetic (AF) compounds have been the subject of intensive investigations due to their unconventional magnetic and superconducting properties. In these compounds the electronic correlations, the magnetic ordering temperature and the crystal field effects are sensitive to pressure, and pressure induced superconductivity has been observed in a variety of compounds such as CePd2Si2, CeCu2Ge2, CeRh2Si2 and CeIn3 Steglich et al. (1979); Jaccard et al. (1992); Movshovich et al. (1996); Grosche et al. (1996); Mathur et al. (1998); Hegger et al. (2000). The appearance of superconductivity in these systems and the deviation from Fermi liquid behavior as a function of pressure are still challenging problems to be studied. Recently, HF systems with the formula CeIn5 ( Co and Ir) have been reported to become superconductors at ambient pressure Petrovic et al. (2001a, b), while CeRhIn5 is an antiferromagnet at ambient pressure ( K and mJ/mol K2 ). These compounds crystallizes in the HoCoGa5 structure with alternating stacks of CeIn3 and In2 along the axis. Thermodynamic Cornelius et al. (2000), NQR Curro et al. (2000), and neutron scattering Bao et al. (2000) experiments all show that the electronic and magnetic properties of CeRhIn5 are anisotropic in nature. The AF ordering in CeRhIn5 is suppressed with applied pressure and superconductivity is observed at 1.6 GPa with K. Like CeIn3 the bulk nature of the SC state in CeRhIn5 has been unambiguously established under pressure. The AF state is suppressed at a pressure of around 1.2 GPa and coexists over a limited pressure range with the superconducting (SC) state Hegger et al. (2000); Fisher et al. (2002); Mito et al. (2001).
The value of in magnetically mediated superconductors is believed to be dependent on dimensionality in addition to the characteristic spin fluctuation temperature. Theoretical models and experimental results suggest that SC state in CeRhIn5 may be due to the quasi-two dimensional (2D) structure and anisotropic AF fluctuations which are responsible for the enhancement of relative to CeIn3Pagliuso et al. (2002); Monthoux and Lonzarich (2001). A strong correlation between the ambient pressure ratio and in the CeIn5 compounds is indicative of the enhancement of the superconducting properties by lowering dimensionality (increasing increases ) Pagliuso et al. (2002). In order to explain the evolution of superconductivity induced by pressure and the suppression of AF ordering, it is important to probe the effect of pressure on structure for this compound and look for possible correlations between structural and thermodynamic properties.
Here we report on high pressure x-ray diffraction measurements performed on CeRhIn5 up to 13 GPa at high ( K) and low ( K) temperatures under both hydrostatic and quasihydrostatic conditions. As the measured linear compressibilities are similar for both the and directions, the results for all pressure measurements, both hydrostatic and quasihydrostatic, are similar. The elastic properties obtained from the high pressure measurements are compared to the full set of elastic constants obtained from resonant ultrasound (RUS) measurements, and excellent agreement is found in the measured bulk modulus ( GPa) from both techniques. We find no direct correlation between and as a function of pressure. Rather, a double peaked structure with a local minimum around 4-5 GPa is observed for at both room and low temperatures.
II Experiment
CeRhIn5 single crystals were grown by a self flux technique Moshopoulou et al. (2001). The single crystals were crushed into powder and x-ray diffraction measurements show the single phase nature of the compound. In agreement with previous results Moshopoulou et al. (2001), the crystals were found to have tetragonal symmetry with cell parameters Å, Å.
The high pressure x-ray diffraction (XRD) experiments were performed using a rotating anode x-ray generator (Rigaku) for Runs 1-4 ( =0.7093 Å) and synchrotron x-rays at HPCAT ( =0.4218 Å), Sector 16 at the Advanced Photon Source for Run 5 and the low temperature measurement. The sample was loaded with NaCl or MgO powder as a pressure calibrant and either a 4:1 Methanol ethanol mixture (hydrostatic) or NaCl (quasihydrostatic) as the pressure transmitting medium in a Re gasket with a m diameter hole. High pressure was achieved using a Merrill-Basset diamond anvil cell with m culet diameters. The XRD patterns are collected using an imaging plate ( mm2 ) camera with m2 pixel dimensions. XRD patterns were collected up to 13 GPa at room ( K) and low (down to K) temperatures. The low temperature measurements were made in a continuous flow cryostat. The images were integrated using FIT2D software Hammersley et al. (1996). The structural refinement of the patterns was carried out using the Rietveld method on employing the FULLPROF and REITICA (LHPM) software packages Rodriguez-Carvajal (1993). The RUS technique is described in detail elsewhere Migliori et al. (1993); Migliori and Sarrao (1997).
By measuring the resonant frequencies of a well aligned single crystal of CeRhIn5, we can determine the full set of room temperature elastic constants. This will give the adiabatic bulk modulus rather than the isothermal bulk modulus found in the pressure measurements.
III Results and Discussion
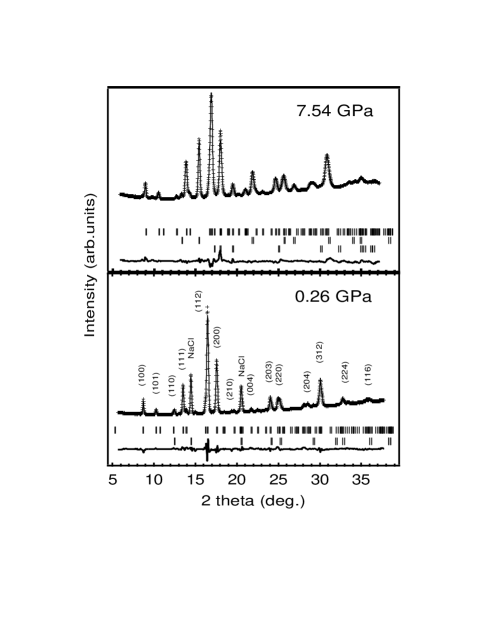
In Fig. 1 we show the XRD patterns for CeRhIn5 obtained at two different quasihydrostatic pressures with NaCl used as the pressure transmitting media. The raw data (crosses), Rietveld fit to the data (solid line through the data points), fit reflections (vertical lines) and the difference between the fit and experiment (solid line near bottom) are all shown. Fig. 2
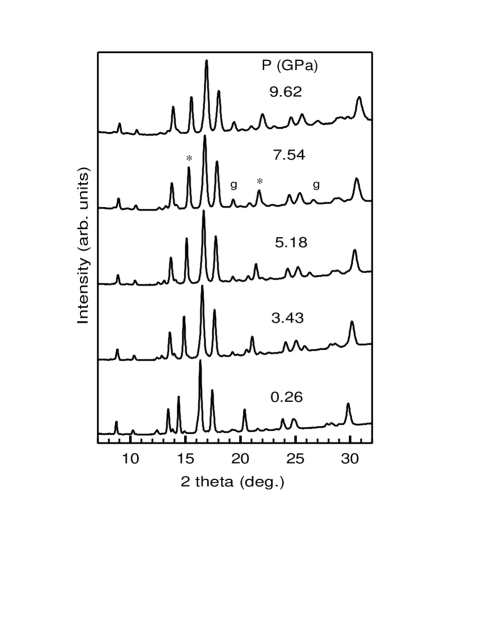
shows the diffraction data at five different pressures. Diffraction peaks from the Re gasket (labeled g), NaCl (labeled *) and CeRhIn5 (no label) are all observed in Fig. 2. The known equation of state for NaCl Brown (1999) or the standard ruby fluorescence technique Piermarini et al. (1975) was used to determine the pressure. The refinement of the CeRhIn5 XRD patterns was performed on the basis of the P4/mmm space group (No. 123). The HoCoGa5 structure in which CeRhIn5 crystallizes contains layers of cubo-octohedra of the structural type of AuCu3 and layers of PtHg2 structure type. The unit cell consists of Ce atoms situated at the corners and In atoms at two inequivalent sites. In1 is surrounded by Ce and located at the top and bottom faces while In2 is stacked between Ce-In and Rh layers. The hybrid structure is related to both CeIn3 and Ce2RhIn8. When comparing the crystallographic data and bulk modulus of CeIn3 it is evident that the Ce atom in CeRhIn5 experiences a chemical pressure of 1.4 GPa at ambient conditions Hegger et al. (2000); Cornelius et al. (2000).
The results of the Rietveld refinement at different pressures have been listed in Table 1.
| 1.47 GPa | 3.97 GPa | 5.18 GPa | 7.54 GPa | |
| (Å) | 4.6263(3) | 4.5718(3) | 4.5712(3) | 4.5298(3) |
|---|---|---|---|---|
| (Å) | 7.505(1) | 7.409(1) | 7.396(1) | 7.337(1) |
| In2 () | 0.3036(3) | 0.3049(4) | 0.3089(3) | 0.3058(3) |
| (Å2) | 0.3(1) | 0.5(2) | 0.3(1) | 0.5(1) |
| (Å2) | 0.9(1) | 1.3(3) | 1.0(2) | 1.7(1) |
| (Å2) | 1.7(2) | 3.8(4) | 1.4(3) | 1.4(2) |
| (Å2) | 1.4(1) | 1.3(1) | 1.2(1) | 0.80(7) |
| (%) | 2.1 | 2.6 | 2.5 | 2.1 |
| (%) | 3.0 | 3.8 | 3.5 | 3.0 |
During the refinement, a total of nineteen parameters have been optimized which include the background, scale factors, lattice parameters, profile parameters, temperature factors, zero point shift parameter and atomic coordinate. Initially the refinement has been started for two phases in most cases including the pressure calibrant, and at higher pressures an additional phase for the gasket has been added. At higher pressures, considerable changes in the isotropic temperature factors are observed for In1, In2 and Rh during the refinement.
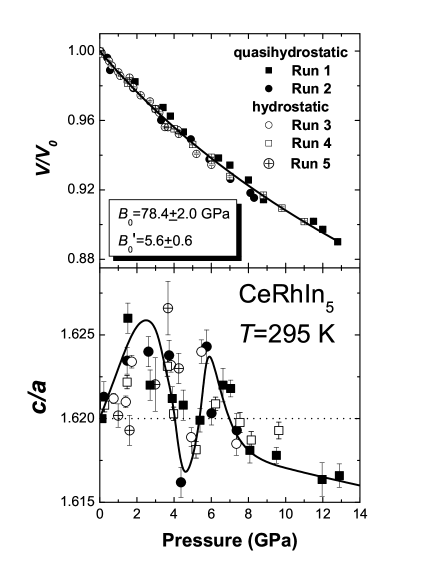
The data has been plotted for CeRhIn5 for quasihydrostatic (Run 1 and Run 2) and hydrostatic (Runs 3-5) measurements in Fig. 3. Since the maximum volume compression is only of the order of 10%, the data has been fit using a least squares fitting procedure to the second order Murnaghan equation of state
| (1) |
For the room temperature ( K) data in Fig. 3, we find GPa and . The RhIn2 layers in CeRhIn5 appear to stiffen the structure relative to CeIn3 which has a smaller bulk modulus ( GPa) Vedel et al. (1987). The bulk modulus value compares well with the values reported for other HF systems Penney et al. (1982); Spain et al. (1986); Kutty and Vaidya (1987); Wassilew-Reul et al. (1997). Fig. 3 also shows the ratio of the lattice constants as a function of pressure. For all of the measurements, there appears to be a double peak structure with a local minimum around 4-5 GPa. Note that the istropic thermal paramaters for the In sites, in particular the In1 site, have their largest values around 4 GPa. The initial values of the linear compressibilities (average values from the hydrostatic measurements for GPa) are GPa-1 and GPa-1. The similarity between the measured values of and are likely the reason that no discernible difference is found for the hydrostatic and quasihydrostatic cases. The data shows that the system retains its crystal structure up to the pressure limit (13 GPa) investigated.
We have also investigated the behavior at low temperature K). As the superconducting transition has a maximum around 2 K, it is desirable to obtain structural data in the low temperature regime when trying to correlate superconductivity to structural measurements. The results for a single hydrostatic measurement at 10 K is shown in Fig. 4.
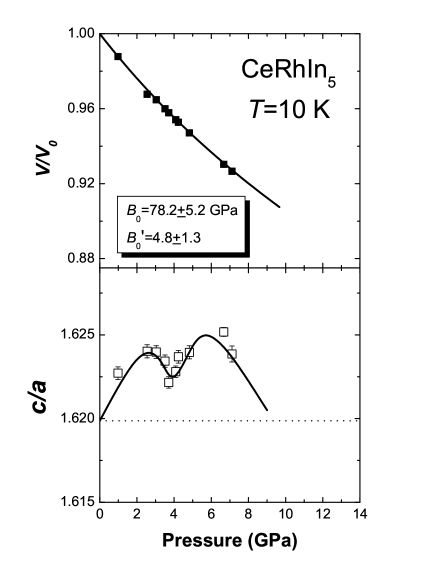
The value of GPa is identical to the room temperature value within the experimental uncertainty. Though the lattice does contract at ambient pressure as temperature is lowered which would lead to a higher bulk modulus, the expected change is within our experimental uncertainty. The variation of as a function of pressure again shows a double maximum structure at low temperature in a manner similar to the room temperature data.
As mentioned, a strong correlation between the ambient pressure ratio and in the CeIn5 compounds has been observed (increasing increases ) Pagliuso et al. (2002). To further investigate the variation of with pressure and temperature, we plot the value of as a function of temperature at GPa in Fig. 5.
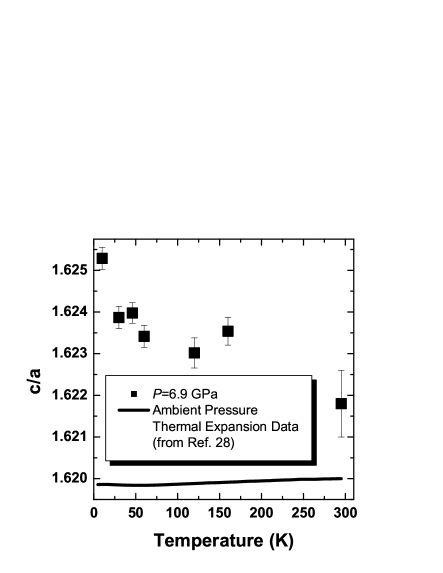
As can be seen, there is a significant enhancement of at 6.9 GPa relative to the ambient pressure thermal expansion data of Takeuchi et al.Takeuchi et al. (2001) Unlike the ambient pressure data, appears to increase as temperature is lowered at 6.9 GPa. Taken as a whole, the current results seem to show no direct correlation between the values of and under pressure. However, the value of () where has its maximum around 2.5 GPa is consistent with a correlation between the room temperature value of and for various CeIn5 compounds.Pagliuso et al. (2002) This leads to the natural conclusion that hybridization effects are likely the driving force behind the observed behavior in CeRhIn5. We will discuss this in further detail later.
The complete set of elastic constants were measured using the RUS technique and the results are shown in Table 2.
| Elastic Constant | Value (GPa) |
|---|---|
| 146.7 | |
| 45.8 | |
| 43.4 | |
| 141.4 | |
| 54.0 | |
| 41.8 | |
| Moduli | Value (GPa) |
| (RUS) | 82.5 |
| (RUS) | 43.2 |
| () | 78.4 |
| Compressibilities | Value (GPa-1) |
| (RUS) | |
| (RUS) | |
| () | |
| () |
The values of the adiabatic compressibility tetragonal shear modulus , and linear compressibilities (, ) can be calculated from the measured elastic constants Boettger (1997) and are given by
| (2) |
and
| (3) |
The results are displayed in Table 2. The value of is slightly larger than the isothermal value obtained from the pressure measurements. This is to be expected as the ratio , where K-1 is the volume thermal expansion coefficient Takeuchi et al. (2001) and is the thermal Gruneisen parameter which is typically of the order of unity. At room temperature then, one then expects which is in reasonable agreement with our experimental value of .
In all of the measurements, the ratio is found to have a double peaked structure. As mentioned previously, the hybridization between the Ce 4f electrons and the conduction electrons should mainly depend on the distance between Ce and its nearest neighbors. In fact, a simple model to estimate the hybridization by means of a tight-binding calculation shows that the hybridization should have the relatively strong dependence for hybridization between f and d electrons, where is the distance between the atoms containing the d and f electrons (in our case, this would be Rh and Ce respectively) Harrison (1983); Endstra et al. (1993).
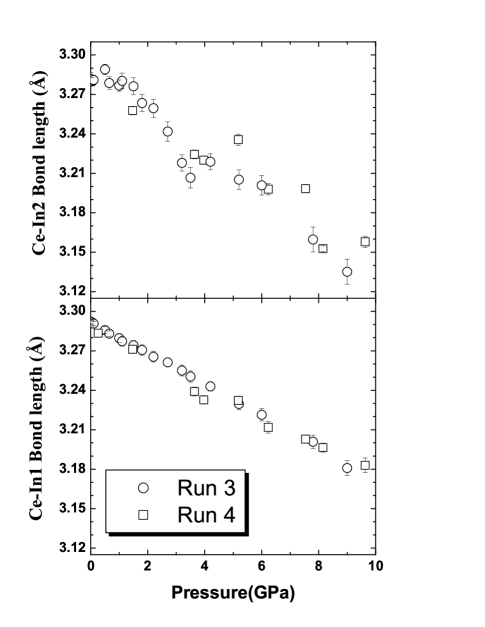
To examine the pressure dependence of , the Ce-In1 and Ce-In2 bond lengths are plotted in Fig. 6 for the hydrostatic measurements. The Ce-In1 bond is less compressible than the Ce-In2 bond. The Ce-In2 data appears to display plateaus between 0-2 and 3-5 GPa. The structural results may be compared with the high pressure resistivity experimental data reported for CeRhIn5 Hegger et al. (2000); Muramatsu et al. (2001). First, the temperature corresponding to the maximum in the resistivity, often taken to be a measure of the Kondo temperature is seen to initially decrease in CeRhIn5 in contrast to the usually observed behavior Thompson (1993). One possible explanation for this effect could lie in an initial increase in the Ce-In2 bond length causing an anomalous initial decrease in the hybridization. Whereas the plot of Ce-In1 bond length with pressure shows a gradual decrease with increasing pressure. Our data is not sufficient to make any definite conclusions along these lines. The smooth decrease in the Ce-In1 bond length would lead one to expect the typical inverse parabolic dependence consistent with theoretical calculations Monthoux and Lonzarich (2001), measurements on CeRhIn5 Hegger et al. (2000); Muramatsu et al. (2001) and most heavy fermion superconductors Movshovich et al. (1996); Grosche et al. (1996); Mathur et al. (1998).
IV Conclusions
We have studied the elastic properties of the heavy fermion system CeRhIn5 using resonant ultrasound and hydrostatic and quasihydrostatic pressures up to 13 GPa using x-ray diffraction. The bulk modulus ( GPa) and uniaxial compressibilities ( GPa-1 and GPa-1) found from pressure-dependent x-ray diffraction are in good agreement with the ultrasound measurements. Unlike doping experiments which hint at a strong correlation between the ratio and , pressure shows no such correlation as a double peaked structure with a local minimum around 4-5 GPa is found at 295 K and 10 K.
Acknowledgements.
We thank Maddury Somayazulu, Beam Line Scientist at HPCAT for assistance on the low temperature, high pressure diffraction measurements. Work at UNLV is supported by DOE EPSCoR-State/National Laboratory Partnership Award DE-FG02-00ER45835. Work at LANL is performed under the auspices of the U.S. Department of Energy. HPCAT is a collaboration among the UNLV High Pressure Science and Engineering Center, the Lawrence Livermore National Laboratory, the Geophysical Laboratory of the Carnegie Institution of Washington, and the University of Hawaii at Manoa. The UNLV High Pressure Science and Engineering Center was supported by the U.S. Department of Energy, National Nuclear Security Administration, under Cooperative Agreement DE-FC08-01NV14049. Use of the Advanced Photon Source was supported by the U. S. Department of Energy, Office of Science, Office of Basic Energy Sciences, under Contract No. W-31-109-Eng-38.References
- Steglich et al. (1979) F. Steglich, J. Aarts, C. D. Bredl, W. Lieke, D. Meschede, W. Franz, and H. Schäfer, Phys. Rev. Lett. 43, 1892 (1979).
- Jaccard et al. (1992) D. Jaccard, K. Behina, and J. Sierro, Phys. Lett. A 163, 475 (1992).
- Movshovich et al. (1996) R. Movshovich, T. Graf, D. Mandrus, J. D. Thompson, J. L. Smith, and Z. Fisk, Phys. Rev. B 53, 8241 (1996).
- Grosche et al. (1996) F. M. Grosche, S. R. Julian, N. D. Mathur, and G. G. Lonzarich, Physica B 223-224, 50 (1996).
- Mathur et al. (1998) N. D. Mathur, F. M. Grosche, S. R. Julian, I. R. Walker, D. M. Freye, R. K. Haselwimmer, and G. G. Lonzarich, Nature 394, 39 (1998).
- Hegger et al. (2000) H. Hegger, C. Petrovic, E. G. Moshopoulou, M. F. Hundley, J. L. Sarrao, Z. Fisk, and J. D. Thompson, Phys. Rev. Lett. 84, 4986 (2000).
- Petrovic et al. (2001a) C. Petrovic, P. G. Pagliuso, M. F. Hundley, R. Movshovich, J. L. Sarrao, J. D. Thompson, Z. Fisk, and P. Monthoux, J. Phys.:Condens. Matter 13, L337 (2001a).
- Petrovic et al. (2001b) C. Petrovic, R. Movshovich, M. Jaime, P. G. Pagliuso, M. F. Hundley, J. L. Sarrao, Z. Fisk, and J. D. Thompson, Europhys. Lett. 53, 354 (2001b).
- Cornelius et al. (2000) A. L. Cornelius, A. J. Arko, J. L. Sarrao, M. F. Hundley, and Z. Fisk, Phys. Rev. B 62, 14181 (2000).
- Curro et al. (2000) N. J. Curro, P. C. Hammel, P. G. Pagliuso, J. L. Sarrao, J. D. Thompson, and Z. Fisk, Phys. Rev. B 62, R6100 (2000).
- Bao et al. (2000) W. Bao, P. G. Pagliuso, J. L. Sarrao, J. D. Thompson, Z. Fisk, J. W. Lynn, and R. W. Erwin, Phys. Rev. B 62, R14621 (2000).
- Fisher et al. (2002) R. A. Fisher, F. Bouquet, N. E. Phillips, M. F. Hundley, P. G. Pagliuso, J. L. Sarrao, Z. Fisk, and J. D. Thompson, Phys. Rev. B 65, 224509 (2002).
- Mito et al. (2001) T. Mito, S. Kawasaki, G. q. Zheng, Y. Kawasaki, K. Ishida, Y. Kitaoka, D. Aoki, Y. Haga, and Y. Onuki, Phys. Rev. B 63, 220507(R) (2001).
- Pagliuso et al. (2002) P. G. Pagliuso, R. Movshovich, A. D. Bianchi, M. Nicklas, N. O. Moreno, J. D. Thompson, M. F. Hundley, J. L. Sarrao, and Z. Fisk, Physica B 312-313, 129 (2002).
- Monthoux and Lonzarich (2001) P. Monthoux and G. G. Lonzarich, Phys. Rev. B 63, 054529 (2001).
- Moshopoulou et al. (2001) E. G. Moshopoulou, Z. Fisk, J. L. Sarrao, and J. D. Thompson, J. Solid State Chem. 158, 25 (2001).
- Hammersley et al. (1996) A. P. Hammersley, S. O. Svensson, M. Hanfland, A. N. Fitch, and D. Haüsermann, High Pressure Research 14, 235 (1996).
- Rodriguez-Carvajal (1993) J. Rodriguez-Carvajal, Physica B 192, 55 (1993).
- Migliori et al. (1993) A. Migliori, J. L. Sarrao, W. M. Visscher, T. M. Bell, M. Lei, Z. Fisk, and R. G. Leisure, Physica B 183, 1 (1993).
- Migliori and Sarrao (1997) A. Migliori and J. L. Sarrao, Resonant Ultrasound Spectroscopy (John Wiley and Soncs, Inc., New York, 1997).
- Brown (1999) J. M. Brown, J. Appl. Phys. 86, 5801 (1999).
- Piermarini et al. (1975) G. J. Piermarini, S. Block, J. D. Barnett, and R. A. Forman, J. Appl. Phys. 46, 2774 (1975).
- Vedel et al. (1987) I. Vedel, A. M. Redon, J. M. Mignot, and J. M. Leger, J. Phys. F: Metal Phys. 17, 849 (1987).
- Penney et al. (1982) T. Penney, B. Barbara, T. S. Plaskett, H. E. J. King, and S. J. LaPlaca, Solid State Commun. 44, 1199 (1982).
- Spain et al. (1986) I. L. Spain, F. Steglich, U. Rauchschwalbe, and H. D. Hochheimer, Physica B 139-140, 449 (1986).
- Kutty and Vaidya (1987) A. P. G. Kutty and S. N. Vaidya, in Theoretical and Experimental Aspect of Valence Fluctuations and Heavy Fermions, edited by L. C. Gupta and S. K. Malik (Plenum, New York, 1987), p. 621.
- Wassilew-Reul et al. (1997) C. Wassilew-Reul, M. Kunz, M. Hanfland, D. Haüsermann, C. Geibel, and F. Steglich, Physic B 230-232, 310 (1997).
- Takeuchi et al. (2001) T. Takeuchi, T. Inoue, K. Sugiyama, D. Aoki, Y. Tokiwa, Y. Haga, K. Kindo, and Y. Onuki, J. Phys. Soc. Jpn. 70, 877 (2001).
- Boettger (1997) J. C. Boettger, Phys. Rev. B 55, 750 (1997).
- Harrison (1983) W. A. Harrison, Phys. Rev. B 28, 550 (1983).
- Endstra et al. (1993) T. Endstra, G. J. Nieuwenhuys, and J. A. Mydosh, Phys. Rev. B 48, 9595 (1993).
- Muramatsu et al. (2001) T. Muramatsu, N. Tateiwa, T. C. Kobayashi, A. Shimizu, K. Amaya, D. Aoki, H. Shishido, Y. Haga, and Y. Onuki, J. Phys. Soc. Jpn. 70, 3362 (2001).
- Thompson (1993) J. D. Thompson, Physica B 190, 61 (1993).