Periodic Density of States Modulations in Superconducting
Abstract
In this paper we show, using scanning tunneling spectroscopy (STS), the existence of static striped density of electronic states in nearly optimally doped in zero field. The observed modulation is strongest at roughly half the superconducting gap energy and is aligned with the Cu-O bonds, with a periodicity of four lattice constants, exhibiting features characteristic of a two-dimensional system of line objects. These features also exhibit asymmetries between the two orthogonal directions locally, pointing to a possible broken symmetry state (i. e., stripe phase). We further show that the density of states modulation manifests itself as a shift of states from above to below the superconducting gap. The fact that a single energy scale (i. e., the gap) appears for both superconductivity and stripes suggests that these two effects have the same microscopic origin.
pacs:
PACS numbers: 74.72.Hs, 74.50.+r, 74.25.-qI INTRODUCTION
One of the most important problems for condensed matter physics is the determination of the ground states of strongly correlated electron systems. In particular, high-temperature superconductors (HTSC) appear to have unusual ground states because of strong electronic correlations. Theoretical zaanen ; ek1 ; ek2 ; polkovnikov ; zaanen1 ; white and experimental tranquada ; lake ; lake1 ; yslee ; mitrovic ; hoffman ; khaykovich ; zhou evidence has been mounting in support of the possibility that their ground state exhibits spin and charge density waves (SDW and CDW), which are primarily one-dimensional (i. e., stripes) and which either compete with or promote superconductivity. Coexistence of CDW or SDW and superconductivity has previously been reported in the lower materials tranquada ; lake ; lake1 ; khaykovich ; zhou ; yslee and in the presence of large magnetic fields mitrovic ; hoffman .
In inelastic neutron scattering experiments on near optimum doping (x=0.163), and in the presence of a magnetic field, Lake et al. lake ; lake1 found strong scattering peaks at the four -space points: ()[(1/2,1/2) (0,1/2)] and ()[(1/2,1/2) (1/2,0)], where and is the lattice constant. This implies a spin-density of periodicity , which the authors find extends to more than 50, much beyond the vortex core. Also, Mitrovic et al. mitrovic reported similar periodicity in a high-field NMR imaging experiment. Using STM, Hoffman et al. hoffman reported scanning tunneling spectroscopy on single crystals revealing a checkerboard of quasiparticle states with four unit-cell periodicity surrounding vortex cores. In -space this corresponds to Bragg peaks in the local density of states at (2)(1/4,0) and (2)(0,1/4). This structure was found around the energy (7 meV) of a feature previously observed in the spectra of vortices in the same field range renner2 ; pan2 . The checkerboard structure extends over , again indicating ordering outside the vortex cores demler .
The absence of data showing stripes in the higher materials in zero field has lent support to the idea that stripes are competing with high temperature superconductivity. However, we showedhowald , using scanning tunneling spectroscopy (STS), a first indication of the existence of static striped density of electronic states in nearly optimally doped in zero field. This modulation is aligned with the Cu-O bonds, with a periodicity of four lattice constants, and exhibits features characteristic of a two-dimensional system of line objects. We further showed that the density of states modulation manifests itself as a shift of states from above to below the superconducting gap. The fact that a single energy scale (the gap) appears for both superconductivity and stripes suggests that these two effects have the same origin. In the present paper we expand on our initial results, studying further the energy dependence of the modulation and its interrelation with quasiparticle scattering. Our main result in the present paper is that the four-period peaks in the Fourier transform of the data are present at all energies, including very low energies. At the same time, peaks at other -vectors appear at higher energies, suggesting the contribution of quasiparticle-like scattering from impurities, as suggested by Wang and Lee wanglee . The two effects are separable, suggesting that a simple model of two-dimensional band electrons cannot explain all the observed physics, corroborating the photoemission findings on the same system bogdanov ; bogdanov1 ; kaminski .
II EXPERIMENTAL
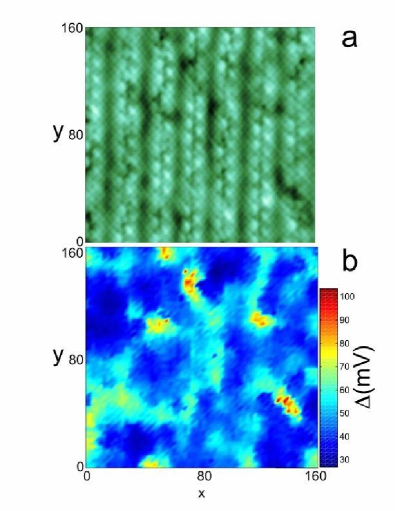
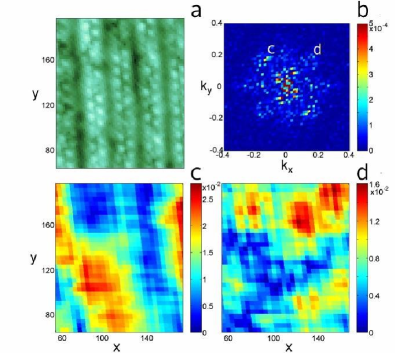
STS allows one to measure, on an atomic scale, the electronic density of states. This measurement of the local density of states (LDOS) makes STS a powerful tool for investigating correlated electron systems. In this study we used because it has a high (90 K), and since it cleaves easily, yielding large, stable, atomically flat surfaces. The single crystals of used in this study, grown by a floating-zone method, were annealed to be slightly overdoped, yielding a superconducting transition temperature of 86 K. The samples were cleaved (between the BiO planes) at room temperature in a vacuum of better than torr, then transferred in less than one minute to the low-temperature STM, where cryopumping yields orders of magnitude better vacuum. Data were taken at 8 K with an iridium tip at a sample bias of -200 mV and a setpoint current of -100 pA. The choice of setpoint establishes the relatively arbitrary normalization condition for the raw differential conductance (dI/dV), which is proportional to the local density of states. The data sets used in this paper consist of pixel images with dI/dV spectra taken at each point. In addition, we took pixel topographic scans over the same areas. Fig. 1a shows the topography of a typical area: the surface exhibits clear atomic resolution. In particular, the superstructure in the BiO plane kirk with average periodicity 27 Å(as well as the location of the individual Bi atoms) is evident in all scans and provides a reference direction for our study. As reported earlier howald1 ; pan1 ; lang , all samples also exhibit strong inhomogeneity in the local spectroscopy. This manifests itself here as large variation in the superconducting gap size (), as measured by the location of the peak in the local density of states (Fig. 1b). Overall the spectra evolve from small superconducting gaps ( mV) to very large gaps ( mV) with much reduced coherence peaks reminiscent of the pseudogap loeser ; renner1 ; howald1 .
III RESULTS AND ANALYSIS
III.1 Fourier Analysis
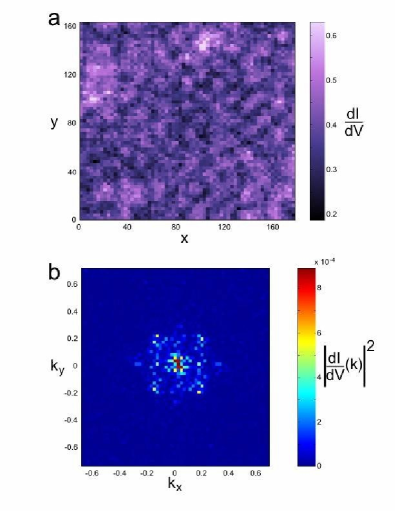
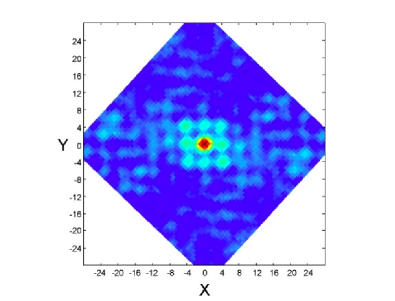
Fig. 2a shows a map of the LDOS for 15 mV sample bias. While there are some features in the real-space image, they are more readily observed in Fourier space sprunger . Therefore, we will focus for the moment on Fig. 2b, which shows the power spectrum, namely the amplitude squared of the Fourier transform, of the data in Fig. 2a. Fig. 2b exhibits a large amount of weight at small wavevectors, coming mostly from the random contributions of the inhomogeneous gap. In addition, there are two bright peaks appearing along the direction which originate from the superstructure. Finally, Fig. 2b clearly shows four peaks, oriented 45 degrees to the superstructure and at points corresponding to, within experimental uncertainty, periodicities of (, 0) and (0, ), oriented along the copper-oxygen bonds. The real-space data (Fig. 2a) show a two-dimensional pattern in the LDOS that is oriented along the diagonals; however, as is evident from Fig. 2b, contributions from features at other wavelengths obscure this modulation. The period of the modulation is shown clearly in Fig. 3, the autocorrelation function of Fig. 2a. This figure has been rotated approximately 45 degrees clockwise from Fig. 2a to place the copper-oxygen-copper directions horizontally and vertically. The maxima are separated by . The apparent rhombic distortion of the central nine maxima comes from the near coincidence of the upper left and low right corners with the superstructure period, which moves these maxima to slightly larger distances.
In order to further elucidate the spatial structure of the observed modulation, we can filter from Fig. 2b the contributions to the LDOS modulation that are far away from the (2)(1,0) and (2)(0,1) points. In general, filtering in reciprocal space is performed by multiplying the complex two-dimensional Fourier transform of the real space image with a real filter mask and subsequently calculating the inverse transform. The filter mask must be a symmetric function with respect to k=0. In order to avoid artifacts, one should take care that there is little weight around the edges of the filter, and that the edges of the filter are not particularly sharpbriner . In addition, examination of the resulting image for a variety of widths can show whether artifacts are important since the wavevector of such artifacts will depend on the sizes of the filter. For our data, we have chosen a radial Gaussian mask function with radius centered around the four-period points. Obviously such a procedure will pick out a preferred wavelength; its validity here rests on the observation of relatively large weight in these regions in the raw power spectrum, and the relatively small weight at the filter edges. This procedure is hardly novel: similar Fourier filtering was successfully used to remove the topographic background in order to enhance the Friedel oscillations friedel of Be(100) STM images briner , for example.
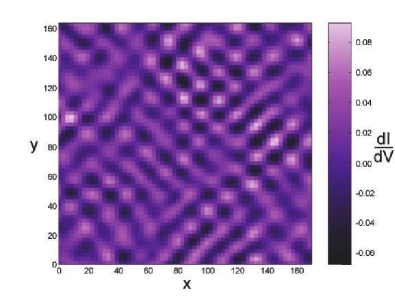
Fig. 4 shows the real-space data after such Fourier filtering with a standard Gaussian filter function using = (2). Varying the width of this filter has no qualitative effect on the resulting image, and the size of the above filter implies about 30 pixels within the FWHM around the center of each Bragg-spot. The modulation partially visible in Fig. 2b is now clear: Fig. 4 shows a dominant four-period modulation of the density of states that is almost checkerboard like, but with defects characteristic of a two-dimensional four-fold structure. In particular we observe dislocations in the form of extra half-rows. These defects locally increase or decrease the periodicity. From the separation of the defects in this map we estimate the correlation length to be .
The defects noted above in Fig. 4 can also explain the weight distribution of the four-period peak in the Fourier-transform. Given the approximately 80 Åcorrelation length of the modulation, we would expect a peak width of about . However, because the transform is taken over an area that is only about two correlation lengths wide, we expect to see contributions at only some of the wavevectors in this region. Since any dislocation alters the local periodicity of the checkerboard, we see a number of peaks at positions near . Assuming that these reflect a single peak broadened by the finite correlation length, we therefore place the peak at .
III.2 Energy Dependence
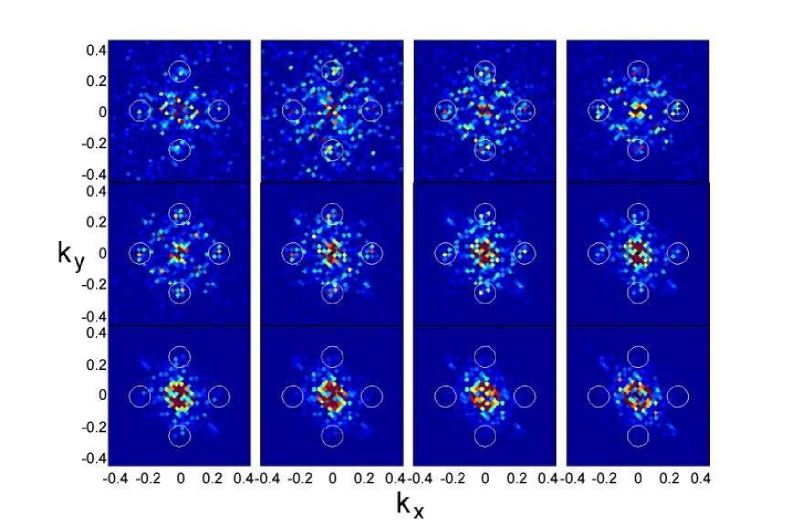
To further understand the nature of the modulation near , we studied the energy dependence of the effect. Fig. 5 shows the power spectra of the conductance over this area for a number of voltages. As above, the axes have been rotated to place the Cu-O-Cu directions parallel to the axes. For all sub-gap energies, there is significant weight in the vicinity of the points, as shown by the circles. However, the small wavevector (long wavelength) contributions increase with increasing energy, up to the nominal gap size, as we would expect from the spatial variation in gap size. This means that the points are most relatively prominent for lower energies.
The four-period peaks are not the only features observed in the power spectra. Also evident are the superstructure points at . In addition, for most energies one can see faint second-order superstructure spots. Curiously, there also appear spots perpendicular to the superstructure at the points , which do not appear to disperse with energy. Finally, while there is a significant weight at many wave vectors within the box bounded by the points, there is, with the exception of the second order superstructure spots, essentially no weight outside of it.
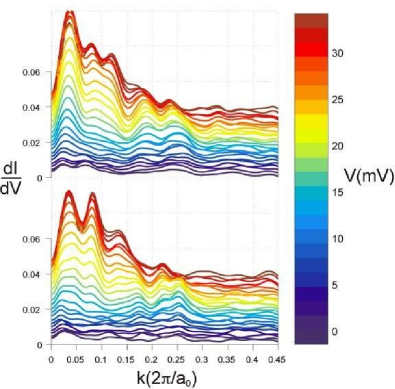
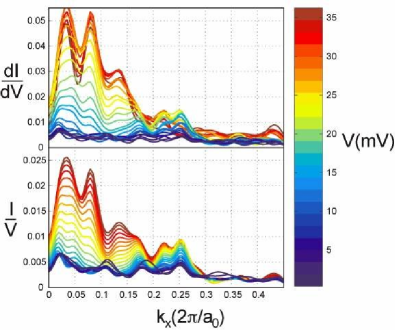
Fig. 6 shows a number of line cuts along the and directions. Each curve shows the magnitude of the Fourier transform along the Cu-O-Cu direction for a different energy. The curves have been computed by Gaussian averaging in the vicinity of the desired point with a FWHM of one pixel width to remove pixel size artifacts and account for the (small) uncertainty in knowing the Cu-O-Cu direction. The peaks around show up at all these sub-gap energies in both biases (although only the positive bias is shown here for clarity). While there appears to be a small change, from at low energy to about around 30 mV, no significant dispersion is found for these peaks. Whether this small shift comes from the appearance of an additional dispersive or non-dispersive feature, an increase in the low-wavevector background, or a small dispersion in these points should be resolved by additional data.
In a recent theoretical paper, Wang and Lee wanglee explored the possibility that band-structure quasiparticles will exhibit quantum interference due to the presence of point defects in the system. This would manifest itself as strongly dispersing features in the Fourier transform of the LDOS as a function of energy. Clearly, such an effect will be strong at high energies (bias voltages) and will disappear close to zero bias due to the lack of phase space for the possible ’s. Indeed, Wang and Lee find essentially no peaks at any for energies close to zero bias in their theoretical study. Since we see a feature at for mV and it shows no dispersion up to 20 mV, it is clear that we observe something other than the dispersion predicted by Wang and Lee. We will come back to this point in the next section.
III.3 Phase Information
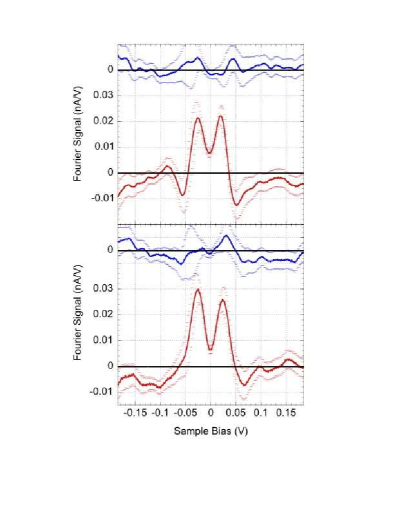
In addition to the information extracted above from the magnitude of the Fourier transform, there is also information contained in the phase for the variety of energies sampled. We now use this to further understand the four-period modulation observed and contrast it with other features discussed above (Figs. 5,6). Fig. 7 shows that the modulation in the LDOS exhibits a strong energy dependence. Here we show the value of the Fourier transform at the two independent peaks from Fig. 2b as a function of the bias voltage. The error bars are determined by modeling the variations in dI/dV(x,y) at each energy by uncorrelated noise of the same amplitude. The arbitrary phase (dependent on the point about which the Fourier transform is computed) has been set to maximize the real part, plotted in red, which changes sign at about 40 mV. The variation in the imaginary part of the signal is considerably smaller, consistent with zero within the uncertainty. This is important, since it shows that the location in real-space of the density of states (DOS) modulation is the same at all measured energies, although at about 40 mV the positions of the maxima and the minima switch.
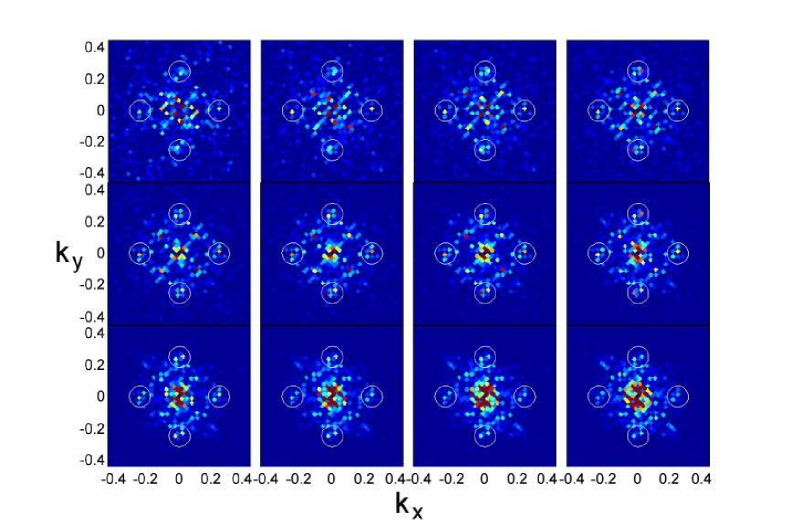
The constancy of the phase can be illustrated in another manner, reminiscent of the analyses of neutron scattering results: Fig. 8 is similar to Fig. 5, but integrated in energy. Each panel shows the power spectrum of the current at that energy, which is equal to the integral from zero to V of dI/dV. It is clear that with increasing energy, the four-period modulation remains relatively strong, while many other features fade away. The features that remain at many energies are apparently summed with the same wavevector and phase, i. e., they are a non-dispersive and pinned. On the other hand, many of the other features (internal to the four spots in -space) are reduced in intensity, indicating more variation in either phase or -space location with energy. To focus on the peaks at , we show in Fig. 9 the contrast between the raw dI/dV and the integrated dI/dV for line scans along the to direction as a function of wave-vector and energy. The fact that the peak at is enhanced as a function of energy for the integrated curves reflects the non-dispersing nature of this modulation kivfradkin .
Furthermore, the energy dependence of the Fourier transform (Fig. 7) shows that relative spectral weight is shifted to sub-gap energies (with a peak at 25 mV) from intermediate energies (with weight between 50 and 150 mV). The comparison of the above result with the energy of the superconducting gap ( 40 mV) provides strong circumstantial evidence that the striped quasiparticle density and superconductivity are intimately connected demler1 . Since the integrated density of states from zero to infinity is the total charge, the shift of weight from intermediate to low energies coupled with the small magnitude of the Fourier components ( of the LDOS) indicates that the total charge participating in this density of states modulation is very small, as is expected for itinerant systems with strong Coulomb interactions castellani ; perali ; kivaeppli . On the other hand, it is important to note that energy independent spatial variations in the DOS would not appear in this analysis because the normalization is set by maintaining constant current (which is proportional to the integrated DOS from zero to the setpoint voltage). We are sensitive to features in the shape of the LDOS, not the overall magnitude. Energy independent changes would however appear in the so-called topographic signal (Fig. 1a), which actually maps a contour of constant integrated density of states. The power spectrum of the topograph reveals no such peaks above the noise; however, this is inconclusive because of the small amount of total charge expected to participate in the modulation for this systemcastellani ; perali ; kivaeppli .
III.4 Anisotropy
To examine whether the LDOS modulation in our experiments is anisotropic, we performed Fourier analysis on many smaller sub-regions of a slightly larger area (Fig. 10). In Fig. 10c and 10d we show maps of the spatial variation of the amplitude of the two perpendicular pairs of Bragg peaks. The color at each point is determined by taking the magnitude of the Fourier transform at the four period point for the pixel dI/dV(15mV) map centered at this point. In addition to the small scale variations which come from noise and finite size effects, it is clear that each varies on the scale of roughly 100 Å. In addition, these large scale features exhibit significant anticorrelations between the two maps: there are several regions in space where one map shows a local maximum while the other shows a local minimum. This indicates that locally there is a broken symmetry, and that the underlying order is not two-dimensional, but one-dimensional. The two-dimensional nature of the patterns observed appears to come from the interpenetration of these perpendicularly oriented stripes.
IV DISCUSSION
“Stripe order” usually describes unidirectional density wave states, which can involve unidirectional charge modulations (“charge stripes”) or coexisting charge and spin density order (“spin stripes”). Such a state in HTSC, with spatial segregation of charge, was first suggested by Zaanen and Gunnarson zaanen and by Schulz schulz . Stripe order is expected to occur via a quantum phase transition (i. e. at ), where the broken symmetry state is one that breaks rotational symmetry and translation symmetry perpendicular to the stripe direction (in a crystal we mean breaking the crystal symmetry group.) For HTSC, in the regime where superconductivity is present, Kivelson and Emery ek1 argued that while no long range stripe order will be present for , the proximity of the system to the stripe quantum critical point implies strong stripe fluctuations. In this stripe-liquid phase stripes are dynamical objects and thus cannot be detected with static probes such as STM. However, even a small amount of quenched disorder will pin the stripes, hence revealing the nature of the nearby ordered stripe phase ek1 ; polkovnikov ; hasselmann . Vortex-induced pinning of stripes was used by Hoffman et al. hoffman to explain the observed density modulation near vortex cores. Random point defects, present in all HTSC samples, could play a similar role, thus explaining the origin of the stripe patterns we observe.
While the analysis presented above concentrated on the robust feature at -vectors along the Cu-O bonds, it is evident that our data show more than just that modulation. Features, which may be dispersing similar to the suggestion of Wang and Lee wanglee , appear in the data. Thus, while it is clear that the simple picture of Wang and Lee cannot explain our data, the extra features suggest that the stripe picture alone is not comprehensive. Explaining the electronic structure data using a simple band structure approach was already shown to be inadequate by recent ARPES studies loeser ; bogdanov ; feng ; orgad ; bogdanov1 ; kaminski . In the normal state (i. e. at temperatures above ), the main problem arises in analyzing the single hole spectral function as a function of frequency and wavevector. While for a fixed k the spectral function showed only broad features as a function of , the structure of the spectral function became sharp when measured at a fixed frequency , and as a function of k. This effect points to the absence of stable excitations with the quantum numbers of the electron, hence, a non-Fermi liquid situation exists in the normal state of the cuprates. In the ordered state (the superconducting state) quasiparticles seem to become well defined feng1 . This fact was taken at face value by Wang and Lee to suggest that in the superconducting state they should be able to use the simple band structure approach.
However, the same ARPES data clearly indicate that the superconducting state is anomalous as well, with a coherence-like peak that tracks the superfluid density and the hole doping instead of the gap feng1 , and an anomalous nodal quasiparticle lifetime valla . Here it was found that the inverse lifetime of the excitations is proportional to temperature, independent of binding energy, for low energies, and is proportional to energy, independent of temperature for large binding energies. This “marginal Fermi liquid” behavior varma is unaffected by the occurrence of superconductivity as the temperature is lowered. Nevertheless oscillations that are of a single particle nature will occur even when there are no well defined quasiparticles, so long as there are some elementary excitation in the system with a well defined dispersion relation. If we take the underlying band structure measured by ARPES for at similar doping as a guidelinebogdanov1 ; kaminski , we find discrepancies with the quasiparticle scattering interference picture in two regimes. First, as we noted above, we observe Fourier peaks at at and near zero bias. It is easy to see that the quasiparticle interference picture cannot produce such peaks at low energies kivelson ; wanglee . Assuming quasiparticles with -dependent energy: , where is the d-wave superconducting gap and is the normal-state quasiparticle dispersion (assuming well-defined quasiparticles exist) measured from the Fermi surface. We assume scattering on the Fermi surface from state to with , such that . In that case , and . If we extract directly from the ARPES data bogdanov1 ; kaminski , we find . For meV loeser ; ding1 ; fedorov , which is also the minimum gap found on this type of samples using STM howald1 ; lang , this gives an estimate of the lowest energy for quasiparticle scattering at this wavevector of approximately meV. The correct energy cutoff may be somewhat different depending on the exact details of the band-structure, but this analysis certainly excludes the energies around zero bias. Second, as noted above, the assumption of quasiparticles with well defined dispersion should cease to be justified when the energy is meV since at these energies we expect the behavior to be more normal-state like feng1 . This is in particular true if the system is close to a quantum critical point as was shown by Valla et al. valla .
Our results however are consistent with an underlying stripe structure, as are, in a similar way, the ARPES datazhou1 . If we adopt a quasi one-dimensional approach (i. e., stripe structure) to describe the normal state, it is clear that since continuous global symmetries cannot be spontaneously broken in one dimension, even at , the system has to exhibit interchain coupling at the onset of ordererica . In that context the system will retain some of its one dimensional nature, and thus one should observe in STM studies of point impurities in high- the signature of both Friedel-like oscillations and a fixed CDW at the stripe wavevector.
Modulations which reflect the spectrum of elementary excitations can however be distinguished from those related to incipient order. In particular, the peak in the Fourier transform of the LDOS produced by incipient order tends to be phase coherent, in agreement with Fig. 7. At the same time, features that are not due to incipient order will either have a random phase (if they originate from noise), or a phase that is strongly energy dependent (if they originate from dispersing features). Thus, as suggested in the previous section, in order to focus on those aspects of the STM spectrum that reflect incipient order, one should integrate over a small but finite range of energies about ; non-dispersive, phase coherent features of the spectrum will thus be accentuated, while dispersive, phase incoherent features will tend to cancelkivelson as was demonstrated in Figs. 8 and 9. Moreover, the energy dependence presented in Fig. 7 was obtained theoretically for models that include striped-charge order subir ; demler1 ; vojta . All these models rely on pinning of dynamic spin and charge density waves fluctuations in a d-wave superconductor by local imperfections which preserve spin-rotation invariance, such as impurities or vortex cores. In particular, Podolsky et al. derived an explicit expression for the Fourier component of the local density of states at the ordering wavevector, and demonstrated that various patterns of translational symmetry breaking exhibit different energy dependence. Comparing to our data presented earlier howald , which is reproduced here in Fig. 7, they argued that the data are consistent with weak translational symmetry breaking that includes charge density waves and direct dimerization. Indeed Fig. 4 in their paper reproduces remarkably well our results.
Finally we note that in addition to this static striped density of states structure that spans the entire surface, gap structure inhomogeneities are observed in all our samples. The movement of LDOS to the middle of the gap, around a particular energy, and its origin from states just above the gap suggests that the density modulation and superconductivity are inseparable. The inhomogeneities in the superconducting gap structure should therefore also be reflected in the striped density of states. Indeed, the striping does show local variation as is shown in Fig. 9, together with topological defects in the striped structure visible in Fig. 4 kivfradkin .
V CONCLUSION
In this paper we studied the LDOS spectra of slightly overdoped
BSCCO single crystals. Based on our data we conclude that the
studied samples exhibit two types of modulated features in the
energy dependent LDOS. First, there are peaks at wavevectors
corresponding to four-period modulation of the LDOS along the Cu-O
bond direction, which we take as evidence for stripe order.
Second, there are features, primarily at shorter wavevectors,
which may to be energy dependent. These may be attributed to a
combination of elementary excitation (quasiparticle-like)
dispersionwanglee and the strong inhomogeneities in the gap
structure previously observed by several groups
howald1 ; pan1 ; lang . Finally, it is remarkable that in this
single set of experiments we see locally the d-wave
superconducting gap, the pseudogap, and metallic stripes,
suggesting that all reflect aspects of the same physics.
While this paper was being completed, Hoffman et al.
hoffman2 published higher resolution but qualitatively
similar data to that first published by Howald et al.
howald and to the data presented in this paper. However,
in their paper they focus on the dispersive features of the data,
overlooking the existence of peaks at the stripe wavevector which
appear for all their reported energies.
Acknowledgements: We thank Subir Sachdev and Steve Kivelson for many useful discussions. Work supported by Air Force Office of Scientific Research. The crystal growth was supported by the U. S. Department of Energy under contracts No. DE-FG03-99ER45773 and No. DE-AC03-76SF00515, by NSF CAREER Award No. DMR-9985067, and by the A. P. Sloan Foundation.
References
- (1) J. Zaanen and O. Gunnarsson, Phys. Rev. B 40, 7391 (1989).
- (2) V.J. Emery and S.A. Kivelson, Physica C 209, 597 (1993); S.A. Kivelson and V.J. Emery, in Strongly Correlated Electronic Materials, Proceedings of the Los Alamos Symposium, 1993, ed. by K.S. Bedell, Z.Wang, D.E.Meltzer, A.V.Balatsky, and E.Abrahams (Addison-Wesley Publishing Co, 1994) pg. 619.
- (3) V.J. Emery, S.A. Kivelson, and J.M. Tranquada, Proc. Natl. Acad. Sci. 96, 8814 (1999).
- (4) A. Polkovnikov, S. Sachdev, M. Vojta, and E. Demler, in ‘Physical Phenomena at High Magnetic Fields IV’, October 19-25, 2001, Santa Fe, New Mexico, cond-mat/0110329.
- (5) J. Zaanen and A.M. Oles, Annalen der Physik 5, 224 (1996).
- (6) S.R. White and D.J. Scalapino, Phys. Rev. Lett. 81, 3227 (1998).
- (7) J.M. Tranquada, J.D. Axe, N. Ichikawa, A.R. Moodenbaugh, Y. Nakamura, and S. Uchida, Phys. Rev. Lett. 78, 338 (1997).
- (8) B. Lake, G. Aeppli, K.N. Clausen, D.F. McMorrow, K. Lefmann, N.E. Hussey, N. Mangkorntong, M. Mohara, H. Takagi, T.E. Mason, and A. Schroder, Science 291, 1759 (2001).
- (9) B. Lake, G. Aeppli, K.N. Clausen, D.F. McMorrow, K. Lefmann, N.E. Hussey, N. Mangkorntong, M. Mohara, H. Takagi, T.E. Mason, and A. Schroder, Nature 415, 299 (2002).
- (10) V. F. Mitrović, E. E. Sigmund, M. Eschrig, H. N. Bachman, W. P. Halperin, A. P. Reyes, P. Kuhns, and W. G. Moulton, Nature 413, 501 (2001).
- (11) J. E. Hoffman, E.W. Hudson, K.M. Lang, V. Madhavan, S.H. Pan, H. Eisaki, S. Uchida, and J.C. Davis, Science 295, 466 (2002).
- (12) B. Khaykovich, Y. S. Lee, R. Erwin, S.-H. Lee, S. Wakimoto, K. J. Thomas, M. A. Kastner, and R. J. Birgeneau, to appear in Phys. Rev. B, cond-mat/0112505.
- (13) Y. S. Lee, R. J. Birgeneau, M. A. Kastner, Y. Endoh, S. Wakimoto, K. Yamada, R. W. Erwin, S. H. Lee, and G. Shirane, Phys. Rev. B 60, 3643 (1999).
- (14) X. J. Zhou, T. Yoshida, S. A. Kellar, P. V. Bogdanov, E. D. Lu, A. Lanzara, M. Nakamura, T. Noda, T. Kakeshita, H. Eisaki, S. Uchida, A. Fujimori, Z. Hussain, and Z.-X. Shen, Phys. Rev. Lett. 86, 5578 (2001).
- (15) Ch. Renner, B. Revaz, K. Kadowaki, I. Maggio-Apprile, and O. Fischer, Phys. Rev. Lett. 80, 3606 (1998).
- (16) S.H. Pan, E.W. Hudson, A.K. Gupta, K.-W. Ng, H. Eisaki, S. Uchida, and J.C. Davis, Phys. Rev. Lett. 85, 1536 (2000).
- (17) E. Demler, S. Sachdev, and Y. Zhang, Phys. Rev. Lett. 87, 067202 (2001); Y. Zhang, E. Demler, and S. Sachdev, cond-mat/0112343.
- (18) C. Howald, H. Eisaki, N. Kaneko, and A. Kapitulnik, cond-mat/0201546.
- (19) Q. H. Wang and D. H. Lee, cond-mat/0205118.
- (20) P. V. Bogdanov, A. Lanzara, X. J. Zhou, S. A. Kellar, D. L. Feng, E. D. Lu, H. Eisaki, J.-I. Shimoyama, K. Kishio, Z. Hussain, and Z. X. Shen, Phys. Rev. B 64, 180505(R) (2001).
- (21) P. V. Bogdanov, A. Lanzara, S. A. Kellar, X. J. Zhou, E. D. Lu, W. J. Zheng, G. Gu, J.-I. Shimoyama, K. Kishio, H. Ikeda, R. Yoshizaki, Z. Hussain, and Z. X. Shen, Phys. Rev. Lett. 85, 2581 (2000).
- (22) A. Kaminski, M. Randeria, J. C. Campuzano, M. R. Norman, H. Fretwell, J. Mesot, T. Sato, T. Takahashi, and K. Kadowaki, Phys. Rev. Lett. 86, 1070 (2001).
- (23) M.D. Kirk, J. Nogami, A.A. Baski, D.B. Mitzi, A. Kapitulnik, T.H. Geballe, and C.F. Quate, Science 242, 1673 (1988).
- (24) C. Howald, P. Fournier, and A. Kapitulnik, Phys. Rev. B 64, 100504 (2001).
- (25) S. H. Pan, J. P. O’Neal, R. L. Badzey, C. Chamon, H. Ding, J. R. Engelbrecht, Z. Wang, H. Eisaki, S. Uchida, A. K. Gupta, K. W. Ng, E. W. Hudson, K. M. Lang, and J. C. Davis, Nature 413, 282 (2001).
- (26) K. M. Lang, V. Madhavan, J. E. Hoffman, E. W. Hudson, H. Eisaki, S. Uchida, and J. C. Davis, Nature 415, 412 (2002).
- (27) A. G. Loeser, Z. X. Shen, M. C. Schabel, C. Kim, M. Zhang, A. Kapitulnik, and P. Fournier, Phys. Rev. B 56, 14185 (1997)
- (28) C. Renner, B. Revaz, K. Kadowaki, I. Maggio-Aprile, and O. Fischer, Phys. Rev. Lett. 80, 149 (1998).
- (29) P. T. Sprunger, L. Petersen, E. W. Plummer, E. Laegsgaard, and F. Besenbacher, Science 275, 1764 (1997).
- (30) J. Friedel, Nuovo Cimento Suppl. 7, 287 (1958).
- (31) B. G. Briner, Ph. Hofmann, M. Doering, H.-P. Rust, E. W. Plummer, and A. M. Bradshaw, Phys. Rev. B 58, 13931 (1998).
- (32) A. Polkovnikov, M. Vojta, and S. Sachdev, Phys. Rev. B 65, 220509 (2002).
- (33) D. Podolsky, E. Demler, K. Damle, and B. I. Halperin, cond-mat/0204011
- (34) M. Vojta, cond-mat/0204284.
- (35) C. Castellani, C. Di Castro , and M. Grilli, Phys. Rev. Lett. 75, 4650 (1995).
- (36) A. Perali, C. Castellani, C. Di Castro, and M. Grilli, Phys. Rev. B 54, 16216 (1996).
- (37) S. A. Kivelson, G. Aeppli, and V. J. Emery, Proceedings of the National Academy of Sciences of the United States of America 98, 11903 (2001).
- (38) H. J. Schulz, Phys. Rev. Lett. 64, 1445 (1990).
- (39) N. Hasselmann, A. H. C. Neto, C. M. Smith, and Y. Dimashko, Phys. Rev. Lett. 82, 2135 (1999).
- (40) D. L. Feng, D. H. Lu, K. M. Shen, S. Oh, A. Andrus, J. O’Donnell, J. N. Eckstein, J. Shimoyama, K. Kishio, and Z. X. Shen, Physica C 341, 2097 (2000).
- (41) D. Orgad, S. A. Kivelson, E. W. Carlson, V. J. Emery, X. J. Zhou, and Z. X. Shen, Phys. Rev. Lett., 86, 4362 (2001).
- (42) D. L. Feng, D. H. Lu, K. M. Shen, C. Kim, H. Eisaki, A. Damascelli, R. Yoshizaki, J.-I. Shimoyama, K. Kishio, G.D. Gu, S. Oh, A. Andrus, J. O’Donnell, J. N. Eckstein, and Z. X. Shen, Science 289, 277 (2000).
- (43) T. Valla, A. V. Fedorov, P. D. Johnson, B. O. Wells, S. L. Hulbert, Q. Li, G. D. Gu, and N. Koshizuka, Science 285, 2110 (1999).
- (44) C. M. Varma, P. B. Littlewood, and S. Schmitt Rink, E. Abrahams and A. E. Ruckenstein , Phys. Rev. Lett. 63, 1996 (1989).
- (45) S. A. Kivelson, E. Fradkin, V. Oganesyan, J. M. Tranquada, A. Kapitulnik, and C. Howald, ‘How to detect “fluctuating” order in the high temperature superconductors,’ preprint.
- (46) A. V. Fedorov, T. Valla, P. D. Johnson, Q. Li, G. D. Gu, and N. Koshizuka, Phys. Rev. Lett. 82 (1999).
- (47) H. Ding, J. C. Campuzano, A. F. Bellman, T. Yokoya, M. R. Norman, M. Randeria, T. Takahashi, H. Katayama-Yoshida, T. Mochiku, K. Kadowaki, and G. Jennings, Phys. Rev. Lett. 74, 2784 (1995).
- (48) X. J. Zhou, P. Bogdanov, S. A. Kellar, T. Noda, H. Eisaki, S. Uchida, Z. Hussain, and Z.-X. Shen, Science 286, 268 (1999).
- (49) E. W. Carlson, V. J. Emery, S. A. Kivelson, and D. Orgad, Review chapter to appear in ‘The Physics of Conventional and Unconventional Superconductors’ ed. by K. H. Bennemann and J. B. Ketterson (Springer-Verlag); 180 pages, including 49 figures.
- (50) S. A. Kivelson, E. Fradkin, and V. J. Emery, Nature 393, 550 (1998).
- (51) J. E. Hoffman, K. McElroy, D.-H. Lee, K. M. Lang, H. Eisaki, S. Uchida, J. C. Davis, Science 297, 1148 (2002).