Instability of quasi-liquid on the edges and vertices of snow crystals
Abstract
In this paper, we show theoretically that there exists quasi-liquid on the edges and vertices of snow crystals between C and C, while the faces and have no quasi-liquid layers. Investigating the macroscopic theory of quasi-liquid and applying to the edges and vertices of the crystal, we find that the quasi-liquid becomes unstable above the critical supersaturation point, which is above the water saturation point. The thickness of this unstable quasi-liquid layer continues growing indefinitely. We interpret this behavior as corresponding to continuous production and overflow onto neighboring faces in a real system. We hypothesize that the unstable growth of snow crystals originates from the edges and vertices, and it is due to the overflow of quasi-liquid from the edges and vertices onto the neighboring faces, which are rough and lack quasi-liquid. Our hypothesis accounts for the qualitative behavior of the relations between the morphological instability and the water saturation in the snow phase diagram.
pacs:
81.10.Aj, 68.60.-p, 64.70.-pI Introduction
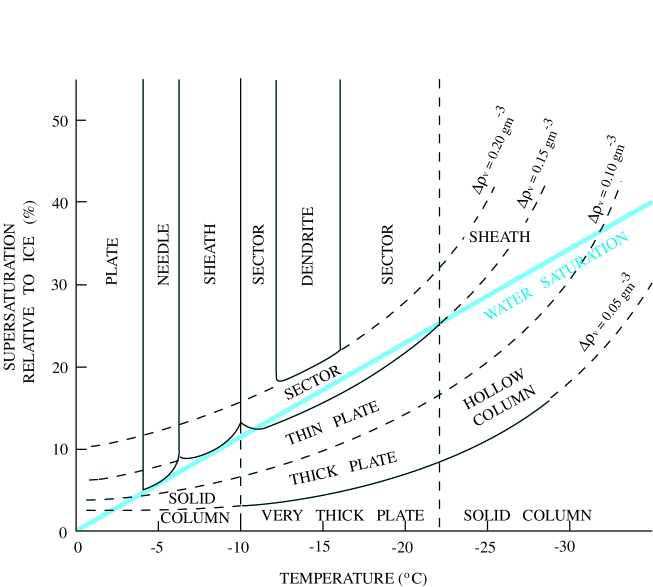
The snow crystal is one of the most beautiful things in nature, and it has attracted human interest since long ago. Its basic form is a hexagonal prism bounded by two basal and six prism faces . Nakaya Nakaya was the first to successfully produce snow crystals in the laboratory, and he investigated the relations between growth forms and experimental conditions (i.e., temperature and supersaturation relative to ice). Since his work, many experimental studies have been carried out Aufm . The snow phase diagrams obtained in these studies exhibit two important features (See Fig.1). One is that three transitions occur in the basic crystal form: at temperatures near (plates to columns), (columns to plates), and (plates to columns). These transitions correspond to changes in the growth rates of the faces and the faces with temperature Lamb . The second important point is that a morphological instability arises when the supersaturation relative to ice becomes sufficiently large. Especially above the water saturation point (saturation relative to supercooled water), the crystal growth originates from the edges and the vertices, and as a result, needles and sheaths are produced between and , and dendrites and sectors are produced between and .
The basic growth form of snow crystals is determined by the most slowly growing faces. The basal and prism faces grow slowly and become the bounding faces of the crystal. Assuming that the faces grow through the spreading motions of two-dimensional nuclei BCF , and taking into account the vapor diffusion field surrounding the crystal, Frank proposed a possible explanation of the dendritic growth of snow crystals Frank . Based on the same idea, Yokoyama and Kuroda YK simulated the growth of an infinitely long hexagonal column (i.e. a two-dimensional snow crystal), and they succeeded in showing that six primary branches are produced from the vertices of the column. The instability that results in the production of these branches is due to the nonuniformity of the vapor density surrounding the polyhedron crystal. Their simulation, however, also showed that when secondary branches are produced, the size of the primary branches becomes comparable with that of the original hexagonal column. This is not a realistic modeling of the dendrites in actual snow crystals. Furthermore, this theory cannot account for the snow phase diagram discussed above. It is thus apparent that we must take into account other, yet unknown effects to explain the dendritical instability.
The three experimentally observed transitions in the basic crystal form at low supersaturation were accounted by the theory of Kuroda and Lacmann KurodaLacmann . This theory is based on the well-known fact that the surface of ice existing just below is coated with a thin liquid like layer (quasi-liquid layer). This quasi-liquid layer has been observed using a variety of experimental techniques Kvli ; Mizuno ; Beag ; YMT ; GJ ; Bil ; Elbaum . Theoretically, Weyl Weyl gave qualitative arguments for its existence, and Fletcher Flet developed Weyl’s arguments into a quantitative form. The starting point of Kuroda and Lacmann is a phenomenological model of the quasi-liquid layer proposed by Lacmann and Stranski LS1 . On the basis of this model, Kuroda and Lacmann predicted that there exists quasi-liquid on the face at lower temperatures than on the face . Recently, it has been observed in both experiments YMT ; Bil and molecular dynamics simulations Nada that there is a difference in behaviour of the quasi-liquid layer on basal and prism faces. Kuroda and Lacmann hypothesized that the surface structure of ice changes with decreasing temperature from a surface covered with a quasi-liquid layer to a rough surface without a quasi-liquid layer and finally to a smooth surface. According to their description, the changes in crystal form are due to the anisotropy in these surface structural transitions between basal and prism faces of ice.
In this paper, we investigate the interaction between the quasi-liquid and the edges and vertices of snow crystals, whose growth originates from the edges and the vertices from C to C and above the water saturation point. In Section 2, we present a macroscopic model of a quasi-liquid layer and the explanation of the crystal form transitions proposed by Kuroda and Lacmann. In Section 3, we give an argument asserting that quasi-liquids remain on the edges and vertices in the temperature region between C and C, where the faces and have no quasi-liquid layer. In Section 4, to examine curvature effects on the quasi-liquid, we investigate a model of an ice particle covered with a quasi-liquid layer in a vapor environment. In Section 5, we construct a macroscopic model describing a snow crystal whose six prism faces are without quasi-liquid but whose edges are covered with quasi-liquid. Using this model, we show that a novel instability arises on the edges and the vertices above the water saturation point due to the presence of the quasi-liquid. In Section 6, we present a new description of the relation between morphological instability and water saturation in the snow phase diagram. In Section 7, we give a summary.
II Quasi-liquid layer on a flat surface
A quasi-liquid layer can exist in a stable state because its presence reduces the surface free energy of the system. The energetic advantage of surface melting is represented by LS1 , defined as
| (1) |
where is the surface energy per unit area of a vapor-solid interface, that of a solid-liquid one, and that of a liquid-vapor one. This parameter is positive for a system of water and ice, and thus in this case the existence of the quasi-liquid lowers the surface energy. The free energy per unit area of a quasi-liquid layer of thickness is given by LS1 ; KurodaLacmann
| (2) |
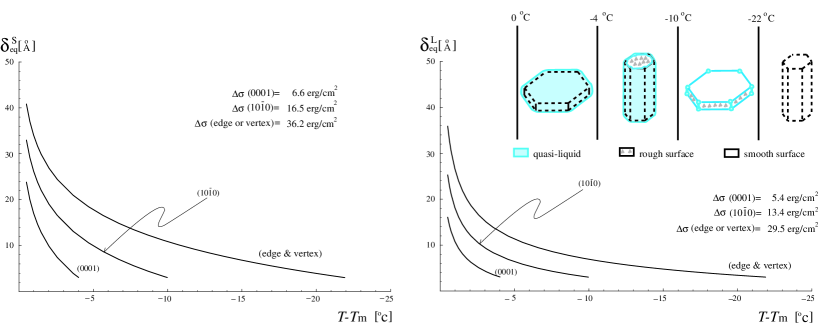
where is the molecular volume in the quasi-liquid layer and and are the chemical potentials per molecule for the bulk liquid and the bulk solid, respectively. Here the function must satisfy the conditions and , which result from the conditions and . To this time, two types of have been used (see, for example, Ref.DasFuWet ). One is short range, , and the other is long range, KurodaLacmann , where is a positive integer ( for the Van der Waals forces KurodaLacmann ) and is a parameter corresponding to the characteristic interaction length of the molecule in the quasi-liquid. Applying the minimization condition , we find that the equilibrium thickness of the quasi-liquid layer is
| (3) |
for , and
| (4) |
for , where is the energy of melting per molecule, is the absolute temperature, and is the melting temperature. Here, we have used the equation , which is derived from the Gibbs-Duhem relation assuming constant pressure and small . As seen in Eqs.(3) and (4), the thickness of the quasi-liquid layer decreases monotonically with falling temperature. The above equations should be considered valid only until the thickness becomes on the order of a few monolayers, but beyond this point, we can consider the layer to have vanished. At this temperature, the surface strongly adsorbs molecules, and it thus become rough at the molecular level. The number of adsorbed molecules decreases with falling temperature, until eventually it vanishes, and the surface is thus smooth.
The parameter can be approximated in terms of the number density of the broken bonds per unit area as
| (5) |
where is the energy of sublimation per molecule and is the number of the bonds per molecule in the crystal Cloud . For snow crystals, we know that , from consideration of the surface molecular structures of ice, and , from experimental tables Cloud . Thus . According to Eqs.(3) and (4), this implies that the quasi-liquid layer on a face remains at lower temperature than that on a face . Thus snow crystals have the following four different surface structures KurodaLacmann : (I) both the faces and are covered with a quasi-liquid layer; (II) the face is covered with a quasi-liquid layer, while the face has no quasi-liquid layer and is rough at the molecular level; (III) neither has a quasi-liquid layer, but is rough, while is smooth at the molecular level; (IV) neither has a quasi-liquid layer, and both are smooth at the molecular level. These structural differences result in differences in the growth speeds of these faces, since the mechanisms governing the growth depend on the surface structures. Assuming that the first surface structure transforms into the second at C, the second transforms into the third at C, and the third transforms into the fourth at C, Kuroda and Lacmann succeeded in describing the three crystal form transitions in the phase diagram KurodaLacmann .
The above consideration regards only the surface structures of faces. The situation becomes more interesting when we also consider the surface structures of the edges and vertices. There exhibit transitions that differ from those of the basal and prism faces, as we shown in the following section.
III Quasi-liquid on the edges and vertices of snow crystals
First, we approximate the energetic advantage represented by the surface melting parameter for the edges and the vertices of snow crystals, . In the process of snow crystal formation, the edges and vertices are formed as the intersections of metastable and unstable faces, such as , and . For this reason, we approximate by taking the average of for the intersecting faces. It is known from the molecular structure of ice that these metastable and unstable faces are rough and have large broken bond densities in comparison with the faces and . Thus, from Eq.(5), we see that is much larger than and :
| (6) |
This implies that for the edges and vertices, it is more energetically advantageous to have a surface transition from solid to liquid, and thus that they have a greater affinity for quasi-liquid. It is suggested by Eqs.(3) and (4) that there exists quasi-liquid on the edges and vertices at lower temperatures than on the faces and .
In Fig.2, we present surface structures of snow crystals in which the quasi-liquid of the edges and vertices are taken into account. We find the following: (I) from C to C, all the faces, edges and vertices are covered with quasi-liquid; (II) from C to C, the faces , edges and vertices are covered with quasi-liquid, while the faces have no quasi-liquid and are rough; (III) from C to C, the edges and vertices are covered with quasi-liquid, while the faces are smooth and the faces are rough, both without quasi-liquid; (IV) below C, no quasi-liquid exists. In the following sections, we examine the stability of the quasi-liquids on the edges and vertices in a vapor environment.
IV Quasi-liquid layer on a curved solid surface
To investigate the curvature effect on quasi-liquid at the edges and vertices, we consider here three- and two-dimensional ice particles covered with quasi-liquid111Other curvature models of surface melting are presented in Refs. BD and NT .. We assume that the particles are in a vapor environment and have radius , where is the radius of the solid core and is the thickness of the quasi-liquid layer. Although the main reason we consider this system is to examine curvature effects on a quasi-liquid, the system itself has meaning as a model of ice nucleation in a vapor environment.
We assume a free energy of the above described system as
| (7) |
where for three-dimensional particles and for two-dimensional particles, , and are the chemical potentials per molecule for the bulk vapor, bulk liquid and bulk solid, and and are the volumes per molecule for the quasi-liquid and the solid. The first two terms on the right-hand side of Eq.(7) are the surface energies of the system, and the last two terms are the bulk contributions. The surface energy contribution must coincide with for and for . Thus and . As in Eq.(2), we use two types of : and . The quantity reduces to Eq.(2) when and . Since we are interested in the growth of ice in a vapor environment, we assume vand in the following.
The equilibrium condition is given by the equations
| (8) | |||||
| (9) |
In equilibrium, we find a useful relation between and . From Eq.(8), we have
| (10) |
Thus, Eq.(9) becomes
| (11) |
This equation determines as a function of . If we use , we obtain
| (12) |
and if we use , we obtain
| (13) |
where and are defined by
| (14) |
and
| (15) |
The above functions and diverge at , and when , they monotonically decrease and approach the following and asymptotically:
| (16) | |||||
| (17) |
No real solution of and exists for .
When , which holds for ice and water (and quasi-liquid), the following relations hold:
| (18) |
The quantities and are given in Eqs.(3) and (4). Thus we find the following two properties of and . One is that in equilibrium. For , this means that the equilibrium radius of the solid part of the particle ,, is always larger than the critical radius of ice nucleation in supercooled water. The other is that in Eq.(12) and in Eq.(13) are always greater than in Eq.(3) and in Eq.(4), respectively. This implies that the equilibrium thickness on a curved surface is greater than that on a plane surface, .
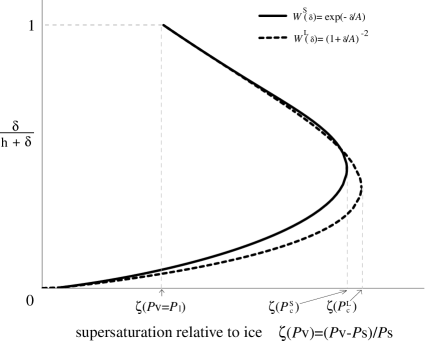
We solved Eqs.(8) and (9) numerically. In Fig.3, we plot the ratio in equilibrium as a function , where is the actual vapor pressure and and are the equilibrium vapor pressures for the bulk liquid and the bulk solid, respectively. To obtain Fig.3, we have used the relations
| (19) | |||||
| (20) | |||||
| (21) |
where is the Boltzmann constant and is the chemical potential of vapor at . When , the equilibrium state is uniquely determined. When , in addition to this state, another equilibrium state that has a thicker quasi-liquid layer appears. This state appears because above it is possible not only for the solid but also for the liquid to grow in the vapor environment. As the supersaturation increases, these two equilibrium states approach each other, and at they coincide. Above no equilibrium state exists. All the equilibrium states obtained here are labile equilibrium states. From the viewpoint of ice nucleation in a vapor environment, they all correspond to a critical radius of nucleation.
V Instability of the quasi-liquid remaining on the edge of the crystal
Let us now consider a snow crystal whose edges are covered with quasi-liquid and whose faces have no quasi-liquid layer (see Fig.2). For the sake of simplicity, we consider only the six edges at which two different prism faces meet (see fig.4). For other edges and vertices, similar analyses can be carried out and yield qualitatively similar results.
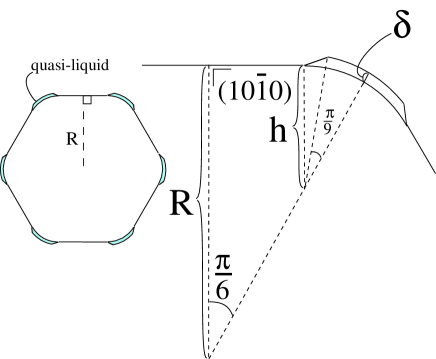
The six prism faces grow slowly in comparison with the edges, and therefore we use the approximation that their speed of growth is zero. As shown in Fig.4, we also simplify the shape of the quasi-liquid layer on the edges. This simplification is justified when . For this system, the free energy of the snow crystal is given as
| (22) | |||||
where is the surface energy for a prism face that has no quasi-liquid layer and adsorbs molecules, and and are the surface energy of the solid-liquid interface and the energetic advantage of surface melting (given by Eq.(5)) for the surface of the edge, respectively. The curvature effects considered in the previous section are taken into account by the terms inside the last set of square brackets on the right-hand side of Eq.(22). When and , Eq.(22) becomes
| (23) | |||||
where
and we have used the approximations and . The equilibrium condition is given by
| (24) | |||
| (25) |
From Eq.(25), we find
| (26) |
where is the surface energy of the vapor-solid interface for the edge. In order for to be positive (which means that the curved edge is energetically stable) and for to hold (which means that a curved edge with a quasi-liquid layer is energetically stable), must satisfy
| (27) |
This equation gives a lower bound on .
Numerical solutions of Eqs.(24) and (25) are plotted in Fig.5. (Here we have used Eqs.(19)-(21) again.) Remarkably, we find a stable equilibrium state when . In this case, a snow crystal with small and evolves toward a stable state, at which point it ceases growing.
When , no stable solution satisfying Eqs.(24) and (25) is found. It is interesting that the thickness continues to grow in this case. This suggests that a novel instability arises on the edges of snow crystals when . Of course, in a real system, cannot continue to grow indefinitely, and thus this result reveals a limitation of our model. Our model breaks down when becomes comparable with , and our simplification regarding the shapes of the quasi-liquids on the edges is no longer justified. In a real system, as the thickness of the quasi-liquid grows, eventually it begins overflowing onto the neighboring faces or to reduce the surface energy. We interpret the continuous growth of in our model as corresponding to the continuous overflowing of quasi-liquid in a real system. If the neighboring face is rough at the molecular level, the overflowing quasi-liquid sticks to the neighboring face, and immediately turns to be solid near the edge. As we show in the next section, this interpretation allows our model to explain the phase diagram of snow crystals.
VI Phase diagram
In this section we give a new description of the snow phase diagram. Let us reconsider the discussion of SectionIII. In the temperature regions (I), C to C, and (IV), below C, the quasi-liquid on the edges and vertices does not play a special role. Thus we focus on the temperature regions (II) and (III), C to .
In the temperature region (II), C to C, the six prism faces , all the edges and all the vertices are covered with quasi-liquid, while the two basal faces are rough at the molecular level and have no quasi-liquid layers. As seen in Fig. 5, when the vapor pressure is low, the quasi-liquids on the edges and vertices are stable. In this case, the edges and the vertices do not play a special role in the snow crystal formation. However, when is higher than a certain value , the quasi-liquid on the edges and vertices overflows onto the neighboring faces. The quasi-liquid overflowing onto spreads over the quasi-liquid layer, while the quasi-liquid overflowing onto rough sticks near the edges and vertices and turns to solid. In this case, two types of overflow are possible. One is overflow from the vertices, and the other is overflow from the edges where the basal and prism faces meet. If the former becomes the main type of overflow, the resultant snow crystal should grow like a needle. If the latter becomes the main overflow according to our model, the resultant snow crystal should grow like a sheath.
In the temperature region (III), C to C, the edges and the vertices are covered with quasi-liquid, while the basal and prism faces possess no quasi-liquid layer. The basal faces are smooth and the prism faces are rough at the molecular level. Here again, as seen in Fig. 5, when is low, the quasi-liquid is stable, and thus the snow crystal grows according to the theory of Kuroda and Lacmann. When is higher than , the quasi-liquid overflows onto the neighboring faces. The quasi-liquid overflowing on to smooth spreads over and turns to solid, while the quasi-liquid overflowing onto rough sticks near the edges and vertices and turns to solid. In this case, three types of overflow are possible. The first is overflow from the vertices, the second is overflow from the edges where the basal and the prism faces meet, and the third is overflow from the edges where two prism faces meet. If the amounts of quasi-liquid involved in all overflows are of the same order, the resultant snow crystal should grow like a sector at about C. If the first and (or) the third overflow are the main types of overflow, the resultant snow crystal should grow like a dendrite at about C. Contrastingly if the first and (or) the third overflow are the main overflows, but the surface structure of prism face changes from a rough surface to a smooth surface with temperature falling, the resultant snow crystal should grow like a sector again. This is because the continuous overflow spreads over smooth prism faces and turns to solid successively. In this case, the overflow can act as a step source for prism faces and thus the snow crystal grows in the manner hypothesized by Frank Frank and found in the simulation of Yokoyama and Kuroda YK . We believe that this type of sector can be observed at about C.
VII Summary
In this paper, we have shown theoretically that quasi-liquid layers exist on the edges and vertices of snow crystals between C and C, for which temperatures there is no quasi-liquid on the faces and .
To investigate the curvature effect on quasi-liquid layers at the edges and vertices, we considered an ice particle coated with a quasi-liquid layer, and derived the equilibrium over a range of supersaturation values. We found that below the water saturation point, the equilibrium state is uniquely determined. However, above this point, another equilibrium state exists because it is possible for bulk supercooled water to exist. Above the critical supersaturation point, no equilibrium state exists. We showed that the quasi-liquid layers for equilibrium states of a particle are thicker than the quasi-liquid layer for the equilibrium state of a planar surface.
Next, we considered a two-dimensional crystal. We found that there are temperatures for which the six prism faces possess no quasi-liquid, while the edges and vertices are covered with quasi-liquid. We have examined the stability of this system. We found that below the critical saturation, which is higher than the water saturation, the quasi-liquid layer exists in a stable state on the edges. However, above the critical supersaturation, the quasi-liquid becomes unstable, and continues to grow indefinitely. We interpret this indefinite growth as implying overflow onto the neighboring faces in a real system.
On the basis of our results, we have proposed a new description of snow crystal growth according to which the unstable growth of snow crystals, which prefer the edges and the vertices, is due to the overflow of the quasi-liquid from the edges and the vertices onto neighboring faces that are rough and have no quasi-liquid layers. We have shown that this overflowing occurs above the water saturation point and that these surface conditions of snow crystals are realized between C and C. This description naturally accounts the relation between the morphological instability and the water saturation in the snow phase diagram.
While we have succeeded in explaining the snow phase diagram qualitatively, for a more complete understanding, the details of crystal growth should be clarified by three-dimensional simulation. We also would like to show that secondary branches of the dendrites are produced by the overflow of quasi-liquid from the edges and vertices of the primary branches. These are future problems.
In this paper, we have focused on the quasi-liquid of snow crystals. However surface melting is observed in many classes of solids, including metals, semiconductors, solid rare gases DasFuWet . The model and method presented in this paper are also applicable to these materials, and should be useful for the investigation of general properties of surface melting.
Acknowledgements.
Special thanks are due to Professor Y. Furukawa and M. Sato for many fruitful discussions.References
- (1) U. Nakaya, Compendium of Meteorology, edited by T. F. Malone (American Meteorological Society, Boston, 1951), p.207 ; Snow Crystals-Natural and Artificial (Harvard University Press, Cambridge, MA, 1954).
- (2) H. J. Aufm Kampe, H. K. Weickmann, and J. J. Kelly, J. Metals 8, 168 (1951); J. Hallet and B. J. Mason, Proc. R. Soc. (London) A247, 440 (1958); T. Kobayashi, Phil. Mag. 6, 1363 (1961).
- (3) D. Lamb and P. V. Hobbs, J. Atmos. Sci. 28, 1506 (1971).
- (4) W. K. Burton and N. Cabrera, Disc. Faraday Soc. 5 33, 40 (1949); W. K. Burton, N. Cabrera and F. C. Frank, Phil. Trans. Roy. Soc. A243, 299 (1950 1951).
- (5) F. C. Frank, J. Cryst. Growth 24/25, 3 (1974).
- (6) E. Yokoyama and T. Kuroda, Phys. Rev. A41, 2038 (1990).
- (7) M. Faraday, Phil. Mag. 17, 162 (1859).
- (8) W. A. Weyl, J. Coll. Sci. 6, 389 (1951).
- (9) N. H. Fletcher, Phil. Mag. 7, 255 (1962) ; 8, 1425 (1963) ; 18, 1287 (1968).
- (10) R. Lacmann and I. N. Stranski, J. Cryst. Growth 13/14, 236 (1972).
- (11) T. Kuroda and R. Lacmann J. Cryst. Growth 56, 189 (1982).
- (12) T. Kuroda, J. Crystal Growth, 99, 83 (1990).
- (13) V. I. Kvlividze,V. F. Kiselev, A. B. Kuraev and L. A. Ushakova, Surf. Sci. 44, 60 (1974).
- (14) Y. Mizuno, and N. Hanafusa, J. Phys. Coll. 48, C1 (1987).
- (15) D. Beaglehole, and D. Nason, Surf. Sci. 96, 357 (1980).
- (16) Y.Furukawa, M.Yamamoto and T.Kuroda, J. Cryst. Growth 82, 665 (1987).
- (17) I. Goleki, and C. J. Jaccard, Phys. Lett. A63, 374 (1977).
- (18) A. Lied, H. Dosch, and J. H. Bilgram, Phys. Rev. Lett. 72, 3554 (1994) ; Surf. Sci. 327, 145 (1995) ; Surf. Sci 366, 43 (1996).
- (19) M. Elbaum, Phys. Rev. Lett. 67, 2982 (1991); M. Elbaum, S. G. Lipson and J. G. Dash, J. Cryst. Growth 129, 491 (1993).
- (20) H. Nada and Y. Furukawa Jpn. J. Appl. Phys. 34, 583 (1995); J. Cryst. Growth 169, 587 (1996); J. Phys. Chem. B101, 6163 (1997).
- (21) J. G. Dash, Haiying Fu and J. S. Wettlaufer, Rep. Prog. Phys. 58, 115(1995).
- (22) Microphysics of Clouds and Precipitation by Hans R. Pruppacher and James D. Klett (Kluwer Academic Publishers).
- (23) M. B. Baker and J. G. Dash, J. Cryst. Growth 97, 770 (1989).
- (24) D. Nenow and A. Trayanov, J. Cryst.Growth 99, 102 (1990).
- (25) D. Nenow, Prog. Cryst. Growth Charact. 9, 185 (1984).