[
Systematic trends in the electronic structure parameters of 4 transition metal oxides SrO3 ( = Zr, Mo, Ru, and Rh)
Abstract
We investigated the electronic structures of the perovskite-type 4 transition metal oxides SrO3 ( = Zr, Mo, Ru, and Rh) using their optical conductivity spectra . The interband transitions in are assigned, and some important physical parameters, such as on-site Coulomb repulsion energy , charge transfer energy , and crystal field splitting , are estimated. It is observed that and 10 decrease systematically with the increase in the atomic number of the 4 transition metal. Compared to the case of 3 transition metal oxides, the magnitudes of and 10 are larger, but those of are smaller. These behaviors can be explained by the more extended nature of the orbitals in the 4 transition metal oxides.
pacs:
PACS number; 78.20.-e, 78.30.-j, 78.66.-w]
I Introduction
There have been lots of investigations on 3 transition metal oxides (TMO), including cuprates and manganites, because they show a variety of interesting electric and magnetic properties.[1, 2] These behaviors are closely related to the strong electron-electron (el-el) correlation, which originates from the localized 3-orbitals. On the other hand, 4 TMO have attracted relatively less attention because it was thought that the el-el correlation effects should be small and insignificant due to their more extended -orbitals. However, numerous intriguing properties, such as superconductivity,[3] non-Fermi liquid behavior,[4] pseudogap formation,[5] and metal-insulator transitions,[6, 7, 8] have been observed recently in the 4 TMO, especially ruthenates and molybdates. These observations have stimulated new attention to the 4 TMO.
Because 4 TMO are characterized by more extended orbitals than 3 TMO, it has been generally believed that electrons in the extended 4-orbitals feel rather weak on-site Coulomb repulsion energy and exchange energy , and the 4-orbitals hybridize more strongly with neighboring orbitals, e.g., O 2-orbitals, than 3-orbitals. Additional interactions, such as spin-orbit coupling, also become significant.[9] However, these qualitative ideas are not sufficient to understand the intriguing physical phenomena observed in some 4 TMO. In 3 TMO, systematic investigations on and charge transfer energy provide a basis to elucidate origins of numerous intriguing properties.[2, 10, 11] Unfortunately, there have been few quantitative studies about the electronic structures of 4 TMO, except ruthenates,[6, 12] which makes it difficult to understand their physical properties in more depth. Quantitative information on physical parameters related to the electronic structures of TMO will serve as a starting viewpoint in investigating various 4 TMO with a potential to discover other new intriguing phenomena. And, they will also allow us to make comparisons with the 3 TMO cases, which can provide us a better understanding of physics of both TMO.
Optical spectroscopy is known to be a powerful tool to analyze the electronic structures of TMO by probing the joint density of states between unoccupied and occupied states. In this paper, we report a systematic investigation on the electronic structures of the perovskite-type 4 SrO3 ( = Zr, Mo, Ru, and Rh) by measuring their optical conductivity spectra . From these series with the same structure and valency state , one can investigate how the electronic structures change with . As far as we know, our study is the first systematic effort to investigate wide range optical properties of the 4 SrO3 series. Based on proper electronic structure diagrams, the interband transitions observed in their are assigned properly. From this, we estimate important physical parameters, such as , , and crystal field splitting energy 10, which show systematic trends with . Compared with the 3 cases, the magnitudes of and 10 are larger and those of are smaller in the 4 SrO3 compounds. These behaviors can be understood as the more extended character of the 4-orbitals than the 3-ones. From our observations, it is found that these 4 oxides belong to the Mott-Hubbard regime.
II Experimental techniques
Polycrystalline SrZrO3, SrMoO3, and SrRhO3 were prepared using the solid state reaction technique. For the SrZrO3 sample, SrCO3 and ZrO2 were used as raw materials. After calcining and grinding repeatedly, the resultant powders were pressed into a pellet under 200 MPa using cold isostatic pressing. The SrZrO3 pellet was sintered at 1700 C for 5 hours. For the SrMoO3 sample, the fine and pure SrO2, MoO3, and Mo powders were mixed with a composition of SrMoO3. The mixture of approximately 0.2 g was placed into a gold capsule and then compressed at 6 GPa in a high-pressure apparatus. The sample was heated at 1300 C for 1 hour and quenched to room temperature at the elevated pressure. For the SrRhO3 sample, a preparation procedure similar to that of the SrMoO3 sample was used. The details of this procedure were published elsewhere.[13] The high pressure of sintering technique is effective to provide metastable Mo4+ and Rh4+ states.[14] From x-ray diffraction measurements, it was confirmed that all the samples have a single phase. From dc resistivity and magnetization measurements, it was also found that their electric and magnetic properties are consistent with the previous reports.[13, 15]
Just before optical measurements, we polished the sample surfaces up to 0.3 m. Then, we measured reflectivity spectra from 5 meV to 30 eV at room temperature. In the energy region between 5 meV and 0.6 eV, we used a conventional Fourier transform spectrophotometer. Between 0.5 eV and 6.0 eV, we used a grating spectrophotometer. And, in the deep ultraviolet region above 6.0 eV, we used synchrotron radiation from the normal incidence monochromator beam line at Pohang Accelerator Laboratory. After the optical measurements, thin gold films were evaporated onto the samples and used for making corrections for light scattering loss from the rough sample surfaces.[16]
In order to obtain from the measured reflectivity spectra, we performed the Kramers-Kronig (KK) analysis. It was known that the KK analysis for the highly anisotropic polycrystalline samples could provide incorrect .[17] However, all of our 4 TMO have the slightly distorted perovskite structure and their optical constants should be nearly isotropic, so the KK analysis could be applied without any problem. For the analysis, the reflectivity below 5 meV was extrapolated with the Hagen-Rubens relation for the metallic samples and with a constant value for the insulating SrZrO3 sample. For a high frequency region, the reflectivity value at 30 eV was used for reflectivities up to 40 eV, above which dependence was assumed. To check the validity of our KK analysis, we independently determined using spectroscopic ellipsometry techniques in the photon energy range of 1.5 - 5.5 eV. The data from the spectroscopic ellipsometry agreed quite well with the results from the KK analysis.[16]
III Results and Discussions
A Schematic diagrams of the electronic structures
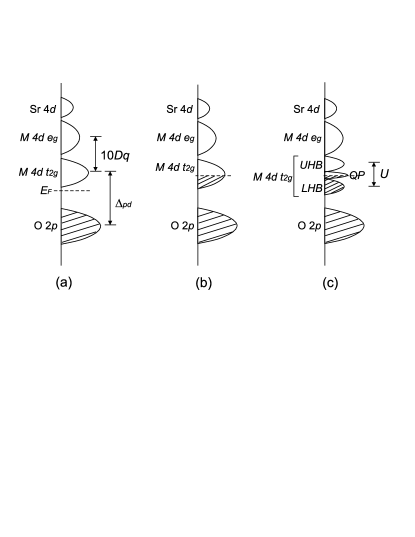
Figure 1 shows schematic diagrams of the electronic structures of the perovskite-type SrO3 compounds, where the 4 transition metal is either Zr, Mo, Ru, or Rh.[18] Figure 1(a) shows a typical diagram of electronic structure for a -insulator. SrZrO3 is known to be a 4-insulator with a bandgap between the O 2- and the Zr 4 -band.[1] The -band has a higher energy level by 10 than the -band. Usually, the Sr 4-band is in a higher energy level than 4-bands. [12] As the atomic number of increases from Zr, extra 4 electrons start to fill the -band partially without any significant change in the overall feature of the band structure. Here, the details of the partially-filled orbitals can vary according to the el-el correlation. When the el-el correlation is quite weak, i.e., 4 bandwidth , the partially-filled band induces a band metallic state, as shown in Fig. 1(b). Since SrMoO3 is a 4-system and known to be a Pauli paramagnetic band metal,[15] its electronic structure should resemble Fig. 1(b). On the other hand, when the el-el correlation is quite large, i.e., , the partially-filled band is split into two Hubbard bands by , which induces a Mott insulator. In the intermediate state between two extreme cases, there can occur correlated metals, whose band diagram is shown in Fig. 1(c). In the low-spin configuration, the quasiparticle band is located at in addition to the Hubbard bands, and the -band remains empty.[6, 12] The electronic structure of SrRuO3, a low-spin 4-system,[19] was investigated by earlier workers,[6, 12] and known to follow Fig. 1(c). It was recently found that a 4-system SrRhO3 is a paramagnetic correlated metal with the low-spin configuration.[13] Because the of SrRhO3 is narrower than that of SrRuO3, the Hubbard bands induced by the el-el correlation are more dominant in SrRhO3 than in SrRuO3. So, the band diagram of SrRhO3 can be also explained by Fig. 1(c).
According to the Fermi golden rule,[20] the p-d transitions such as O 2 4 , 4 , and Sr 4, should be distinct in of the 4 SrO3 systems. From such interband transitions, we can estimate some physical parameters; a charge transfer energy from the O 2 4 transition, and from the energy difference between O 2 4 and 4 transitions. On the other hand, the value should be estimated from the d-d transition between two Hubbard bands, which should be much weaker than the p-d transitions.
B Assignment of interband transitions in the SrO3 compounds
Figure 2 shows of SrZrO3 up to 20 eV. It is clearly shown that this insulating -compound has a large optical gap of 5.6 eV, consistent with the previous reports.[1] This value is larger by 2 eV than the bandgap of SrTiO3, i.e., 3.4 eV. Distinct interband transitions are observed around 8 eV and 12 eV. To our knowledge, there has been no band calculation report on this compound, so we assigned these interband transitions by referring to the band structure of SrTiO3, which is a 3 insulator. The dotted line in Fig. 2 represents of SrTiO3.[21] Its overall featurea are very similar to that of SrZrO3, but with 2.5 eV shift to lower energy. K. van Benthem et al. assigned the peaks around 5 eV and 9 eV of SrTiO3 as O 2 Ti 3 and O 2 Ti 3 transitions, respectively. [22] [They also claimed that the higher frequency peak should come from O 2 Ti 3 and/or Sr 4.] Similarly, we can assign the peaks around 8 eV and 13 eV in SrZrO3 as O 2 Zr 4 and O 2 Zr 4 transitions, respectively. Note that these assignments are consistent with the energy diagram of a band insulator, shown in Fig. 1(a). By using the positions of the strong peaks, we can approximately estimate that eV and 10 5 eV in SrZrO3, which are larger than the values for SrTiO3 (i.e., 5 eV and 10 4 eV).
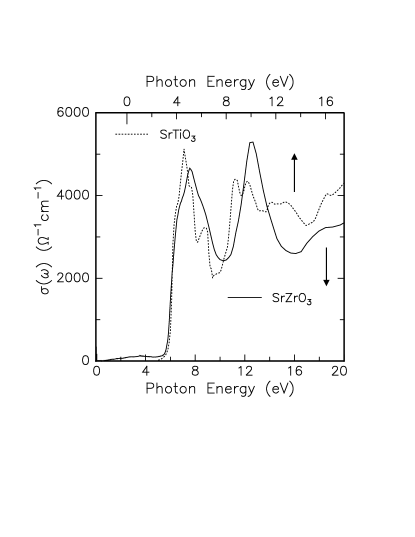
Figure 3 shows of the SrO3 series, with = Zr, Mo, Ru, and Rh, up to 12 eV. The of SrRuO3 is quoted from our previous paper.[6] The insulating SrZrO3 has a relatively large optical gap. For other metallic compounds, below 1.0 eV have zero-frequency spectral weights, which decrease with the increasing atomic number of . The coherent mode of the band metallic SrMoO3 can be fitted well by the Drude model with a plasma frequency of 2.8 eV and a scattering rate of 0.3 eV. For other correlated metallic SrRuO3 and SrRhO3, the low frequency decreases more slowly than the 1/-dependence which is predicted by the Drude model. This behavior, which have often been observed in many correlated metals,[2] indicates that the incoherent character in the mid-infrared region might be rather strong.[4]
The observed peaks of the SrO3 compounds can be assigned according to their electronic structures shown in Fig. 1. It is noted that, according to the Fermi golden rule, the - transition should be dominant in . The assignments for the SrZrO3 peaks were already given. For SrMoO3, the 5.0 eV and 8.5 eV peaks are observed clearly, as shown in Fig. 3(b). These two peaks can be assigned as O 2 Mo 4 and O 2 Mo 4 transitions. For SrRuO3, the 3.0 eV, 6.0 eV, and 10 eV peaks shown in Fig. 3(c) can be assigned as O 2 Ru 4 , O 2 Ru 4 , and O 2 Sr 4 transitions, respectively, according to our previous report.[6] Note that the d-d transition between the lower and the upper Hubbard bands is located around 1.7 eV, but too weak to be clearly seen in this compound.[6]
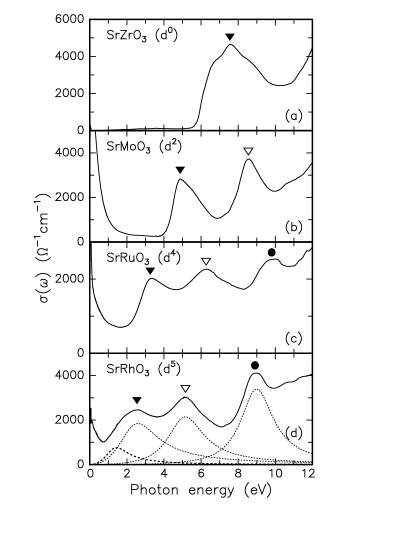
The interband transitions in SrRhO3 can be similarly assigned for the case of SrRuO3. However, the lowest interband transition near 2.5 eV is quite asymmetric with a broad tail in the low energy region, compared with the corresponding one in SrRuO3. From the electronic structure shown in Fig. 1(c), we fitted this peak with two Lorentz oscillators, where a lower energy peak with a relatively small strength can be assigned as the d-d transition between the Hubbard bands. The fitting results are represented by the dotted lines in Fig. 3(d). From this fitting, the 1.6 eV, 2.6 eV, 5.2 eV, and 9.0 eV peaks in SrRhO3 can be assigned as the d-d transition between Hubbard bands, O 2 Rh 4 , O 2 Rh 4 , and O 2 Sr 4 transitions, respectively. The relatively stronger d-d transition in SrRhO3 indicates that the carriers in this compound should be more correlated than those in SrRuO3.
It is interesting to observe systematic trends in the interband transitions of the SrO3 series. As it goes from SrZrO3 to SrRhO3, all of the p-d transitions shift to lower energies. In the photon energy region up to 12 eV, only the O 2 4 transition is observed in SrZrO3, but the O 2 4 transition is additionally observed in SrMoO3. And, in SrRuO3 and SrRhO3, the O 2 Sr 4 transition as well as the O 2 4 transition are observed. Note that as the atomic number of increases, the O 2 4 transitions shift to the lower energy side. In addition, the peak interval between the O 2 4 and the O 2 4 transitions decreases. These interesting trends in peak positions should be originated from the systematic changes of and .
C Systematic trends in and
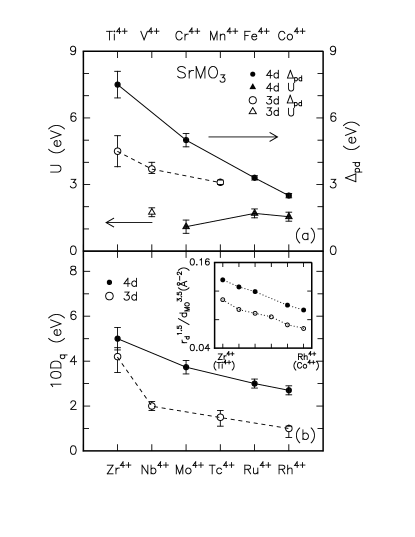
Figure 4(a) shows a systematic trend in the values, which are estimated from the position of the O 2 4 transition. As the atomic number increases, decreases. According to J. B. Torrance et al.’s work with the ionic model,[23] the change of with the atomic number of a transition metal is attributed mainly to the change in electronegativity (or ionization energy) of a transition metal; as the electronegativity of a transition metal becomes larger, the decreases. So, the decrease of in 4 SrO3 can be explained by the larger electronegativity of with its atomic number increasing.
Figure 4(b) shows a systematic trend in the 10 values, which are estimated from the peak position difference between the O 2 4 and the O 2 4 transitions. The 10 of SrZrO3 is approximately estimated to be 5 eV, as shown in Fig. 2. The value of SrMoO3, 3.8 eV, is comparable to that in Mo 4-bands of double perovskite Sr2FeMoO6, 4 eV, from x-ray absorption spectroscopy.[24] SrRhO3 is estimated to have 10 2.6 eV, a little smaller than that of SrRuO3, i.e., 3 eV. It is noted that the decreases with the increasing atomic number of . It is generally accepted that, as the overlap (or covalency) between the O 2- and the -orbital becomes stronger, becomes larger. So, the decrease of the in the 4 SrO3 series can be understood as the shrinking of the -orbitals, and the resultant weakening of the covalency between the 4- and the O 2-orbitals with the increasing atomic number. For a quantitative analysis, we estimate the covalency strength as the p-d matrix element with the -bonding, , suggested by W. A. Harrison.[25, 26] Here, and are the radial size of the -orbital[25] and the distance between the and the O ions, respectively. As shown in the inset of Fig. 4(b), the value of in the 4 compounds decreases with increasing atomic number of , consistent with the decrease of . This suggests that the p-d covalency should play a crucial role in determining the value.[27]
D Comparison with 3 transition metal oxides
We also display the reported results on some 3 SrO3 with a 3 transition metal = Ti, V, Mn, and Co in Fig. 4. Most of the displayed results were determined from in the same way as was adopted in this paper. Note that we include only the optical results except for the 10 value of SrCoO3. In Fig. 4(a), the values of in the 3 SrO3 series are displayed as the open circles.[22, 28, 29] Similar to the case of the 4 TMO, decreases as the atomic number of increases. [While there are no optical reports on metallic SrFeO3 and SrCoO3, photoelectron spectroscopy (PES) results claimed that their values be nearly zero.[30, 31]] However, the magnitudes of in 4 SrO3 are relatively larger than those of 3 SrO3 with the same electron occupancy in -orbitals. As mentioned earlier, the systematic change of is attributed to the change in electronegativity. The larger values in the 4 SrO3 series than those in the 3 SrO3 series can be also explained by the smaller electronegativity for 4 transition metals.[32]
In Fig. 4(b), the reported values of in the 3 SrO3 series are plotted as the open circles.[22, 28, 31, 33] The general trend of in the 3 series is also similar to that in the 4 series. It is interesting to see that the of 4 SrO3 is larger than that of 3 SrO3. This behavior is consistent with the larger values of in 4 SrO3 than those in 3 SrO3, shown in the inset. It is evident that the more extended 4-orbitals induce stronger p-d covalency, which causes the values of the 4 oxides to be larger than those of the 3 oxides.
While the high-spin configuration is more prevalent in 3 TMO, the low-spin configuration can be more easily found in 4 SrO3. This behavior should be closely related to the relatively larger values in the 4 SrO3 series. The spin-configuration in TMO is determined according to the relative magnitude of and : a high-spin configuration for , and a low-spin configuration for . It is known that some 3 TMO, such as Mn- and Fe-oxides, have the high-spin configuration. For example, the values of and in Mn-oxides are estimated to be 1.1 1.8 eV[33] and 3 eV[29], respectively. On the other hand, 4 TMO favor the low-spin configuration with the relatively larger and smaller due to the more extended 4-orbitals. For Ru-oxides, the values of and are estimated to be 3 eV and 0.5 0.6 eV,[12, 34] respectively. Although there is no report about in SrRhO3, the large value of 2.6 eV strongly suggests that this compound should have the low-spin configuration. Because the Rh 4-orbitals become more extended in the Rh3+ state than in the Rh4+ state, an insulating 4 LaRhO3 material with a Ru3+ state is very likely to be a band-insulator which has fully-occupied orbitals in the low-spin configuration.
In the 3 TMO, the character of the low energy charge excitations has been investigated intensively.[2, 10, 11] According to Zaanen, Sawatzky, and Allen’s picture,[35] the charge excitation should be the - transition between the Hubbard bands, if . This is classified as the Mott-Hubbard regime. If , the low energy excitation should be a - transition, and this regime is classified as the charge transfer regime. While the early 3 TMO are classified to be in the Mott-Hubbard regime (), the late 3 TMO mainly fall in the charge-transfer regime (), implying some kind of crossover between the two regimes.[2, 10] This behavior is related to the increase of and the decrease of as the atomic number of a transition metal increases.
To find the character of the low energy charge excitation in the 4 SrO3 series, we estimated the values of from the position of the d-d transition between the Hubbard bands in . The values of for SrMoO3 and SrRuO3 are estimated from the previous studies. [6, 36] Note that the value obtained from is usually somewhat smaller than that measured from PES, due to the exciton effects, but its difference between optical spectroscopy and PES is usually less than 1.0 eV.
In Fig. 4(a), the values of for the 4 SrO3 series are plotted as solid triangles. It appears that the magnitude of in 4 SrO3 is relatively smaller than that in 3 SrO3. As shown in Fig. 4(a), the value of 2 eV in SrVO3 ()[28] is comparable to those of SrRuO3 and SrRhO3, 1.6 - 1.7 eV. Generally, the value increases as the size of the -orbitals decreases. Because the -orbital shrinks as the the atomic number increases, the late 3 SrO3, such as SrFeO3 () and SrCoO3 (), are expected to have larger than the early 3 SrVO3, as has been confirmed by many PES studies. [2, 11] From this, it is clear that the value of SrRuO3 and SrRhO3 should be smaller than those of SrFeO3 and SrCoO3. [37] So, we can say safely that 4 SrO3 have smaller than 3 SrO3, which is quite natural due to the more extended nature of the 4-orbitals.
The larger value of than indicates that all of the 4 SrO3 compounds investigated in this study should belong to the Mott-Hubbard regime. From our studies on SrRuO3 and SrRhO3, the magnitude of , 2.6 - 3.0 eV, is larger than that of , 1.6 - 1.7 eV, which indicates that even these compounds belong to the Mott-Hubbard regime. This implies that these 4 TMO can be used for investigating the Mott-Hubbard transition with the el-el correlation. Indeed, the importance of the el-el correlation has been observed in ruthenates and molybdates,[6, 7] This was rather surprising, since it was thought that the el-el correlation effects should be insignificant in 4 TMO due to the extended nature of the 4-orbitals. And, due to the small value of , the multiplicity of the 4 orbitals might play important roles in physical properties of some 4 TMO.[38] It is highly desirable to reinvestigate physical properties of some 4 TMO in view of the correlation effects.
IV Summary
We reported quantitative studies on physical parameters such as charge transfer energy , on-site Coulomb repulsion energy , and crystal field splitting energy 10 of the perovskite-type of various 4 SrO3 ( = Zr, Mo, Ru, and Rh) by optical conductivity analyses. While the systematic changes of these parameters with the transition metal are similar to those for the case of 3 transition metal oxides, their magnitudes are different; the and the 10 values are relatively larger, while the value is relatively smaller. These behaviors are explained by the more extended character in 4-orbitals than in 3-orbitals, which distinguishes the physical properties of the 4 compounds from those of the 3 ones. The relatively larger is closely related to the low-spin configuration in 4 SrO3. Due to the relatively smaller and larger , it is very likely that most 4 transition metal oxides lie in the Mott-Hubbard regime. Although their values are relatively small, some intriguing physical phenomena with the correlation effects could occur in 4 transition metal oxides.
Acknowledgements.
We would like to thank Jaejun Yu, S.-J. Oh, and S. D. Bu at SNU and D. Y. Jung at SKKU for useful discussions. This work was supported by the Ministry of Science and Technology through the Creative Research Initiative program, and by KOSEF through the Center for Strongly Correlated Materials Research. The experiments at PLS were supported by MOST and POSCO.REFERENCES
- [1] P. A. Cox, Transition metal oxides (Clanrendon press, Oxford, 1992).
- [2] M. Imada, A. Fujimori, and Y. Tokura, Rev. Mod. Phys. 70, 1039 (1998).
- [3] Y. Maeno, H. Hashimoto, K. Yoshida, S. Nishizaki, T. Fujita, J. G. Bednorz, and F. Lichtenberg, Nature 372, 532 (1995).
- [4] P. Kostic, Y. Okada, N. C. Collins, Z. Schlesinger, J. W. Reiner, L. Klein, A. Kapitulnik, T. H. Geballe, and M. R. Beasley, Phys. Rev. Lett. 81, 2498 (1998). Y. S. Lee et al., cond-mat/0205526.
- [5] Y. S. Lee et al., Europhys. Lett. 55, 280 (2001). Y. S. Lee et al., Phys. Rev. B 64, 165109 (2001).
- [6] J. S. Lee, Y. S. Lee, T. W. Noh, K. Char, Jonghyuk Park, S.-J. Oh, J.-H. Park, C. B. Eom, T. Takeda, and R. Kanno, Phys. Rev. B 64, 245107 (2001).
- [7] T. Katsufuji, H. Y. Hwang, and S.-W, Cheong, Phys. Rev. Lett. 84, 1998 (2000).
- [8] J. S. Lee, Y. S. Lee, K. W. Kim, T. W. Noh, J. Yu, T. Takeda, and R. Kanno, Phys. Rev. B 64, 165108 (2001).
- [9] T. Mizokawa, L. H. Tjeng, G. A. Sawatzky, G. Ghiringhelli, O. Tjernberg, N. B. Brooks, H. Fukazawa, S. Kakatsuji, and Y. Maeno, Phys. Rev. Lett. 87, 077202 (2001).
- [10] T. Arima, Y. Tokura, and J. B. Torrance, Phys. Rev. B 48, 17006 (1993).
- [11] A. E. Bocquet, T. Mizokawa, K. Morikawa, A. Fujimori, S. R. Barman, K. Maiki, D. D. Sarma, Y. Tokura, and M. Onoda, Phys. Rev. B 53, 1161 (1996).
- [12] J. Okamoto, T. Mizokawa, A. Fujimori, I. Hase, M. Nohara, H. Takagi, Y. Takeda, and M. Takano, Phys. Rev. B 60, 2281 (1999).
- [13] K. Yamaura and E. Takayama-Muromachi, Phys. Rev. B 64, 224424 (2001).
- [14] S. Yamaoka, M. Akaishi, H. Kanda, T. Osawa, T. Taniguchi, H. Sei, and O. Fukunaga, J. High Pressure Inst. Jpn. 30, 249, (1992).
- [15] R. Agarwal, Z. Singh, and Venugopal, J. Alloys Compounds 282, 231 (1999).
- [16] H. J. Lee, J. H. Jung, Y. S. Lee, J. S. Ahn, T. W. Noh, K. H. Kim, and S.-W. Cheong, Phys. Rev. B 60, 5251 (1999).
- [17] J. Orenstein and D. H. Rapkine, Phys. Rev. Lett. 60, 968 (1988).
- [18] SrNbO3, which has barely been synthesized, is known to be a Pauli paramagnetic band metal, similar to SrMoO3 [H. Hannerz et al., J. Solid State Chem. 147, 421 (1999)]. SrTcO3 has not been synthesized. And, SrPdO3 is a non-perovskite material.
- [19] P. B. Allen, H. Berger, O. Chauvet, L. Forro, T. Jarlborg, A. Junod, B. Revaz, and G. Santi, Phys. Rev. B 53, 4393 (1996).
- [20] F. Wooten, Optical Properties of Solids (Academic press, New York and London, 1972).
- [21] F. Gervais, Handbook of optical constants of Solid II, edited by Edward D. Palik (Academic press, San diego, 1991).
- [22] K. van Benthem, C. Elsässer, and R. H. French, J. Appl. Phys. 90, 6156 (2001).
- [23] J. B. Torrance, P. Lacorre, C. Asavaroengchai, and R. M. Metzger, Phyica C 182, 351 (1991).
- [24] J. H. Jung et al., (unpublished).
- [25] W. A. Harrison, Electronic structure and Physical Properties of Solids (Freeman, San Francisco, 1980).
- [26] The p-d matrix element with the -bonding , and the p-d matrix element with the -bonding . Here, ,[25] and represents the anisotropic covalency strength of the O 2 orbitals with the - and the -orbitals. So, the quantity, can be a parameter related to the 10 between the - and the -orbitals.
- [27] S. Sugano and R. G. Shulman, Phys. Rev. 130, 517 (1963).
- [28] H. F. Pen, M. Abbate, A. Fujimori, Y. Tokura, H. Eisaki, S. Uchida, and G. A. Sawatzky, Phys. Rev. B 59, 7422 (1999). M. J. Rozenberg, G. Kotliar, H. Kajueter, G. A. Thomas, D. H. Rapkine, J. M. Honig, and P. Metcalf, Phys. Rev. Lett. 75, 105 (1995).
- [29] J. H. Jung, K. H. Kim, D. J. Eom, T. W. Noh, E. J. Choi, J. Yu, Y. S. Kwon, and Y. Chung, Phys. Rev. B 55, 15489 (1997).
- [30] A. E. Bocquet, A. Fujimori, T. Mizokawa, T. Saitoh, H. Namatame, S. Suga, N. Kimizuka, Y. Takeda, and M. Takano, Phys. Rev. B 45, 1561 (1992).
- [31] R. H. Potze, G. A. Sawatzky, and M. Abbate, Phys. Rev. B 51, 11501 (1995).
- [32] As the Madelung potential difference between a transition metal and O sites, increases, so does . Because the lattice constants of 4 SO3 are larger than those of 3 SO3, is expected to be smaller in 4 SO3 than in 3 SO3. So, the contribution of cannot explain the larger of 4 SO3 than those of 3 SO3.
- [33] Y. Moritomo, T. Arima, and Y. Tokura, J. Phys. Soc. J. 64, 4117 (1995). K. Takenaka, Y. Sawaki, R. Shiozaki, and S. Sugai, Phys. Rev. B 62, 13 864 (2000).
- [34] D. Singh, J. Appl. Phys. 79, 4818 (1996).
- [35] J. Zarren, G. A. Sawaksy, and J. W. Allen, Phys. Rev. Lett. 55, 418 (1985).
- [36] The value of SrMoO3 is regarded as that of a Mott insulator Y2Mo2O7 with a Mo4+ state [Y. Taguchi, K. Ohgushi, and Y. Tokura, Phys. Rev. B 65, 115102 (2002)].
- [37] From PES results, the value of SrRuO3 is 3 eV,[12] while that of SrFeO3 is 7.8 eV.[30]
- [38] J.-H. Park, L. H. Tjeng, A. Tanaka, J. W. Allen, C. T. Chen, P. Metcalf, J. M. Honig, F. M. F. de Croot, and G. A. Sawatzky, Phys. Rev. B 61, 11 506 (2001) and the references therein.