Influence of internal disorder on the superconducting state in the organic layered superconductor -(BEDT-TTF)2Cu[N(CN)2]Br
Abstract
We report high-sensitivity AC susceptibility measurements of the penetration depth in the Meissner state of the layered organic superconductor -(BEDT-TTF)2Cu[N(CN)2]Br. We have studied nominally pure single crystals from the two different syntheses and employed controlled cooling procedures in order to minimize intrinsic remnant disorder at low temperatures associated with the glass transition, caused by ordering of the ethylene moieties in BEDT-TTF molecule at K. We find that the optimal cooling procedures (slow cooling of -0.2 K/h or annealing for 3 days in the region of ) needed to establish the ground state, depend critically on the sample origin indicating different relaxation times of terminal ethylene groups. We show that, in the ground state, the behavior observed for nominally pure single crystals from both syntheses is consistent with unconventional -wave order parameter. The in-plane penetration depth is strongly linear, whereas the out-of-plane component varies as . In contrast, the behavior of single crystals with long relaxation times observed after slow (-0.2 K/h) cooling is as expected for a -wave superconductor with impurities (i.e. ) or might be also reasonably well described by the -wave model. Our results might reconcile the contradictory findings previously reported by different authors.
pacs:
74.70.Kn, 74.25.Ha, 74.25.-q, 74.62.BfI Introduction
Since the discovery of superconductivity in -BEDT-TTF based materials a decade agoUrayama:CHL:NCS ; Kini:IOC:Br , the question of pairing symmetry has remained as one of the most intriguing issues. From the very beginning, these materials have attracted a lot of interest, not only because they achieved the highest superconducting (SC) transition temperatures () among organic materials, but also because of their similarities to the high-temperature cuprate superconductors. First, the -(BEDT-TTF) (abbreviated as -(ET)) are strongly anisotropic, quasi-two-dimensional materials, with a very weak interplane coupling. This feature is due to the crystalographic structure, in which orthogonally aligned BEDT-TTF dimers form 2D conducting layers sandwiched between the polymerized anion () layers. Second, antiferromagnetic (AF) and SC phases occur next to one another, which suggests that electron correlations play significant role in the establishment of the ground state. Indeed, the ground state of -(BEDT-TTF)2Cu[N(CN)2]Cl material is an insulating AF phase with mildly canted spinsMiyagawa:PRL:Cl ; Pinteric:EJB:Cl , while the ground state of -(BEDT-TTF)2Cu[N(CN)2]Br (abbreviated as -(ET)2Br) and -(BEDT-TTF)2Cu(NCS)2 (abbreviated as -(ET)2NCS) is a SC phase. In the former, the applied pressure supresses AF state and stabilizes SC stateLefebvre:PRL:Cl , whereas by deuterization of -(ET)2Br, the ground state is gradually pushed from SC toward AF stateTaniguchi:PRB:Br . The phase diagram is, therefore, quite similar to that of the cuprates if doping is replaced by pressure or deuterization. Third, the normal state has some properties that are distinct from conventional metals, supporting the importance of the electron correlations. In particular, the Knight shift decreases significantly below about 50 K suggesting a suppression of density of states, that is the appearance of a pseudogap near the Fermi energy Wzietek:JP1:ET . A broad dip in the electronic density of states around Fermi energy was also observed by STM measurements below about the same temperatureArai:SYM:NCS . Further, there is a peak in at about 50 K, where is the nuclear spin-lattice relaxation time, which suggests the presence of short range AF correlations Wzietek:JP1:ET . This peak disappears under pressure concomitantly with superconductivity.
The presence of significant electron correlations strongly favors the possibility of an unconventional SC. Results in favor of -wave order parameter have been obtained by different experimental techniques. 13C NMR measurements showed that the spin-lattice relaxation rate follows dependence at very low temperatures. This result, together with the Knight shift experiment, provides evidence for spin singlet pairing with nodes in the gapMayaffre:PRB:Br . The low temperature specific heatNakazawa:PRB:Br , as well as the thermal conductivityBelin:PRL:NCS , also showed a power-law behavior and , respectively. Further, magnetic penetration depth , measured by microwave cavity perturbationAchkir:PRB:NCS , muon-spin relaxationLe:PRL:ET , tunnel diode oscillatorCarrington:PRL:ET and AC susceptibilityKanoda:PRL:NCS ; Pinteric:PRB:Br , also displayed the power law behavior, usually in the form of a and/or a behavior for at low temperatures.
Recent angle resolved measurements of SC gap structure using STMArai:PRB:NCS and thermal conductivityIzawa:PRL:NCS clearly showed the fourfold symmetry in the angular variation, characteristic of the -wave superconducting gap. Both measurements have revealed that nodes are directed along the directions rotated by 45 degrees relative to the in-plane crystal axes, indicating the -wave superconductivity. Such a nodal structure indicates that both Fermi surfaces (oval-shape quasi-two-dimensional hole cylinder band and an open quasi-one-dimensional bandXu:PRB:NCS ) should participate in SC pairing in contrast with theoretical predictions of superconductivity induced by AF spin fluctuationsLouati:PRB:ET .
In contrast, some other penetration depth studiesHarshman:PRL:NCS ; Lang:PRL:NCS ; Dressel:PRB:ET , as well as the most recent specific heat measurementsElsinger:PRL:Br ; Muller:PRB:NCS , led to results favoring conventional -wave order parameter. In particular, a strong-coupling -wave order parameter was claimed to be observed in the latter experiments.
The question arises what is the source of the conflicting results and how could this discrepancy be resolved. As far as experimental determination of in the mixed state is concerned, the complex vortex dynamics might present a serious problem already at fields as low as 70–300 Oe, as pointed out by Lee et al.Lee:PRL:NCS . Further, additional complications might be due to an order-disorder transition that bears glassy features, taking place at K for -(ET)2Br or at K and K for -(ET)2NCSAkutsu:PRB:ET ; Muller:PRB:ET . The transition region is situated between 65 K and 85 K, and between 45 K and 75 K for -(ET)2Br and -(ET)2NCS systems, respectively. The transition is ascribed to the gradual freezing down of the remaining motion of the ethylene groups of the BEDT-TTF molecules that are thermally activated at high temperatures between the two possible conformations. That is, the relative orientation of the outer C-C bonds can be either eclipsed or staggered. Upon lowering the temperature, the former and latter are adopted for -(ET)2Br and -(ET)2NCS, respectively. X-ray diffraction measurements showed that at 125 K (CH2)2 groups are ordered in average in the whole bulkGeiser:PHC:ET . However, the passage through the region of glassy transition appears to play a crucial role regarding the level of residual intrinsic disorder at low temperatures. This might be also due to the anomalous changes in thermal expansion behavior inside the same temperature regionKund:PHB:Br ; Watanabe:JSJ:Br . Rapid cooling rates are reflected in smaller resistivity ratio between and and larger resistivity humps centered at about 60 KSu:PRB:Br ; Taniguchi:PRB:Br . The understanding of transport properties in the normal state is further complicated by the fact that the standard resistivity behavior that resembles a semiconducting state above 100 KBuravov:JP1:Br , whereas it becomes metallic below, is not reported for all synthesesSchweitzer . In the latter case, samples display a metallic behavior in the whole temperature range between room temperature (denoted as RT) and . In addition, indications are given that some Cu(II) may replace regular Cu(I) during synthesis, affecting the resistivity behavior Montgomery:SYM:Br . The correlation between different mean free path in samples of different syntheses and presence of Cu(II) ions was also suggestedMielke:PRB:Br . Further, sample dependence and relaxation effects were also observed in the magnetization measurement results for -(ET)2BrTaniguchi:SYM:Br . Samples of one synthesis show two peaks in the magnetization vs. field () curve, in contrast to crystals of another synthesis that show only one. Finally, the observed anomalous cooling rate dependence of curve was attributed to the change in the resistivity curves and remnant disorder in the sample.
In an attempt to reconcile the existing contradictions, and determine the pairing symmetry of the genuine SC ground state, we have undertaken an investigation that covered a broad range of single crystals of various syntheses and in which the influence of thermal cycling and sample history was checked in carefully designed experiments. We have performed a high-resolution AC susceptibility measurements in the Meissner state in the two field geometries, i.e. when AC field was parallel and perpendicular to the crystal planes. A quantitative data analysis, we have elaborated with scrutiny to account for the demagnetization correction in the latter geometry, enabled us to get a full characterization of each sample under study clarifying in this way a previously suspected sample dependence. Indeed, our experiments unfold that cooling procedures in the region of the glass transition, necessary to establish the bulk SC ground state, critically depend on the sample origin. In particular, our results demonstrate that the low temperature state is critically determined by time scale of experiment in the region of the glass transition, revealing in that way different relaxation times of terminal ethylene groups in samples from two distinct syntheses studied in the most detail. We show that in the ground state, the behavior observed for nominally pure single crystals from both syntheses is consistent with unconventional -wave order parameter, that is the low-temperature in-plane and out-of-plane superfluid density is proportional to and , respectively. However, the behavior of the superfluid density observed after standard slow cooling for single crystals with long relaxation times deviates from that found in the ground state. It is as expected for a -wave superconductor with impurities or might be reasonably well described by the -wave model. These results may give a solution to a decade long mystery in regard to the symmetry pairing in -BEDT-TTF superconductors. A preliminary report was given in Ref. Tomic:PHC:SC, .
II Experimental technique
Measurements of the complex AC susceptibility () were performed using a commercial AC susceptometer (CryoBIND/Sistemprojekt, Zagreb). The sensitivity of the system, expressed in equivalent magnetic moment, was emu in the broad temperature range between 1.5 K and cryo . Measurements were performed with = 14 mOe at = 231 Hz. Gold 0.07% iron - copper thermocouple was used as a thermometer. The sample was placed in the upper one of the two identical secondary coils immersed in the liquid helium bath, positioned in such a way that applied AC field was either perpendicular or parallel to the conducting planes of the single crystals under study. In the remainder of the paper, the case of magnetic field aligned with the b crystallographic axis, i.e. perpendicular to the high conducting ac crystallographic planes, is denoted by plane, while the case of magnetic field direction laying inside the ac crystallographic plane is denoted by plane. In order to probe the sample in the Meissner state care was taken to reduce the amplitude of the AC field () until the component was independent of ( 42 mOe) and the component was negligible. No frequency dependence (13 Hz 2 kHz) was observed for 1 Oe. In addition no influence of the Earth’s field was observed: runs performed with compensation of the Earth’s field gave the same results. This is in accordance with the fact that the reported values for lower critical magnetic field , corrected for demagnetization, are far above the Earth’s field for all temperatures below 8 K. In this temperature range Oe Hagel:PHC:Br , while the value of the Earth’s field determined in our laboratory is Oe Drobac:JMM:tech .
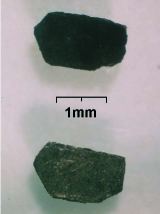
The calibration of the system was performed with a piece of specially and carefully designed Niobium foil, which we will refer to, in the remainder of the paper, as the reference sample. For each -(ET)2Br single crystal, a special reference sample was created independently to ensure that its dimensions and the shape were as close as possible to the original (see Fig. 1). We start with the conventional formula, which relates the induced voltage on the detection coil , the measured susceptibility , the demagnetization factor , the volume and the internal susceptibility , that is corrected for the demagnetization effect :
| (1) |
Here we have taken into account that measured samples are much smaller than the detection coil. If we use a conventional calibration assumption that the susceptibility for Niobium reference sample at low temperatures can be taken to be -1, we can finally determine the internal value of the susceptibility according to formula
| (2) |
where index r designates the reference sample. When the AC field was parallel to the crystal planes, the demagnetization effect could be neglected, meaning that the middle factor in Eq. (2) can be simply replaced by unity. In order to correct the measured data for the demagnetization factor for the AC field perpendicular to the crystal planes, we have developed a method, which strongly reduces the experimental error in to less than 1% and allows us to get the reliable absolute value of the penetrated volume for this geometry, as well. The latter quantity directly determines the penetration depth and the superfluid density, as we show in Sections III.2 and III.3. In the following, we argue and show that our claim is justified.
Our starting point is that the reference sample represents a perfect copy of the sample under study (Fig. 1), implying very close values of respective demagnetization factors and . Since the -(ET)2Br sample is almost completely diamagnetic in this geometry, we can use the approximation . Therefore, demagnetization effects for both samples must be very close in value and the middle factor in Eq. (2) in the first order of approximation can be replaced by unity. Further, in order to improve precision and eliminate a small remaining difference in demagnetization effect, the middle factor in the second order of approximation is calculated by the following procedure. Both -(ET)2Br and the reference sample were taken to be fully superconducting disks (that is thin cylinders with aspect ratio of the length and the diameter of about 0.4) with the same face area and the same thickness as their originals. We consider the disk approximation to be more suitable for description of the real sample than the elipsoid one, used by authors of Ref. Taniguchi:PRB:Br, . We base this assertion on the fact that the former approximation better describes rather sharp sample edges, which might give a substantial contribution to the demagnetization factor. The middle factor in Eq. (2) is then given by the calculated ratio of diamagnetic effects for these two bodies, . The systematic error due to the approximation of the specific shape of samples to the shape of the disk obviously cancels out by division. Numerical data for the demagnetization factor for the disk were taken from the literature Crabtree:PRB:tech .
In order to calculate the area and the thickness, dimensions of both -(ET)2Br and reference sample were carefully measured with a high precision of 1%. The precision was verified by the following procedure. All significant Niobium reference sample dimensions were measured and the volume calculated. In addition, the same reference sample was weighted and the volume calculated using Niobium density, g/cm3. The difference between two obtained values was always about 1%. Finally, the middle factor in Eq. (2) obtained in this way differs from unity only for a few percent. This shows that the calculation procedure and the starting assumption are valid.
In the end, we estimate that our calibration procedure for plane is accurate in to 33% for close to -1, and to about 50% for . As for the plane, accuracy in is estimated to be about 15% for all measured low-temperature values.
Nominally pure single crystals of -(ET)2Br, originating from two different syntheses had different resistivity ratios ) for similar cooling rates employedKanoda ; Schweitzer . , where is the resistivity measured at temperature just above the SC transition. Single crystals with and obtained by standard slow cooling rate have been labelled as S1 and S2, respectively.
Three different cooling procedures were used to cool samples from RT to 4.2 K. Special care was taken in the temperature range , where relaxation processes appearAkutsu:PRB:ET ; Muller:PRB:ET . For Quenched (denoted as Q) state the sample was cooled down to liquid helium temperature in about one minute, which represents the average speed of about -300 K/min. over the whole temperature range. For Relaxed (denoted as R) state the sample was first cooled to 100 K in about 10 minutes. Between 60 K and 100 K the cooling rate was carefully monitored to amount to about -0.2 K/min. Below 60 K, the sample was finally cooled to 4.2 K in a few minutes. For the Annealed state (denoted as A) the sample was cooled down to liquid nitrogen temperatures in about one hour. Then it was kept between liquid nitrogen temperature and 100 K for three days. Finally, it was cooled down to liquid helium temperature in a few minutes. Samples used in this study were rhombic platelets with face areas between 0.51 and 2.15 mm2 and thickness between 0.29 and 0.70 mm.
III Results and analysis
III.1 Complex susceptibility
Our first important result concerns the influence of cooling rate on the components of the complex susceptibility in the SC state as a function of synthesis procedure. We present the behavior obtained in two principal field geometries. That is plane and plane, as defined in Section II. On the basis of our previous measurements with the magnetic field aligned with the a and c crystallographic axesPinteric:PRB:Br , we know that the specific orientation within the ac crystallographic plane does not influence the obtained result for the penetration depth since the out-of-plane component is a dominant contribution. Therefore, we always made sure that the field was aligned with the largest dimension of the platelet face in order to minimize the demagnetization factor.
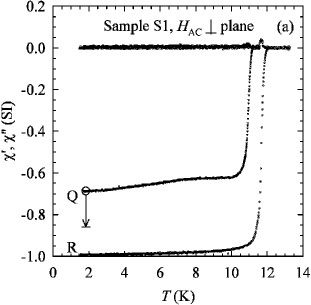
Susceptibility data obtained for sample S1 for two different cooling rates are shown in Fig. 2. We identify the R state, as the ground state. In the ground state, superconductivity sets-in at 12.0 K and 11.5 K, for plane and plane, respectively. We have already reported difference in , as well as anisotropy in the susceptibility for perpendicular and parallel to the planesPinteric:PRB:Br . Here we report, to the best of our knowledge for the first time, the absolute susceptibility values in both field geometries. For plane the sample response is almost completely diamagnetic, while for plane the susceptibility is somewhat smaller in magnitude. Next, our new result points to a huge effect of cooling rate on the susceptibility value and . When sample was cooled faster, the absolute value of susceptibility was smaller, and lower. In other words, the diamagnetic region shrinks in vs. plot. This huge effect is especially emphasized for plane geometry, where the absolute value is almost an order of magnitude smaller for Q state than for R state.
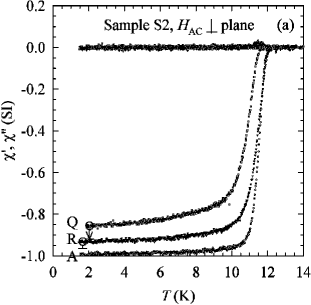
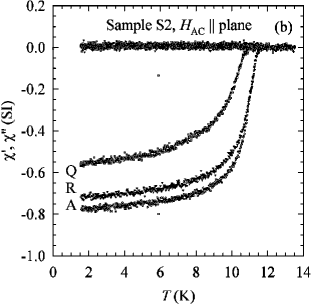
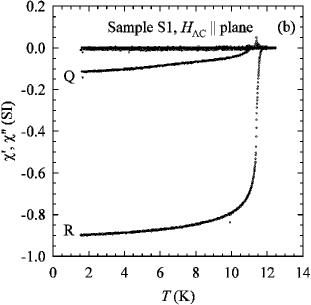
Susceptibility data obtained for sample S2 for three different cooling rates are presented in Fig. 3. The first feature, reflecting a different sample quality, is that the ground state, characterized as before by almost complete diamagnetic response, is established in the A state, and not, as in the case of sample S1, in the R state. For a purpose of clarity, we will refer to the R state of sample S2 as the intermediate state111This state should not, by any means, be identified with the historical notion of the intermediate state in superconductors.inter . The anisotropy of the susceptibility in the ground state is somewhat larger for sample S2 than for sample S1. The second feature is in that the cooling rate effect on the susceptibility value is much smaller for sample S2 compared with the effects obtained for sample S1 (see Fig. 2).
Finally, we point out that the component was negligible, indicating clearly that the measured samples were in the Meissner state.
III.2 Penetration depth
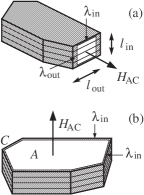
Further, we analyse susceptibility data for hereabove described single crystals of different quality in order to get the penetration depth temperature behavior and the values at zero temperature. In plane geometry we have already argued that the in-plane penetration depth can be neglected in analysis and that the out-of-plane penetration depth can be obtained from the susceptibility data using the formula for a thin superconducting plate in a parallel fieldPinteric:PRB:Br (see Fig. 4(a))
| (3) |
Now we address in more detail plane geometry. The magnetic field is strictly perpendicular to the conducting planes, so is the responding magnetization that expels it out of the bulk. The resultant circulating supercurrents will therefore flow within planes, which will only give contribution to (see Fig. 4(b)). In order to obtain an appropriate formula for the analysis, we start with the generalization of Eq. (3). We take into account that the ratio between the doubled penetration depth and the sample width in the direction of field penetration is the ratio between the volume penetrated by the magnetic field and the whole sample volume . Therefore,
| (4) |
We note that, if the sample has the shape of the platelet, the magnetic field penetrates along the whole edge of the face. We can rewrite Eq. (4) as
| (5) |
where is circumference, area of the platelet face and the in-plane penetration depth (see Fig. 4(b)).
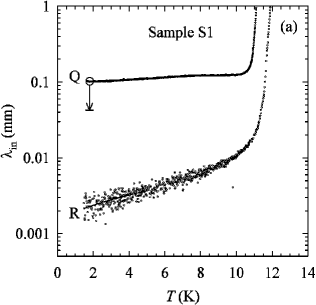
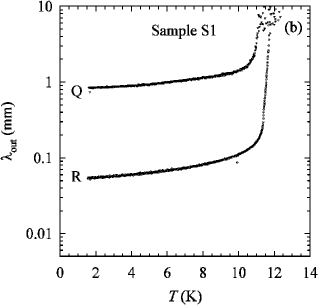
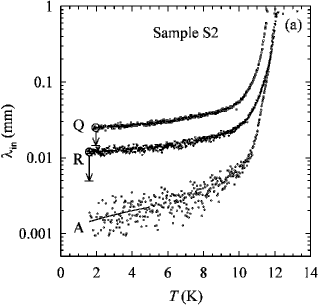
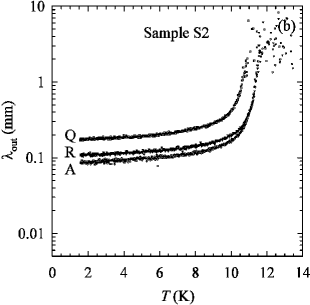
Our second important result concerns the temperature dependence of and in the ground state as a function of the synthesis procedure. In Figs. 5 and 6 we show the influence of cooling rate on the anisotropic penetration depth as a function of the sample quality. Note that in the ground state of both samples S1 and S2 the temperature dependence of and at temperatures below about 5 K is well described by the and law, respectively. The upper bound of the fit range (5 K) is given by the general requirement that the genuine low-temperature behaviour of the penetration depth is strictly obeyed only far from the critical region close to . The full lines correspond to the calculated fit to the power law behavior in the temperature range 1.6 K 5 K
| (6) | |||
| (7) |
We get m, m, m, m and m, m, m, m for S1 and S2, respectively. The penetration depth values at 0 K, , observed in the ground states of both samples, are in a very good accordance with values for the penetration depths given in the literature Pinteric:PRB:Br ; Carrington:PRL:ET ; Lang:SCR:org ; Mansky:PRB:NCS ; Tea:PHC:Br ; Dressel:PRB:ET ; Lee:PRL:NCS ; Achkir:PRB:NCS .
A special attention should be given to the relative change of the penetration depth at low temperatures, . We denote the deviation of and from their values at 0 K, in units of , as and , respectively. We find that , and , in the ground state of samples S1 and S2, respectively. First we note that values are in perfect accordance for both samples confirming that they are in the same – ground – state. Second, a difference between and values for almost an order of magnitude proves a strong anisotropy in physical properties between the two orientations. This also confirms our choice for the exponent in the power law in Eqs. (6) and (7).
Finally, our third important result concerns the intermediate state (R state in sample S2), for which we get , . Unlike for the ground state, the temperature dependences of and are so similar that they cannot be any longer described by different power laws as was the case in the ground state. The obvious solution is to try to fit both penetration depths to the power law behavior
| (8) | |||
| (9) |
which suggests a -wave superconductor with impurities. We get m, m, and m, m. We point out that the fit to the -wave model describe our data almost equally well (see Section III.3). On the other hand, the -wave model fails completely for the penetration depth temperature dependences in the ground state of both samples S1 and S2.
Now we comment penetration depth results for Q state. We find that , and , for samples S1 and S2, respectively. Here we apply the same arguments as in the case of the intermediate state and fit both and to the power law behavior (Eqs. (8) and (9)). We get m, m, and m, m for sample S1 and S2, respectively. The fact that these fits describe the penetration depth data well again suggests a -wave superconductor with impurities. Further, it should be noted that (i) values are larger for Q state than for the intermediate state, suggesting a larger disorder in the former state, (ii) values for sample S1 are significantly larger than ones for S2, suggesting significantly larger disorder in the former sample in Q state. Finally, the result that for sample S1 is close to the crystal size indicates that the bulk superconductivity is not established, allowing us to define the boundary between bulk and nonbulk SC at for plane.
| State | ||||||
| (m) | (m) | (m) | (m) | |||
| Sample S1 | ||||||
| R | 5.2 | 56 | 1.4 | 0.19 | ||
| Q | 60 | 480 | 0.11 | 0.12 | ||
| Sample S2 | ||||||
| A | 2.8 | 69 | 1.1 | 0.15 | ||
| R | 9.2 | 58 | 0.13 | 0.10 | ||
| Q | 22 | 88 | 0.16 | 0.10 | ||
III.3 Superfluid density
In the following, we address the temperature dependance of the superfluid density in order to get information on the symmetry of the superconducting state. We construct the in-plane superfluid density and out-of-plane superfluid density as
| (10) | |||
| (11) |
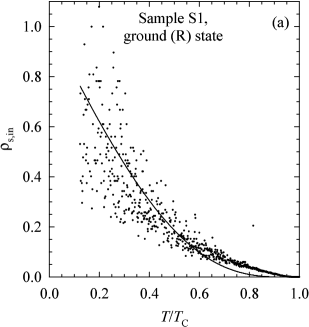
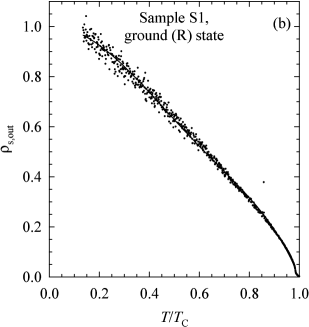
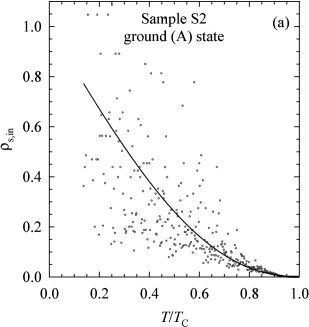
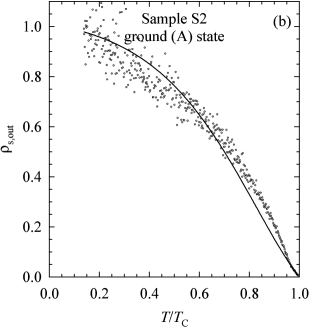
and for the ground state of sample S1 (established in the R state) and for the ground state of sample S2 (established in the A state) as a function of reduced temperature are displayed in Figs. 7 and 8, respectively. There is a strong resemblance in the behavior found for both samples. Note that the leading terms, which describe the low temperature behavior, are and term for and , respectivelyPinteric:PRB:Br . This is to be expected, because and terms describe the low temperature behavior of the and in the ground state. If we expand the leading term to the full polynomial, in order to fit the superfluid density data in the whole temperature region below , we finally obtain for sample S1
| (12) | |||
| (13) |
and for sample S2
| (14) | |||
| (15) |
Taking into account a relatively large experimental error in the penetration depth values (see Figs. 5 and 6), the leading coefficient values might be considered to be almost the same. In addition to the systematic error, there is also a noise, which is a mere consequence of the fact that is calculated according to the expression , so that the absolute noise in is proportional to the relative noise in the penetration depth data. That implies a larger noise for smaller values of , which becomes substantial for of the order of m. Finally, we point out that the shape of curves for the in-plane and the out-of-plane penetration depth in the ground state are qualitatively different from the -wave dependence.
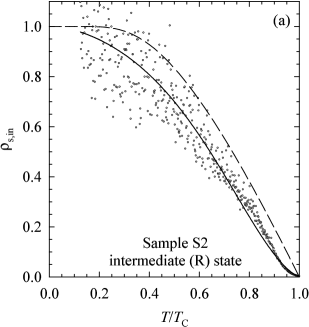
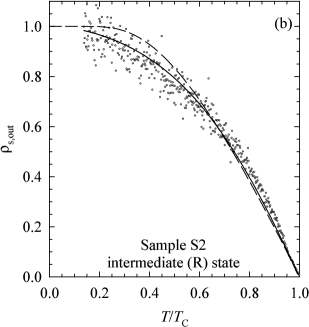
The behavior for the in-plane and out-of-plane superfluid density for the intermediate state of sample S2 (established in R state) is displayed in Fig. 9. Here, data are insensitive to the systematic error at low temperatures, since the correction for drops out from the expression for . Note that the leading term, describing the low temperature behavior, is term for both the in-plane and out-of-plane superfluid density:
| (16) | |||
| (17) |
In order to demonstrate the fact that the superfluid density behavior in the intermediate state is also rather close to the dependence expected for the -wave order parameter behavior, the -wave model dependence is added as a dashed line for both orientations.
IV Discussion
We start discussion by pointing out that the well-defined, ground state properties - complex susceptibility, penetration depth and superfluid density - were essentially reproducible for all studied single crystals from both syntheses S1 and S2. Cooling rate dependent effects were also reproducible, but the observed behavior was the same only for single crystals from the same synthesis, while it differed significantly from the observed behavior for single crystals from the other synthesis.
First, we would like to comment on the anisotropy in . As in the previously published paperPinteric:PRB:Br , we have established that K for and plane geometry cannot be ascribed to the experimental error. We suggest that this anisotropy might be the consequence of the fact that the diamagnetic shielding is no longer effective for plane geometry in the range of 0.5 K below , which is due to small sample dimensions and huge out-of-plane (Josephson-like) penetration depth near . However, we point out that anisotropy has negligible effects, if any, to our data analysis, which is primarily done in the low-temperature region, and therefore does not influence the resulting conclusions.
Second, we address the observed differences in cooling rate effects between samples S1 and S2. As pointed out earlier, both samples show the same behavior in the ground state: almost full diamagnetism for plane, the same temperature dependence and zero-temperature value of the in-plane and the out-of-plane penetration depth, as well as the same superfluid density temperature dependence. However, we note that sample S2 required a completely different cooling procedure with significantly longer time spent in the temperature region around 80 K, compared to sample S1, in order to accomplish the ground state. Moreover, sample S2 is much less sensitive to the cooling rate. That is, the difference regarding low-temperature susceptibility and zero-temperature penetration depth values between A and Q states for sample S2 is much smaller than the difference between R and Q states for sample S1. Both features indicate that (i) the low-temperature state is critically determined by the time scale of experiment in the region of glass transition and (ii) relaxation times of ethylene groups in the single crystals originating from synthesis S2 are much longer than the ones in the single crystals originating from synthesis S1. When the applied time scale is much longer than the relaxation time of the ethylene moieties, the low-temperature state is the ground state. In contrast, if the relaxation time exceeds the time scale of experiment, remnant disorder at low temperatures will be substantial and Q state will be established. Different relaxation times of ethylene groups might also explain why the resistivity ratio ) is much larger for samples from synthesis S1 when standard slow cooling rate is applied. At this stage, we can only speculate about the possible origin of different relaxation times. The experimental observations that the crystals from synthesis S2 show weak metallic behavior, instead of a semiconducting behavior between RT and 100 K observed for samples of synthesis S1, might be of the same origin. Since the RT resistivity values do not differ substantially, we propose that the subtle local variations of impurity level in nominally pure samples from different syntheses might be responsible for the observed differences.
Next we comment on the behavior of the in-plane superfluid density in the ground state. The temperature dependence of the in-plane superfluid density for the -wave superconducting order parameter , where is the angle between the quasiparticle momentum and the axis, within the weak coupling theory is given by Won:PRB:dw ; Pinteric:PRB:Br
| (18) |
The coefficient of the leading term in depends strongly on the ratio of the superconducting transition temperature and the zero temperature superconducting order parameter. A comparison of values for in Eq. (18) to those in Eqs. (12) and (14) suggests that the superconducting order parameter at K is much smaller than that predicted by the weak-coupling limit. As a result, this would also imply that the nodal region, which volume is inversely proportional to the angular slope of the gap near the nodeXu:PRB:SC , occupies a much larger fraction of the phase space at low temperatures. We point out that we have reached the same conclusion already on the basis of previously obtained resultsPinteric:PRB:Br . In the latter case, we did not evaluate from our measurements, but rather we used the values reported in the literature. Following the same procedure as in Ref. Pinteric:PRB:Br, , we can again use uncalibrated data from present measurements and calculate the deviation of from the minimum value at the lowest attainable temperature Pinteric:PRB:Br . Then, if we take the penetration depth value at 0 K given in the literatureLang:SCR:org ; Mansky:PRB:NCS ; Tea:PHC:Br ; Dressel:PRB:ET , m, we get the same result, that is the leading coefficient is much larger than expected in the weak-coupling model. In addition, we point out that the same behavior of for m was reported by Carrington et al.Carrington:PRL:ET . They pointed out that only at m the slope becomes similar to the one reported for high- cuprate superconductors and expected in the weak coupling model. From our present data, we get m for the crossover in-plane penetration depth value.
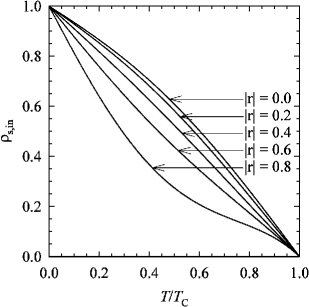
One possibility to interpret our results is to consider the mixture of -wave and -wave order parameter, which corresponds to the superconducting order parameter , with representing the -wave componentWon:PHB:SC . In this case the leading linear coefficient increases with the increase of according to the expression:
| (19) |
The shapes of the superfluid density curves for several values of parameter are given in Fig. 10. For our results, gives a very good agreement, which is, on the other hand, theoretically very unlikely. Recently, an admixture of -wave component with for -(BEDT-TTF)Cu(NCS)2 was suggestedWon:PHB:SC from the analysis of the angular dependent magnetothermal conductivity dataIzawa:PRL:NCS . These data suggest that the -wave instead of -wave pairing is responsible for superconductivity in the -(ET) materials. This implies that both Fermi surfaces participate in pairing in contrast to previous assumptionLouati:SYM:ET . Since in the former case the spin fluctuation model for the -(ET) materials no longer describes the superconductivity pairing, the origin should be found elsewhere. Coulomb interaction, which is responsible for the -wave superconductivity, gives rise to both spin and charge fluctuations, so the obvious solution appears to be that charge fluctuations play the principal role in the -(ET) superconductivity. The value suggests that the nodal lines in pass through the gap between two Fermi surfaces. This is consistent with the -wave model in which the superconductivity is due to charge fluctuations between different groups of dimers. On the other hand, for , the nodal directions cross the 2D circular Fermi surface, and for , the nodal directions cross the 1D Fermi surface. If superconductivity model is generated by charge fluctuations, such a scenario is unlikely to work, since this implies the strong intra Coulomb repulsion in each energy band.
Now, we address the behavior of the in-plane superfluid density in the intermediate state (Fig. 9). Considering the polynomial fit in Eq. (16), we see that the in-plane superfluid density appears to fit very well the -wave model with impurity scattering in the unitary limitHirschfeld:PRB:dw ; Sun:PRB:dw ; Sun:EPL:dw . However, there is a serious discrepancy between our experimental data and the impurity model. First of all, we ascribe the difference between A state (ground state), R state (intermediate state) and Q state to the residual degree of the ethylene disorder. Annealed state we discussed is the ground state with the least disorder in the ethylene groups. It is natural to assume that the ethylene disorder gives rise to the quasiparticle scattering, which changes the -linear dependence of into the -squared dependence. But this is in contradiction with the well established fact that a small disorder depresses dramaticallySun:PRB:dw ; Sun:EPL:dw . In our experiment, it seems that is practically unaffected by the ethylene disorder for the intermediate state, achieved by slow cooling of -0.2 K/min. in the region of the glass transition. Further, taking into account the fact that the increases for at least by a factor of 6, superconducting electron density at 0 K, , decreases at least by a factor of 36. A simple impurity model cannot describe the surprising combination of these two features. On the other hand, the results for other low-temperature states achieved by cooling rates K/min. for sample S1, and for Q state in sample S2 are more consistent with the theory. In these cases both , and therefore are concomitantly influenced by the remnant ethylene disorder. However, it is still difficult to correlate the observed behavior to the impurity model quantitatively. This discrepancy might indicate that the degree of disorder at low temperatures, as defined by the cooling rate in the region of the glass transition, has also a profound influence on electronic correlations, responsible for SC pairing. At this point we would like to recall the result of Kund et al.Kund:PHB:Br showing changes in the crystal structure parameters in the region of the glass transition. It might be that these changes are also susceptible to the cooling rate. In addition, authors of Ref. Taniguchi:PRB:Br, have pointed out that the role of disorder in this class of superconductors might be different than in the other unconventional superconductors due to the vicinity of the Mott insulator in the phase diagram.
Coming back to the intermediate state, we suggest that the indication of the decrease in the superconducting electron density may be related to the reduction of the superconductivity volume. It has been already reported that cooling rates combined by progressive deuteration influence the low-temperature electronic state in -(ET)2Br samplesKawamoto:PRB:Br ; Taniguchi:PRB:Br . Deuterated -(ET)2Br system is situated in the critical region between an insulating AF transition at 15 K and a SC transition at 11.5 K. Despite the slow cooling rate, the deuterated sample gives almost the same as in the hydrogenated -(ET)2Br system, the SC state is not fully established in the bulk. Note that this results strongly resembles what we observed for S2 samples in the intermediate (R) state. In addition, a gradual decrease of the susceptibility below in the deuterated system strongly indicates the inhomogenous nature of the SC state. This is in contrast to what we observe in sample S2, in which the susceptibility curves are rather sharp even in Q state. More rapid cooling rates induce a decrease of and a substantial decrease of SC volume fraction. Authors of Refs. Kawamoto:PRB:Br, ; Taniguchi:PRB:Br, have argued that since the electronic specific heat of rapidly cooled deuterated samples did not show any finite electronic contribution at low temperatures, the missing part of superconducting phase should be considered to be the magnetic insulating phase. The question arises if their conclusion might also be valid in the hydrogenated system. Taking into account the structure of the phase diagram of this class of superconductorsLefebvre:PRL:Cl , we think that this might be the case. However, specific heat data under carefully controlled cooling cycles are needed to resolve this issue.
The most intriguing fact about Fig. 9 is that in the intermediate state the observed data could be well described by the -wave model as well. This gives a possible explanation for the contradictory findings in favor of the -wave and -wave model in the same material. The behavior is obviously strongly influenced by both thermal history as well as synthesis, which suggests that the same material was not measured in the same low-temperature state. We hope that our results could contribute to reconcile contradictory findings met in the past.
V Conclusion
The level of residual disorder and electronic properties at low temperatures are critically determined by the time scale of experiment in the region of the glassy transition and the sample synthesis. This fact imposes an additional requirement to get a reliable description of the SC state and that is to perform a full characterization of the SC state in the sample under study in the same well defined and controlled cooling conditions. The origin of the observed differences can be attributed to the residual ethylene disorder, which might be theoretically considered as the impurity effect.
The in-plane superfluid density of the ground state with the lowest residual ethylene disorder exhibits clear -linear dependence, which is consistent with the -wave model and in contradiction with the -wave model. The leading -linear coefficient is much larger than the one expected for the weak-coupling -wave model. The d+-wave model can remove this numerical discrepancy. However, rather large -wave component needed to fit our data is not consistent with the recent thermal conductivity results.
On the other hand, the in-plane superfluid density of the intermediate state achieved by slow cooling of -0.2 K/min. in samples of one synthesis, as well as in the states achieved by rapid cooling rates ( K/min.) in all studied samples, clearly exhibits the -squared dependence, consistent with -wave superconductivity in presence of impurities. In the intermediate state, the same as in the ground state is accompanied by a relatively large reduction in the superconducting electron density, which cannot be explained within the standard impurity model. In the rapidly cooled states, does reduce concomitantly with , still the depression of is quantitatively too small and the reduction of the superconducting electron density is too large. More work, both theoretical and experimental, is needed to be done to resolve these issues.
Finally, the in-plane superfluid density data in the intermediate state can be relatively well fitted to the -wave model data as well. This fact gives a possible explanation for the contradictory findings in favor of -wave and -wave model in the same material and will hopefully contribute to a long awaiting consensus regarding the pairing symmetry in the -(BEDT-TTF) based superconductors. In this circumstance, specific heat measurements in the same well defined and controlled cooling conditions are highly desirable.
Acknowledgements.
The authors are grateful to K. Kanoda and D. Schweitzer for supplying single crystals of different syntheses used in this research and for very useful discussions. We also thank O. Milat and V. Bermanec for photographing the samples.References
- (1) H. Urayama, H. Yamochi, G. Saito, K. Nozawa, T. Sugano, M. Kinoshita, S. Sato, K. Oshima, A. Kawamoto, and J. Tanaka, Chem. Lett. pp. 55–58 (1988).
- (2) A. M. Kini, U. Geiser, H. H. Wang, K. D. Carlson, J. M. Williams, W. K. Kwok, K. G. Vandervoort, J. E. Thompson, D. L. Stupka, D. Jung, and M.-H. Whangbo, Inorg. Chem. 29, 2555 (1990).
- (3) M. Pinterić, M. Miljak, N. Biškup, O. Milat, I. Aviani, S. Tomić, D. Schweitzer, W. Strunz, and I. Heinen, Eur. Phys. J. B 11(2), 217 (1999).
- (4) K. Miyagawa, A. Kawamoto, Y. Nakazawa, and K. Kanoda, Phys. Rev. Lett. 75, 1174 (1995).
- (5) S. Lefebvre, P. Wzietek, S. Brown, C. Bourbonnais, D. Jérome, C. Mézière, M. Fourmigué, and P. Batail, Phys. Rev. Lett. 85(25), 5420 (2000).
- (6) H. Taniguchi, A. Kawamoto, and K. Kanoda, Phys. Rev. B 59(13), 8424 (1999).
- (7) P. Wzietek, H. Mayaffre, D. Jérome, and S. Brazovskii, J. Phys. I France 6(12), 2011 (1996).
- (8) T. Arai, K. Ichimura, K. Nomura, S. Takasaki, J. Yamada, S. Nakatsuji, and H. Anzai, Synth. Met. 120, 707 (2001).
- (9) H. Mayaffre, P. Wzietek, D. Jérome, C. Lenoir, and P. Batail, Phys. Rev. Lett. 75(22), 4122 (1995).
- (10) Y. Nakazawa and K. Kanoda, Phys. Rev. B 55, R8670 (1997).
- (11) S. Belin, K. Behnia, and A. Deluzet, Phys. Rev. Lett. 81(21), 4728 (1998).
- (12) D. Achkir, M. Poirier, C. Bourbonnais, G. Quirion, C. Lenoir, P. Batail, and D. Jérome, Phys. Rev. B 47(17), 11595 (1993).
- (13) L. P. Le, G. M. Luke, B. J. Sternlieb, W. D. Wu, Y. J. Uemura, J. H. Brewer, T. M. Riseman, C. E. Stronach, G. Saito, H. Yamochi, H. H. Wang, K. D. Kini, A. M. an Carlson, et al., Phys. Rev. Lett. 68(12), 1923 (1992).
- (14) A. Carrington, I. J. Bonalde, R. Prozorov, R. W. Giannetta, A. M. Kini, J. Schlueter, H. H. Wang, U. Geiser, and J. M. Williams, Phys. Rev. Lett. 83(20), 4172 (1999).
- (15) M. Pinterić, S. Tomić, M. Prester, Đ. Drobac, O. Milat, K. Maki, D. Schweitzer, I. Heinen, and W. Strunz, Phys. Rev. B 61(10), 7033 (2000).
- (16) K. Kanoda, K. Akiba, K. Suzuki, T. Takahashi, and G. Saito, Phys. Rev. Lett. 65(10), 1271 (1990).
- (17) T. Arai, K. Ichimura, K. Nomura, S. Takasaki, J. Yamada, S. Nakatsuji, and H. Anzai, Phys. Rev. B 63, 104518 (2001).
- (18) K. Izawa, H. Yamaguchi, T. Sasaki, and Y. Matsuda, Phys. Rev. Lett. 88(2), 027002 (2002).
- (19) Y.-N. Xu, W. Y. Ching, Y. C. Jean, and Y. Lou, Phys. Rev. B 52(17), 12946 (1995).
- (20) R. Louati, S. Charfi-Kaddour, A. Ben Ali, R. Bennaceur, and M. Héritier, Phys. Rev. B 62(9), 5957 (2000).
- (21) D. R. Harshman, R. N. Kleiman, R. C. Haddon, S. V. Chichester-Hicks, M. L. Kaplan, L. W. Rupp, Jr., T. Pfiz, D. L. Williams, and D. B. Mitzi, Phys. Rev. Lett. 64(11), 1293 (1990).
- (22) M. Lang, N. Toyota, T. Sasaki, and H. Sato, Phys. Rev. Lett. 69(9), 1443 (1992).
- (23) M. Dressel, O. Klein, G. Grüner, K. D. Carlson, H. H. Wang, and J. M. Williams, Phys. Rev. B 50(18), 13603 (1994).
- (24) H. Elsinger, J. Wosnitza, S. Wanka, J. Hagel, D. Schweitzer, and W. Strunz, Phys. Rev. Lett. 84(26), 6098 (2000).
- (25) J. Müller, M. Lang, R. Helfrich, F. Steglich, and T. Sasaki, Phys. Rev. B 65, 140509 (2002).
- (26) S. L. Lee, F. L. Pratt, S. J. Blundell, C. M. Aegerter, P. A. Pattenden, K. H. Chow, E. M. Forgan, T. Sasaki, W. Hayes, and H. Keller, Phys. Rev. Lett. 79(8), 1563 (1997).
- (27) H. Akutsu, K. Saito, and M. Sorai, Phys. Rev. B 61(6), 4346 (2000).
- (28) J. Müller, M. Lang, F. Steglich, J. A. Schlueter, A. M. Kini, and T. Sasaki, Phys. Rev. B 65, 144521 (2002).
- (29) U. Geiser, A. J. Schultz, H. H. Wang, D. M. Watkins, D. L. Stupka, J. M. Williams, J. E. Schirber, D. L. Overmyer, D. Jung, J. J. Novoa, and M.-H. Whangbo, Physica C 174, 475 (1991).
- (30) M. Kund, H. Müller, W. Biberacher, K. Andres, and G. Saito, Physica B 191, 274 (1993).
- (31) Y. Watanabe, H. Sato, T. Sasaki, and N. Toyota, Journal of the Physical Society of Japan 60(11), 3608 (1991).
- (32) X. Su, F. Zuo, J. A. Schlueter, M. E. Kelly, and J. M. Williams, Phys. Rev. B 57(22), R14056 (1998).
- (33) L. I. Buravov, N. D. Kushch, V. A. Merzhanov, M. V. Osherov, A. G. Khomenko, and E. B. Yagubskii, J. Phys. I France 2, 1257 (1992).
- (34) D. Schweitzer and M. Schiller, unpublished.
- (35) L. K. Montgomery, R. M. Vestal, K. P. Starkey, B. W. Fravel, M. J. Samide, D. G. Peters, C. H. Mielke, and J. D. Thompson, Synth. Met. 103, 1878 (1999).
- (36) C. H. Mielke, N. Harrison, D. G. Rickel, A. H. Lacerda, R. M. Vestal, and L. K. Montgomery, Phys. Rev. B 56(8), R4309 (1997).
- (37) H. Taniguchi and K. Kanoda, Synth. Met. 103, 1967 (1999).
- (38) S. Tomić, M. Pinterić, M. Prester, Đ. Drobac, and K. Maki, Physica C 364-365, 247 (2001).
- (39) URL http://www.cryobind.com/.
- (40) J. Hagel, S. Wanka, D. Beckmann, J. Wosnitza, D. Schweitzer, W. Strunz, and M. Thumfart, Physica C 291, 213 (1997).
- (41) Đ. Drobac, J. Magn. Magn. Mater. 183, 71 (1998).
- (42) G. W. Crabtree, Phys. Rev. B 16(3), 1117 (1977).
- (43) K. Kanoda, unpublished.
- (44) P. A. Mansky, P. M. Chaikin, and R. C. Haddon, Phys. Rev. B 50(21), 15929 (1994).
- (45) N. H. Tea, F. A. B. Chaves, U. Klostermann, R. Giannetta, M. B. Salamon, J. M. Williams, H. H. Wang, and U. Geiser, Physica C 280, 281 (1997).
- (46) M. Lang, Supercond. Rev. 2, 1 (1996).
- (47) H. Won and K. Maki, Phys. Rev. B 49(2), 1397 (1994).
- (48) D. Xu, S. K. Yip, and J. A. Sauls, Phys. Rev. B 51(22), 16233 (1995).
- (49) H. Won and K. Maki, Physica B 312-313, 44 (2002).
- (50) R. Louati, S. Charfi-Kaddour, A. Ben Ali, R. Bennaceur, and M. Héritier, Synth. Met. 103, 1857 (1999).
- (51) Y. Sun and K. Maki, Phys. Rev. B 51(9), 6059 (1995).
- (52) Y. Sun and K. Maki, Europhys. Lett. 32(4), 355 (1995).
- (53) P. J. Hirschfeld and N. Goldenfeld, Phys. Rev. B 48(6), 4219 (1993).
- (54) A. Kawamoto, K. Miyagawa, and K. Kanoda, Phys. Rev. B 55(21), 14140 (1997).
- (55) M. Tinkham, Introduction to Superconductivity (McGraw-Hill, New York, 1996), p. 25.