[
Density-functional study of the structure and stability of ZnO surfaces
Abstract
An extensive theoretical investigation of the nonpolar (100) and (110) surfaces as well as the polar zinc terminated (0001)–Zn and oxygen terminated (000)–O surfaces of ZnO is presented. Particular attention is given to the convergence properties of various parameters such as basis set, k–point mesh, slab thickness, or relaxation constraints within LDA and PBE pseudopotential calculations using both plane wave and mixed basis sets. The pros and cons of different approaches to deal with the stability problem of the polar surfaces are discussed. Reliable results for the structural relaxations and the energetics of these surfaces are presented and compared to previous theoretical and experimental data, which are also concisely reviewed and commented.
pacs:
PACS numbers: 68.35.Bs, 81.05.Dz, 68.47.Gh]
I Introduction
The II–VI semiconductor ZnO has become a frequently studied material in surface science because of its wide range of technological applications. ZnO is a basic material for varistors, thyristors and optical coatings. In addition, its direct band gap makes it an interesting candidate for blue and UV emitting LEDs and laser diodes.[1] The electronic and structural properties of the ZnO surfaces are in particular important in its applications as chemical sensor in gas detecting systems and as catalyst for hydrogenation and dehydrogenation reactions. In combination with Cu particles at the surface, ZnO is a very efficient catalyst for the methanol synthesis[2] where it is employed in industrial scale. The mechanism behind the enhanced catalytic activity when combined with Cu is poorly understood. However, before this interesting interplay between the ZnO substrate and the Cu particles can be addressed, a thorough understanding of the underlying clean ZnO surfaces is necessary.
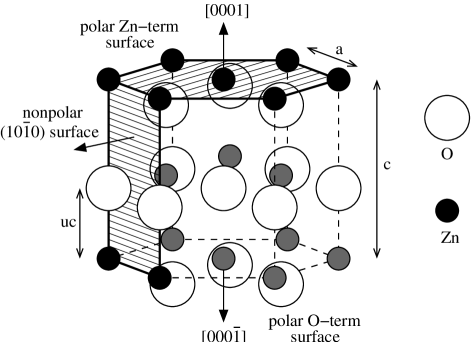
From a physical/chemical point of view, ZnO is a very interesting material because of the mixed covalent/ionic aspects in the chemical bonding. ZnO crystallizes in the hexagonal wurtzite structure (B4) which consists of hexagonal Zn and O planes stacked alternately along the –axis (see Fig. 1). Anions and cations are 4–fold coordinated, respectively, like in the closely related zincblende structure. A tetrahedral coordinated bulk structure is typical for rather covalent semiconductors. On the other hand, ZnO shows great similarities with ionic insulators such as MgO.[3] This is why ZnO is often called the ‘ionic extreme’ of tetrahedral coordinated semiconductors.
Wurtzite crystals are dominated by four low Miller index surfaces: the nonpolar (100) and (110) surfaces and the polar zinc terminated (0001)–Zn and the oxygen terminated (000)–O surfaces (see Fig. 1). By ion sputtering and annealing at not too high temperatures all four surfaces can be prepared in a bulk terminated, unreconstructed state, where the surface atoms only undergo symmetry conserving relaxations. A typical p(11) pattern is observed in low-energy electron diffraction (LEED) and other diffraction experiments.[4, 5, 6, 7] Although in a recent He–scattering experiment[8] it was shown that O–terminated (000) surfaces with p(11) LEED patterns are usually hydrogen covered whereas the clean O–terminated surface exhibits a (31) reconstruction, we will focus in this study on the clean, unreconstructed surfaces of ZnO.
In the present paper, we investigate all four main crystal terminations of ZnO. The fully relaxed geometric structures and the surface/cleavage energies have been calculated using a first-principles density-functional (DFT) method. We have employed both, a local-density (LDA) and a generalized-gradient approximation (GGA) functional. We will discuss the relative stability of the four surfaces and how the surface relaxations of the nonpolar faces are connected to the covalency/ionicity of the chemical bond in ZnO. Finally, a detailed comparison with existing theoretical and experimental results will be given.
The nonpolar (100) surface of ZnO has been the focus of several experimental and theoretical studies. However, the form of the relaxation of the surface atoms is still very controversial. Duke et al.[5] concluded from their best LEED analysis[9] that the top-layer zinc ion is displaced downwards by (Zn)=0.450.1 Å and likewise the top-layer oxygen by (O)=0.050.1 Å, leading to a tilt of the Zn–O dimer of 125∘. No compelling evidence for lateral distortions within the first layer or for second-layer relaxations were obtained, but small improvements could be achieved by assuming a lateral displacement of the Zn ion toward oxygen by (Zn)=0.10.2 Å.[10] The strong inward relaxation of the Zn ion was later confirmed by Göpel at al.[11] in an angle-resolved photoemission experiment. By comparing the relative position of a particular surface state with its theoretically predicted geometry dependence, a Zn displacement downwards by (Zn)=0.4 Å was concluded.
In contrast, Jedrecy et al.[12] found best agreement with their gracing incidence X–ray diffraction data (GIXD) for a structural model where the top-layer zinc atom is displaced downwards by only (Zn)=0.060.02 Å and shifted toward oxygen by (Zn)=0.050.02 Å. However, for their samples they observed a high density of steps and from their best-fit model they predict rather high vacancy concentrations in the first two surface layers with occupancy factors of 0.770.02 and 0.900.04 for the first and second layer, respectively. On the other hand, Parker et al.[13] reported scanning tunneling microscopy (STM) images of the nonpolar (100) surfaces with atomic resolution where large flat terraces are found and no defects are visible in areas as large as 1114 surface unit cells. Due to the small scattering contribution, the position of oxygen could not be determined very accurately in the GIXD experiment of Ref. [12]. The result of the best fit was that O relaxes further toward the bulk than Zn with (O)=0.120.06 Å. This would be very unusual since to our knowledge no (100) wurtzite or (110) zincblende surface structure has been reported where the surface dimers tilts with the cation above the anion.
First theoretical investigations of the (100) surface were done using empirical tight-binding (TB) models. With two very different TB models Wang and Duke[14] found a strong displacement of (Zn)=0.57 Å, whereas Ivanov and Pollmann[15] obtained an almost bulk-like surface geometry. A recent calculation with atomistic potentials based on a shell model[16] predicted (Zn)=0.25 Å and a rather strong upward relaxation of the second-layer Zn of +0.165 Å.
Several ab-initio studies (DFT-LDA,[17] Hartree-Fock (HF),[18] and a hybrid HF and DFT method using the B3LYP functional[19]) employing Gaussian orbitals as basis functions to solve the electronic structure problem favor small inward relaxations of Zn and small tilts of the ZnO–dimers of 2∘–5∘. However, it is questionable, if these studies represent fully converged results. There is only one recent first-principles DFT-LDA calculation using plane waves[20] where larger relaxations with a tilt of 11.7∘ were obtained.
The nonpolar (110) ZnO surface has been less frequently studied than its (100) counterpart. The two tight-binding models[14, 15] predicted the same relaxation behavior for the (110) as for the (100) surface: Wang and Duke[14] found a strong zinc displacement of (Zn)=0.54 Å toward the bulk whereas the TB model of Ivanov and Pollmann preferred an almost bulk-like surface structure. With a first-principles hybrid B3LYP method Wander and Harrison[21] found much smaller relaxations for the (110) surface than for the (100) face, but not all degrees of freedom were relaxed in this study. To our knowledge there has been no quantitative experimental investigation.
| LDA | PBE | Expt. | |
| [Å] | 3.193 (1.7 %) | 3.282 (1.0 %) | 3.250 |
| [Å] | 5.163 (0.8 %) | 5.291 (1.6 %) | 5.207 |
| / | 1.617 | 1.612 | 1.602 |
| 0.3783 | 0.3792 | 0.3825 | |
| [GPa] | 161 | 128 | 143 |
| [GPa] | 9.0 | 11.8 | 9.0–9.5 |
Coming to the polar surfaces, we encounter the fundamental problem that in an ionic model these surfaces are unstable and should not exist. They are so-called ‘Tusker type 3’ surfaces,[25] and with simple electrostatic arguments it can be shown that the surface energy diverges for such a configuration.[25] To stabilize the polar surfaces a rearrangement of charges between the O– and the Zn–terminated surfaces needs to take place in which the Zn–terminated side becomes less positively charged and the O–terminated face less negative. In fact, most polar surfaces show massive surface reconstructions or exhibit facetting to accommodate the charge transfer.[7] Also randomly distributed vacancies, impurity atoms in the surface layers, or the presence of charged adsorbates are possible mechanisms to stabilize polar surfaces. However, the polar ZnO surfaces are remarkably stable, and many experiments suggest that they are in an unreconstructed, clean and fully ordered state.[7] Despite many investigations it is still an open question how the polar ZnO surfaces are stabilized.[7]
Assuming clean and unreconstructed surfaces, the reduction in surface charge density can only occur from a redistribution of the electrons. Negative charge has to be transferred from the O–terminated face to the Zn–terminated side, leading to partially occupied bands at the surface. This so called ‘metallization of the surface’ has been used by all previous ab-initio calculations [26, 27, 7] to model the polar ZnO surfaces and will also be employed in the present study. However, whether or not the surfaces are metallic will depend on the width of the partially occupied bands. From another point of view, if the polar surfaces were stabilized by vacancies, defects or adsorbates, many defect states would be created. Now if we think of somehow averaging over the surface, the defect states would form a partially filled band. In this sense, the ‘metallization’ may be regarded as some ‘mean-field’ description for a situation where many defect states are present.
Several attempts have been made to determine the layer relaxations of the unreconstructed polar surfaces. In an early dynamical LEED analysis Duke and Lubinsky[28] found an outer Zn–O double-layer spacing of =0.607 Å for the Zn–terminated surface and =0.807 Å for the O–terminated face. Unfortunately, this analysis was based on an early bulk structure of ZnO, see Ref. [29], in which the bulk double-layer spacing was assumed to be 0.807 Å instead of 0.612 Å.
For the Zn–terminated surface, it was concluded from the comparison of X–ray photo-diffraction (XPD) data with scattering simulations[30] that any inward relaxation of the surface Zn layer can be ruled out. Coaxial impact-collision ion-scattering spectroscopy[31] (CAICISS) proposed an expansion of by +0.35 Å. Also an expansion of by +0.05 Å for the Zn–terminated surface was found in an GIXD measurement.[32] In this experiment, the X–ray data could best be fitted by assuming a random removal of 1/4 of the Zn atoms in the surface layer. On the other hand, from the shadowing and blocking edges of a low-energy alkali ion scattering[33] (LEIS) experiment no evidence for substantial quantities of point defects in the Zn–terminated as well as in the O–terminated surface was found.
For the O–terminated surface, it was concluded from LEIS[33] that the Zn–O double-layer spacing is close its bulk value. An XPD study[34] found a contraction of 25 % of , but like in the LEED analysis[28], the wrong bulk structure of Ref. [29] was used in the scattering simulations. A GIXD measurement[32] predicted also an inward relaxation of the topmost O–layer by 0.33 Å and an outward relaxation of the underlying Zn–plane by +0.08 Å. The occupancy probabilities were fitted, resulting in 1.3(!) and 0.7 for the first bilayer O and Zn, respectively. After considerably improved sample preparation was achieved, the same authors reinvestigated the O–terminated polar surface.[35] Best agreement with their GIXD data was now found for a structural model where both, the upper O and Zn planes relax inwards by 0.190.02 Å and 0.070.01 Å, respectively, with occupancy factors of 1.0 in the oxygen plane and 0.750.03 in the underlying Zn plane. The inward relaxation of the O–layer has been confirmed by another surface X–ray diffraction measurement[26] where =0.240.06 Å and =+0.040.05 Å was obtained.
Ab-initio calculations on polar slabs[26, 27, 7] predict consistently for both surface terminations contractions for the first Zn–O double-layer distance, with a larger inward relaxation at the O–terminated surface.
In view of the above discussed discrepancies between different experimental and theoretical investigations, it is our aim to provide a consistent set of fully converged calculations for the four main ZnO surfaces. We attempt to overcome the restrictions of previous theoretical studies such that the current study can be regarded as a reference for perfectly ordered, defect-free surfaces. An accurate set of uniform theoretical data may then allow to discuss the differences between theory and experiment in terms of deviations between the model of ideal, unreconstructed surfaces as assumed in the ab-initio simulations and the structure of the surfaces occurring in nature. In particular, for the polar surfaces this may give new insight into how these surfaces are stabilized.
II Theoretical details
A Method of calculation and bulk properties
We have carried out self-consistent total-energy calculations within the framework of density-functional theory (DFT).[36] The exchange and correlation effects were treated within both, the local-density approximation (LDA),[37, 38] and the generalized-gradient approximation (GGA) where we used the functional of Perdew, Becke, and Ernzerhof[39] (PBE).
Two different pseudopotential schemes were applied: For the study of the nonpolar surfaces we used pseudopotentials of the Vanderbilt ultrasoft type.[40] The electronic wave functions were expanded in a plane wave basis set including plane waves up to a cut-off energy of 25 Ry. A conjugate gradient technique as described in Ref. [41] was employed to minimize the Kohn-Sham total energy functional.
For the calculations on the polar surfaces we used normconserving pseudopotentials[42] together with a mixed-basis consisting of plane waves and non-overlapping localized orbitals for the O– and the Zn– electrons.[43] A plane-wave cut-off energy of 20 Ry was sufficient to get well converged results. To improve convergence in the presence of partly occupied bands, a Gaussian broadening[44] with a smearing parameter of 0.1 eV was included. For several configurations representing nonpolar surfaces we repeated the calculations with the mixed-basis approach. No significant differences compared to the results from the ultrasoft-pseudopotential method could be seen.
It is a well known shortcoming of LDA and GGA that both predict the Zn– bands to be roughly 3 eV too high in energy as compared to experiment.[11, 45] In consequence, the Zn– states hybridize stronger with the O– valence bands, thereby shifting them unphysically close to the conduction band. The underestimate for the band gap is therefore even more severe in ZnO than in other semiconductors. In our calculations we obtained band gaps of 0.78 eV and 0.74 eV with LDA and PBE, respectively, as opposed to the experimental value of 3.4 eV. The band gap and the position of the Zn– bands can be improved significantly, if a self-interaction correction (SIC) is used.[38] Usually SIC calculations are very demanding, but if the SIC effects are incorporated into the pseudopotential[46], the additional calculational cost is modest. Unfortunately, the SIC pseudopotential scheme does not improve the structural properties of ZnO[46] and also causes some problems when accurate atomic forces are needed.[47] Therefore, and since we are mostly interested in accurate relaxed geometries of the surfaces and not so much in their electronic structure, we have omitted the use of SIC in our calculations.
The computed structural parameters for bulk ZnO are shown in Table I. Mixed-basis and ultrasoft-pseudopotential calculations give the same results within the accuracy displayed in Table I. As is typical for the functionals, LDA underestimates the lattice constants by 1–2 %, and GGA overestimates them by roughly the same amount. The –ratio strongly influences the internal parameter . If , all nearest-neighbor bonds are equal. Since the –ratio is slightly overestimated in our calculations, we get –values that are slightly smaller than observed in experiment.
The construction of appropriate supercells for the study of the surfaces will be detailed in the following subsection. All atomic configurations were fully relaxed by minimizing the atomic forces using a variable-metric scheme.[48] Convergence was assumed when the forces on the ions were less than 0.005 eV/Å.
B Surfaces, slab structures, and the stability problem
All surfaces were represented by periodically repeated slabs consisting of several atomic layers and separated by a vacuum region of 9.4 to 12.4 Å. For the polar surfaces a dipole correction[49, 50] was used to prevent artificial electrostatic interactions between the repeated units. To simulate the underlying bulk structure, the slab lattice constant in the direction parallel to the surface was always set equal to the theoretical equilibrium bulk value (see Table I).
The nonpolar surfaces are obtained by cutting the crystal perpendicular to the hexagonal Zn– and O–layers (see Fig. 1). In both cases, for the (100) and the (110) planes, two equivalent surfaces are created so that always stoichiometric slabs with the same surface termination on top and on bottom can be formed.
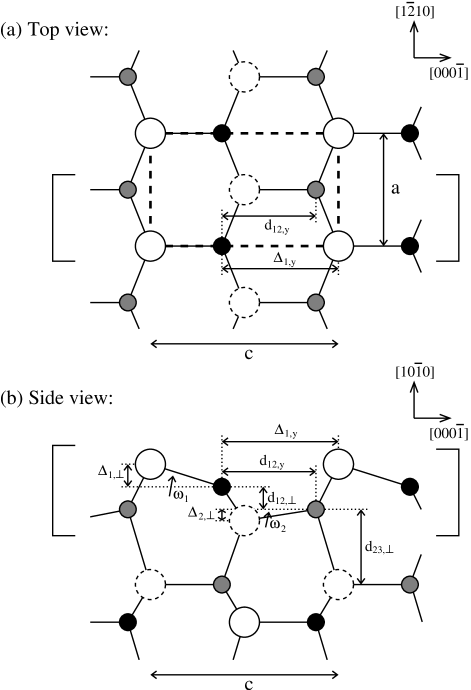
The (100) surface geometry is sketched in Fig. 2. Each surface layer contains one ZnO dimer. The dimers form characteristic rows along the [110] direction which are separated by trenches. Slabs with 4–20 atomic layers were used, thus containing up to 40 atoms, and the Brillouin-zone of the supercell was sampled with a (422) Monkhorst-Pack[51] k–point grid. No differences were found when going to a (642) mesh.
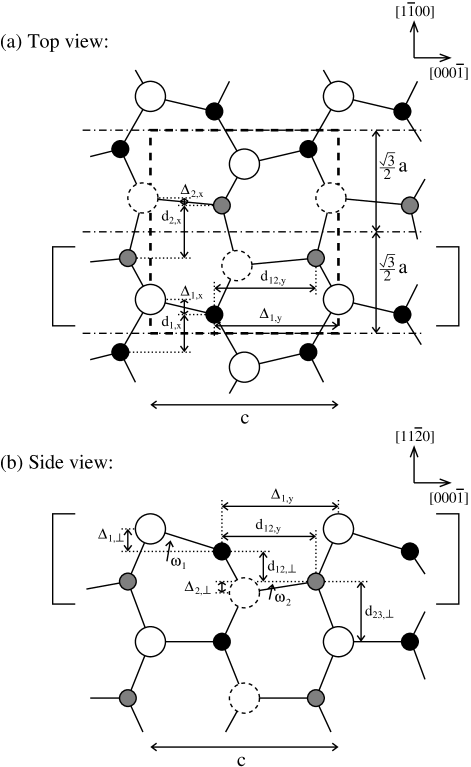
The surface layers of the (110) surface are built up by two ZnO dimers which form zig-zag lines along the surface (see Fig. 3). The two dimers are equivalent and are related by a glide plane symmetry. This symmetry is not destroyed by the atomic relaxations of the surface.[6] The slabs in our calculations were built of 4–8 atomic layers with up to 32 atoms, and a (222) Monkhorst-Pack[51] k–point mesh was used. Again, a denser (442) mesh did not alter the results.

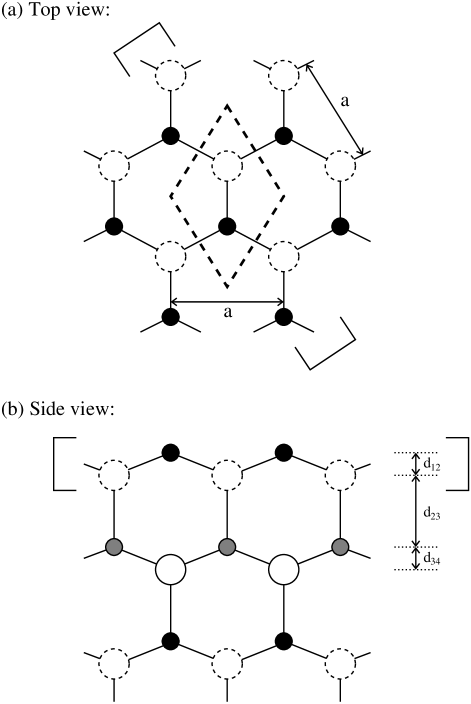
Cleaving the crystal perpendicular to the –axis (see Fig. 1) always creates simultaneously a Zn– and an O–terminated polar (0001) and (000) surface, respectively. If we only consider cuts where the surface atoms stay 3–fold coordinated, all slabs representing polar surfaces are automatically stoichiometric and are inevitably Zn–terminated on one side and O–terminated on the other side. Figure 4 sketches the characteristic sequence of Zn–O double-layers of the polar slabs. In our calculations slabs with 4–20 Zn–O double-layers were used, thus containing 8–40 atoms. k–point convergence was achieved with a (661) Monkhorst-Pack[51] grid, and tests with up to (12121) k–points were made.
Each Zn–O double-layer in Fig. 4 exhibits a dipole moment perpendicular to the surface. If we assume for simplicity a purely ionic model for ZnO and assign the fixed formal charges and to the Zn– and O–ions, respectively, then a slab of double-layers will exhibit a dipole moment of (see Fig. 5). This corresponds to a spontaneous polarization of which is independent of the thickness of the slab. If the external electric field is zero, inside the slab an electric field of will be present. Therefore, no matter how thick we choose our slab, the inner part will never become bulk-like, and the surface energy, defined as the difference between the energy of the slab and the energy of the same number of atoms in the bulk environment, will diverge with slab thickness.[25] Thus, the polar surfaces are not stable.
On the other hand, it can easily be seen that if we modify the charge in the top and bottom layer of the slab from to with , then the dipole moment of the slab will become independent of the slab thickness and the internal electric field vanishes. This charge transfer is equivalent to applying an external dipole which compensates the internal electric field.
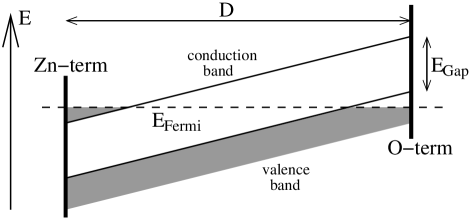
For most polar surfaces the rearrangement of the charges is accomplished by a modification of the surface layer composition with respect to the bulk. If this does not occur, the internal electric field will ‘tilt’ the band structure by which the upper edge of the valence band close to the O–terminated surface will become higher in energy than the lower edge of the conduction band at the Zn–terminated face (see Fig. 6). The slab can now lower its energy (thereby reducing the internal electric field) by transferring electrons from the valence band at the O–terminated side to the conduction band at the Zn–terminated face. This will happen ‘automatically’ in any self-consistent electronic structure calculation that makes use of a slab geometry. This is what is usually referred to as ‘the metallization of polar surfaces’.
However, one problem still remains: electrons move from the O– to the Zn–terminated surface until the upper valence band edge at the O–terminated side has reached the same energy as the lower edge of the conduction band at the Zn–terminated face as sketched in Fig. 6. In this situation, the internal electric field is not fully removed for a finite slab with thickness . The residual electric field depends on the band gap and vanishes only with 1/. In our calculations we found that for slabs with up to 6 Zn–O double-layers the residual electric field is still so strong that the slabs are not stable. There is no energy barrier when the O– and Zn–layers are shifted simultaneously and rigidly toward each other. Therefore, to get good converged results for the surface geometries and energies very thick slabs have to be used which makes the investigation of the polar surfaces computationally very demanding. Ideally, one should calculate all quantities of interest for different slab thicknesses and extrapolate the results to 1/. In the present study we obtained the relaxations of the surface layers (see Fig. 8) as well as the cleavage energy of the polar surfaces (see Fig. 9) by extrapolating the results of slab calculations containing up to 20 Zn–O double-layers.
| (100) surface | (110) surface | |||
| LDA | PBE | LDA | PBE | |
| 0.106 | 0.100 | 0.076 | 0.073 | |
| 0.041 | 0.038 | 0.016 | 0.015 | |
| Bulk | 0.0 | 0.0 | ||
| 0.6531 | 0.6539 | 0.6506 | 0.6516 | |
| 0.6243 | 0.6231 | 0.6230 | 0.6221 | |
| Bulk | ||||
| 0.083 | 0.077 | |||
| 0.020 | 0.016 | |||
| Bulk | 0.0 | |||
| 0.1445 | 0.1447 | 0.4093 | 0.4089 | |
| 0.6328 | 0.6337 | 0.5215 | 0.5222 | |
| Bulk | / | |||
| 0.5355 | 0.5357 | 0.5259 | 0.5266 | |
| 0.5013 | 0.5017 | 0.5014 | 0.5009 | |
| Bulk | ||||
| 0.4381 | 0.4399 | |||
| 0.5515 | 0.5556 | |||
| Bulk | ||||
| (Zn) | (O) | |||
|---|---|---|---|---|
| LDA, this study | 10.7∘ | 6.7 | 2.8 | 3.2 |
| PBE, this study | 10.1∘ | 7.2 | 3.1 | 3.4 |
| LEED, Ref. [5] | 125∘ | 36 | ||
| LDA+pw, Ref. [20] | 11.7∘ | 6.0 | ||
| LDA+Gauss, Ref. [17] | 3.6∘ | 7.9 | 5.2 | 2.7 |
| HF, Ref. [18] | 2.3∘ | 7.2 | 3.6 | 3.4 |
| B3LYP, Ref. [19] + [52] | 5.2∘ | 4.9 | 2.9 | 0.5 |
III Results and discussion
A The nonpolar (100) and (110) surfaces
The nonpolar wurtzite (100) surface and the closely related zincblende (110) surface have been studied experimentally and theoretically for a wide range of III–V and II–VI compound semiconductors. It was found that all surfaces show the same basic relaxations with the surface cation moving inwards and the anion staying above, resulting in a tilt of the surface anion–cation dimers, and the magnitude of the relaxation is determined by a competition between dehybridizaton and charge transfer effects.[53, 54, 55, 20]
At the surface (this applies also to the (110) surface), the coordination of the surface atoms is reduced from 4–fold to 3–fold, thereby creating an occupied dangling bond at the anion and an empty dangling bond at the cation. Two limiting cases may now be distinguished: In a dominantly covalent bonded compound the cation will rehybridize from sp3 to sp2 and will move downwards until it lays nearly in the plane of its three anion neighbors. The anion stays behind (often even an outward relaxation is observed) tending toward p–like bonds to its neighbors. The result is a strong tilt of the surface anion–cation dimer (up to 30∘ are observed) with only a small change of the bondlength. In a dominantly ionic solid, electrostatics prevails over dehybridization effects. To obtain a better screening, both, anion and cation, move toward the bulk. The tilt of the anion–cation dimer will be small but the bond length can be significantly reduced. Therefore, the relaxation of the surface dimers directly reflects the covalency or ionicity of the chemical bond in the compound of consideration.
Our results for the relaxation of the (100) surface are given in Tables II and III. All lengths are expressed as fractions of the theoretical lattice parameters given in Table I. Using these dimensionless relative quantities no significant differences between the LDA and GGA calculations can be seen. For two structural parameters the decay of the surface relaxations into the bulk is illustrated in Fig. 7. Compared to the topmost surface layer, the tilt angle and the in-plane bond length contraction of the Zn–O dimers are already much smaller in the second and the subsequent layers, but still significant deviations from the bulk structure can be seen as deep as five or six layers below the surface.
The relatively small angle of for the tilt of the surface Zn–O dimer together with the Zn–O bond contraction of % confirms that the chemical bond in ZnO is highly ionic but with significant covalent contributions. A tilt of 10∘ is at the lower boundary of what has been observed for other III–V and II–VI compounds.[54] Only the nitride semiconductors show tilt angles that are similarly small.[20]
The calculated surface relaxations in Table II and III agree very well with the DFT-LDA study of Ref. [20] and with the results from the LEED analysis.[5] Relative to the central layer of the slab we find a downward relaxation of the surface atoms of (Zn)=0.36 Å and (O)=0.04 Å with a shift parallel to the surface of (Zn)=0.18 Å compared to (Zn)=0.450.1 Å, (O)=0.050.1 Å, and (Zn)=0.10.2 Å from the LEED experiment.

Rotation angles of =2∘–5∘ seem anomalously small in the context of what is known for other compounds. Even for the very ionic AlN a tilt angle of =7.5∘ has been reported.[20] The smaller relaxations obtained in Ref. [17, 18, 19] may be due to not fully converged calculations. Very thin slabs were partly used or only the first one or two surface layers were relaxed. In Ref. [19] no relaxation of the Zn ions parallel to the surface was allowed. Also the convergence of the localized basis sets employed in these studies and the k–point sampling may have been a problem. As a test we did a slab calculation where we fixed the positions of the atoms at the bulk positions and allowed only the first surface layer to relax. The tilt angle then reduces to roughly half of its value. Also coarsening the k–point mesh results in changes of 2∘–3∘ in . Since we did our calculations with two very different pseudopotential approaches we can exclude any bias caused by the use of pseudopotentials.
Table II and IV show our results for the relaxation of the (110) surface. The atomic displacements are of the same order of magnitude as has been found for the (100) surface. Again, no significant differences between LDA and GGA calculation can be seen. The tilt of the surface dimers of 7.5∘ and the reduction of the Zn–O dimer bond length of about 6 % fits nicely into the picture of ZnO being at the borderline between ionic and covalent solids.
In a hybrid B3LYP study[21] much smaller relaxations for the (110) surface were reported. However, in this study only three degrees of freedom per surface layer were relaxed. The authors claimed that the position of the Zn and O ions are constrained by symmetry. This is not correct. From the two Zn–O dimers in each surface layer, the atoms of one dimer can move freely in all three Cartesian directions, leading to six degrees of freedom per surface layer (see Fig. 3). The position of the second dimer is then determined by the glide plane symmetry (see also Ref. [53]).
B The polar (0001)–Zn and (000)–O surfaces
In Figure 8 we have plotted the calculated distances between the topmost surface layers of the polar (0001) and (000) surfaces as a function of the slab thickness . As expected from the thickness dependence of the residual electric field inside the slab, the plots reveal a nice linear behavior for the interlayer distances. By extrapolating , all distances may now be obtained in the limit of a vanishing internal electric field.

The extrapolated results for the relaxations of the polar surfaces are summarized in Table V and VI. Very good agreement with the results of previous ab-initio calculations is found. In general, all double-layers are contracted and the distances between the double-layers are increased relative to the bulk spacings. For finite slabs, the residual internal electric field further amplifies this characteristic relaxation pattern.
The largest relaxation is found for the O–terminated surface where the outermost double-layer distance is compressed by 50 %. This agrees reasonably well with the results of the X–ray experiments[26, 32, 35] where a contraction of 40 %, 54 %, and 20 % were found. On the other hand, from LEED analysis[28] and LEIS[33] measurements it was concluded that the Zn–O double-layer spacing for the O–terminated surface is close to its bulk value. The recent finding of Wöll et al.[8] may perhaps help to solve this contradiction. With helium scattering it was shown that after commonly used preparation procedures the O–terminated surfaces are usually hydrogen covered. To test how much hydrogen may influence the surface relaxations, we repeated a calculation where we adsorbed hydrogen on top of the O–terminated side of the slab. We find that in this case the outermost Zn–O double-layer expands again, and the Zn–O separation goes back close to the bulk distance. A similar result was also reported by Wander and Harrison.[56]
For the Zn–terminated surface there is a clear discrepancy between theory and experiment. All calculations predict consistently a contraction of the first Zn–O double-layer of 20–30 %, whereas in experiment no contraction[30] or even an outward relaxation of the topmost Zn–layer is found.[31, 32] This may indicate that the ’metallization’ used in all theoretical studies is not the adequate model to describe the polar Zn–terminated surface. Recently Dulub and Diebold[57] proposed a new stabilization mechanism for the Zn–terminated surface. With scanning tunneling microscopy (STM) they found that many small islands with a height of one double-layer and many pits one double-layer deep are present on the (0001)–Zn surface. Assuming that the steps edges are O–terminated, an analysis of the island and pit size distribution yielded a decrease of surface Zn concentration of roughly 25 %. Such a reduction of Zn atoms at the surface would be enough to accomplish the charge transfer needed to stabilize the polar surface. It would not be in contradiction with the observed p(11) LEED pattern since a long range correlation between the different terraces remains. The missing of 25 % of the Zn atoms was also obtained by Jedrecy[32] as best fit of their GIXD data.
| (0001)–Zn surface | (000)–O surface | |||
| LDA | PBE | LDA | PBE | |
| 0.0952 | 0.0883 | 0.0594 | 0.0645 | |
| 0.3947 | 0.3995 | 0.4022 | 0.3962 | |
| 0.1172 | 0.1132 | 0.1044 | 0.1107 | |
| 0.3811 | 0.3857 | 0.3817 | 0.3784 | |
| 0.1187 | 0.1186 | 0.1194 | 0.1251 | |
| Bulk | / | / | ||
| (0001)–Zn surface | (000)–O surface | |||
|---|---|---|---|---|
| LDA, this study | 22 % | 5.1 % | 51 % | 4.7 % |
| PBE, this study | 27 % | 5.3 % | 47 % | 4.5 % |
| B3LYP, Ref. [26] | 23 % | 3.5 % | 41 % | 3.0 % |
| GGA, Ref. [27] | 31 % | 7.0 % | 52 % | 6.5 % |
| GGA, Ref. [7] | 25 % | 41 % | ||

A structure where the surface is stabilized by many small islands and pits with a Zn deficiency at the step edges is, of course, far away from the model of a clean, perfectly ordered (0001)–Zn surface used in the theoretical calculations. Basically all surface Zn–atoms will be next to a step edge, and therefore very different relaxations may occur. Unfortunately, it is presently out of the reach of our ab-initio method to do calculations on slabs representing such an island and pit structure.
For the O–terminated surface, on the other hand, the STM measurements show a very different picture. Smooth and flat terraces separated mostly by a two double-layer step are observed. The number of single double-layer steps was by far not large enough to account for a similar stabilization mechanism as for the Zn–terminated surface.
C Surface/cleavage energies
For the nonpolar surfaces we can obtain directly the surface energy from our slab calculations since the slabs are always terminated by the same surface on both sides. This is not possible for the polar surface since inevitably both surface terminations are present in a slab calculation. Only the cleavage energy of the crystal is well defined. To be able to compare the relative stability of the nonpolar and polar surfaces, we will discuss in the following only the cleavage energies. The surface energies of the nonpolar surfaces are just given by half of their cleavage energy.
Like the interlayer distances, the 1/–plot of the cleavage energy for the polar surfaces in Fig. 9 exhibits a simple linear behavior. As can be seen, the cleavage energy does not change too much with the slab thickness so that moderate slab sizes would be sufficient to obtain reasonable converged results.
The extrapolated values for the cleavage energy of the polar surfaces together with the results for the nonpolar faces and the findings of previous studies are summarized in Table VII. The nonpolar (100) surface is the most stable face of ZnO with the lowest cleavage energy. But the energy of the (110) surface is only slightly higher. The cleavage energy for the polar surface is roughly a factor of two larger than for the nonpolar surfaces. This is surprisingly low compared to what has been found in other systems, for example MgO, where a ’metallization’ was also assumed as stabilization mechanism for the polar surfaces.[58] Therefore, for ZnO the ’metallization’ mechanism can well compete with other stabilization mechanisms like reconstructions or randomly distributed vacancies and can not be ruled out by energetic considerations alone.
| (100) surface: | ||
| LDA, this study | 2.3 | 0.37 |
| PBE, this study | 1.6 | 0.37 |
| LDA+pw, Ref. [20] | 1.7 | 0.37 |
| B3LYP, Ref. [19] + [26] | 2.3 | |
| HF, Ref. [18] | 2.7 | 0.38 |
| Shell model, Ref. [16] | 2.0 | |
| (110) surface: | ||
| LDA, this study | 2.5 | 0.29 |
| PBE, this study | 1.7 | 0.30 |
| (0001)/(000) surface: | ||
| LDA, this study | 4.3 | 0.28 |
| PBE, this study | 3.4 | 0.28 |
| B3LYP, Ref. [26] | 4.0 |
The LDA and GGA results in Table VII show the same ordering for the cleavage energies of the different surfaces but the absolute GGA energies are roughly 30 % lower than the LDA results. This is a well known improvement of the GGA, where a much better description of the rapidly decaying charge density into the vacuum region is achieved. The cleavage energies agree well with previous theoretical results as given in the Table. Surprisingly, the results of the hybrid B3LYP studies are much closer to LDA than to the GGA results. Interestingly, the relaxation energy is roughly the same for all surfaces when normalized to one Zn–O pair. This means that despite the partially filled bands at the polar surfaces, the strength of the relaxation is almost the same as for the isolating nonpolar faces.
IV Summary and conclusions
A first-principles density-functional pseudopotential approach was used to determine the fully relaxed atomic structures and the surface/cleavage energies of the nonpolar (100) and (110) surfaces and the polar Zn–terminated (0001) and the O–terminated (000) basal surface planes of ZnO.
The main results of the presented investigation are an extensive set of reliable data for the structural parameters and the energetics of the various ZnO surfaces within the LDA and the PBE approximation, which we consider to be a reference for future studies (see in particular the compilations in Tables II, V, and VII).
For the nonpolar surfaces we could resolve the discrepancy between experiment and several previous ab-initio studies by showing that if calculations are carefully converged a moderate tilt of the Zn–O surface dimers with a relatively strong contraction of the dimer bond length is obtained. Such a relaxation pattern is typical for rather ionic compounds but with strong covalent contribution to the chemical bonding. Our results are in line with LEED analysis and fit very well the systematic trends that are observed for other more or less ionic II–VI and III–V semiconductors.
The polar surfaces can only be stable if a rearrangement of charges between the Zn– and the O–terminated surfaces takes place. In our calculations the polar surfaces were stabilized by allowing the electrons to move from the (000)–O to the (0001)–Zn surface, thereby quenching the internal electric field. Nevertheless, even for thick slabs a finite residual electric field is present inside the slabs, which affects the results for the structural parameters and the surface energy. To get well converged results in the limit of a vanishing internal electric, we repeated all calculations with slabs consisting of different numbers of Zn–O double-layers and extrapolated the results to the limit of an infinite thick slab.
For both polar surfaces we obtain a strong contraction of the outermost double-layer spacing. This agrees well with experiments for the O–terminated surface but not for the Zn termination, indicating that the electron transfer may be not the adequate model to describe the stabilization mechanism of the polar Zn–terminated surface. Since this is consistently predicted by all calculations, it is very likely that other mechanisms, such as defect formation, hydroxylation and/or the mechanism proposed by Dulub and Diebold might stabilize the (0001)–Zn surface.
Concerning the surface energies, we find very similar values for the two nonpolar surfaces with a slightly lower value for the (100) surface. The cleavage energy for the polar surfaces is predicted to be roughly a factor of two larger than for the (100) face.
V Acknowledgments
We wish to thank Volker Staemmler, Karin Fink, and Christof Wöll for fruitful discussions. The work was supported by SFB 558 and FCI.
REFERENCES
- [1] D.M. Bagnall, Y.F. Chen, Z. Zhu, T. Yao, S. Koyama, M.Y. Shen, and T. Goto, Appl. Phys. Lett. 70, 2230 (1997).
- [2] J.B. Hansen, Handbook of Heterogeneous Catalysis, G. Ertl, H. Knötzinger, J. Weitkamp (Eds.), Wiley–VCH, Weinheim, 1997.
- [3] P.A. Cox, Transition Metal Oxides: An Introduction to Their Electronic Structure and Properties, Clarendon Press, Oxford, 1992.
- [4] C.B. Duke, A.R. Lubinsky, S.C. Chang, B.W. Lee, and P. Mark, Phys. Rev. B 15, 4865 (1977).
- [5] C.B. Duke, R.J. Meyer, A. Paton, and P. Mark, Phys. Rev. B 18, 4225 (1978).
- [6] C.B. Duke, J. Vac. Sci. Technol. 14, 870 (1977).
- [7] C. Noguera, J. Phys.: Condens. Matter 12, R367 (2000).
- [8] Ch. Wöll et al., to be published.
- [9] Several publications[12, 16, 17] quote an earlier LEED analysis of Duke et al., Ref. [4], where a smaller relaxation of the top-layer Zn of 0.3 Å and a larger displacement of O of 0.1 Å was found, leading to a smaller tilt of the Zn–O dimers. As is stated in Ref. [5], Ref. [4] is an analysis of the same experimental data, but the wrong structural bulk model of Ref. [29] was used. Additionally, several conceptual improvements were made in the reanalysis Ref. [5]. Under these circumstances, the earlier publication should be disregarded in favour of the results of Ref. [5].
- [10] The LEED experiments are sometimes interpreted in literature as to conclude that the surface dimer distance is expanded compared to the bulk situation.[12, 18, 19, 20] In these cases, the authors either refere to the older LEED analysis of Ref. [4], or they neglect the lateral displacement (Zn) or they misinterpret (Zn) as a shift in the wrong direction. Indeed, the sign convention for the lateral displacements is not very clear in Ref. [5], but from the absolute atomic positions given in the summary of Ref. [5] it becomes clear that Zn relaxes toward the O ions thereby shortening the Zn–O distance.
- [11] W. Göpel, J. Pollmann, I. Ivanov, and B. Reihl, Phys. Rev. B 26, 3144 (1982).
- [12] N. Jedrecy, S. Gallini, M. Sauvage-Simkin, and R. Pinchaux, Surf. Sci. 460, 136 (2000).
- [13] T.M. Parker, N.G. Condon, R. Lindsay, F.M. Leibsle, and G. Thornton, Surf. Sci. 415, L1046 (1998).
- [14] Y.R. Wang and C.B. Duke, Surf. Sci. 192, 309 (1987).
- [15] I. Ivanov and J. Pollmann, Phys. Rev. B 24, 7275 (1981).
- [16] L. Whitmore, A.A. Sokol, and C.R.A. Catlow, Surf. Sci. 498, 135 (2002).
- [17] P. Schröer, P. Krüger, and J. Pollmann, Phys. Rev. B 49, 17092 (1994).
- [18] J.E. Jaffe, N.M. Harrison, and A.C. Hess, Phys. Rev. B 49, 11153 (1994).
- [19] A. Wander and N.M Harrison, Surf. Sci. 457, L342 (2000).
- [20] A. Filippetti, V. Fiorentini, G. Cappellini, and A. Bosin, Phys. Rev. B 59, 8026 (1999).
- [21] A. Wander and N.M. Harrison, Surf. Sci. 468, L851 (2000).
- [22] Numerical Data and Functional Relationships in Science and Technology, Landolt–Börnstein, New Series Group III, Vol. 17a amd 22a. edited by K.-H. Hellwege and O. Madelung, Springer, New York, 1982.
- [23] S.C. Abrahams and J.L. Bernstein, Acta Cryst. B25, 1233 (1969); T.M. Sabine and S. Hogg, Acta Cryst. B25, 2254 (1969).
- [24] C.H. Bates, W.B. White, and R. Roy, Science 137, 993 (1962); W. Class, A. Ianucci, and H. Nesor, Morelco Rep. 13, 87 (1966); J.C. Jamieson, Phys. Earth Planet. Inter. 3, 201 (1970).
- [25] P.W. Tusker, J. Phys. C: Solid State Phys. 12, 4977 (1979).
- [26] A. Wander, F. Schedin, P. Steadman, A. Norris, R. McGrath, T.S. Turner, G. Thornton, and N.M. Harrison, Phys. Rev. Lett. 86, 3811 (2001).
- [27] J.M. Carlsson, Comp. Mat. Sci. 22, 24 (2001).
- [28] C.B. Duke and A.R. Lubinsky, Surf. Sci. 50, 605 (1975).
- [29] R.W.G. Wyckoff, Crystal Structures, Vol. I, 2nd ed., Wiley, New York, 1963, p. 111–112.
- [30] M. Sambi, G. Granozzi, G.A. Rizzi, M. Casari, and E. Tondello, Surf. Sci. 319, 149 (1994).
- [31] H. Maki, N. Ichinose, N. Ohashi, H. Haneda, and J. Tanaka, Surf. Sci. 457, 377 (2000).
- [32] N. Jedrecy, M. Sauvage-Simkin, and R. Pinchaux, Appl. Surf. Sci. 162-163, 69 (2000).
- [33] S.H. Overbury, P.V. Radulovic, S. Thevuthasan, G.S. Herman, M.A. Henderson, and C.H.F. Peden, Surf. Sci. 410, 106 (1998).
- [34] M. Galeotti, A. Atrei, U. Bardi, G. Rovida, M. Torrini, E. Zanazzi, A. Santucci, and A. Klimov, Chem. Phys. Lett. 222, 349 (1994).
- [35] N. Jedrecy, S. Gallini, M. Sauvage-Simkin, and R. Pinchaux, Phys. Rev. B 64, 085424 (2001).
- [36] P. Hohenberg and W. Kohn, Phys. Rev. 136, B864 (1964); W. Kohn and L.J. Sham, Phys. Rev. 140, A1133 (1965).
- [37] D.M. Ceperley and B.J. Alder, Phys. Rev. Lett. 45, 566 (1980).
- [38] J.P. Perdew and A. Zunger, Phys. Rev. B 23, 5048 (1981).
- [39] J.P. Perdew, K. Burke, and M. Ernzerhof, Phys. Rev. Lett. 77, 3865 (1996); Phys. Rev. Lett. 78, 1396 (1997).
- [40] D. Vanderbilt, Phys. Rev. B 41, 7892 (1990).
- [41] R.D. King-Smith and D. Vanderbilt, Phys. Rev. B 49, 5828 (1994).
- [42] D. Vanderbilt, Phys. Rev. B 32, 8412 (1985).
- [43] B. Meyer, C. Elsässer, and M. Fähnle, FORTRAN 90 program for mixed-basis pseudopotential calculations for crystals, Max–Planck Institut für Metallforschung, Stuttgart (unpublished).
- [44] C.-L. Fu and K.M. Ho, Phys. Rev. B 28, 5480 (1983).
- [45] R.T. Girard, O. Tjernberg, G. Chiaia, S. Söderholm, U.O. Karlsson, C. Wigren, H. Hylén, and I. Lindau, Surf. Sci. 373, 409 (1997).
- [46] D. Vogel, P. Krüger, and J. Pollmann, Phys. Rev. B 54, 5495 (1996); Phys. Rev. B 52, R14316 (1995).
- [47] D. Vogel, Dissertation, Universität Münster, Germany, 1998.
- [48] W.H. Press, S.A. Teukolsky, W.T. Vetterling, B.P. Flannery, Numerical Recipes, Cambridge University Press, New York 1986.
- [49] L. Bengtsson, Phys. Rev. B 59, 12301 (1999).
- [50] B. Meyer and D. Vanderbilt, Phys. Rev. B 63, 205426 (2001).
- [51] H.J. Monkhorst and J.D. Pack, Phys. Rev. B 53, 5188 (1976).
- [52] The data given in Ref. [19] is not consistent. In Table III we cite the bond length values of Table 3, Ref. [19]. Using the atomic displacements listed in Table 1, Ref. [19] will lead to different results for the back bond lengths.
- [53] C.B. Duke and Y.R. Wang, J. Vac. Sci. Technol. A 7, 2035 (1989).
- [54] C.B. Duke, J. Vac. Sci. Technol. A 10, 2032 (1992).
- [55] J. Pollmann, P. Krüger, M. Rohlfing, M. Sabisch, and D. Vogel, Appl. Surf. Sci. 104/105, 1 (1996).
- [56] A. Wander and N.M. Harrison, J. Chem. Phys. 115, 2312 (2001).
- [57] O. Dulub and U. Diebold, to be published.
- [58] A. Pojani, F. Finocchi, J. Goniakowski, and C. Noguera, Surf. Sci. 387, 354 (1997).