Metallic behavior of lightly-doped La2-xSrxCuO4 with “arc” of Fermi surface
Abstract
Lightly-doped La2-xSrxCuO4 in the so-called “insulating” spin-glass phase has been studied by angle-resolved photoemission spectroscopy. We have observed that a “quasi-particle” (QP) peak crosses the Fermi level in the node direction of the -wave superconducting gap, forming an “arc” of Fermi surface, which explains the metallic behavior at high temperatures of the lightly-doped materials. The QP spectral weight of the arc smoothly increases with hole doping, which we attribute to the behavior of the carrier number in the underdoped and lightly-doped regions.
pacs:
74.25.Jb, 71.18.+y, 74.72.Dn, 79.60.-iHow the electronic structure evolves with hole doping from the Mott insulator to the metal/superconductor phase is believed to be a key issue to elucidate the mechanism of superconductivity in the high- cuprates. However, the issue has remained controversial until now. In order to clarify the doping-induced changes of the electronic properties, one has to understand the electronic properties in the vicinity of the Mott insulating state and hence the nature of the “insulating” spin-glass phase (or diagonal stripe phase wakimoto ) and the metal-insulator transition (MIT) at separating this phase from the superconducting phase. Recent transport studies on La2-xSrxCuO4 (LSCO) have indicated metallic () behaviors at high temperatures in the spin-glass phase (), even down to the extremely light doping () inside the antiferromagnetic “insulating” (AFI) phase () ando . In this doping region, the absolute value of the in-plane electrical resistivity is far above the Mott limit for metallic conductivity in two-dimensional metal, , where is the Fermi wave number and is the carrier mean-free path. These observations raise a question of the intrinsic nature of the “insulating” spin-glass phase and hence the intrinsic nature of the MIT at .
In previous angle-resolved photoemission (ARPES) studies, underdoped LSCO has shown a “two-component” electronic structure around (), which manifests the evolution of in-gap states into the Mott insulator with hole doping inoPRB . The chemical potential pinning in the underdoped region also indicates the existence of the in-gap states inoCP . However, since the pseudogap around () increases with decreasing hole content, it has not been clear how the in-gap states exist and contribute to the transport properties of the lightly doped materials mentioned above.
In this Letter, we have performed an ARPES study of lightly-doped LSCO in order to address those intriguing questions. The present results have revealed a weak but sharp “quasi-particle” (QP) peak crossing the chemical potential, i.e., the Fermi level (), along the zone diagonal =(0,0)-() direction and hence an “arc” of Fermi surface in this region. This indicates that the spin-glass phase is indeed a metal with a novel electronic structure. Furthermore, we have found that, with increased doping, the QP peak intensity smoothly increases up to optimum doping. We propose that this behavior is associated with the behavior of the carrier number takagi ; uchida , which is one of the most peculiar properties of the high- cuprates.
The ARPES measurements were carried out at BL10.0.1 of the Advanced Light Source, using incident photons of 55.5 eV. We used a SCIENTA SES-200 analyzer with the total energy resolution of meV and the momentum resolutions of 0.02 in units of , where Å is the lattice constant. High-quality single crystals of LSCO were grown by the traveling-solvent floating-zone method. The of = 0.07, 0.10, 0.15, 0.18 and 0.22 samples were 14, 29, 41, 37 and 28 K, respectively, and = 0.00, 0.03 and 0.05 samples were non-superconducting. The samples were cleaved in situ and measurements were performed at 20 K as in the previous studies zhouPRL ; yoshida . This means that we have studied the “insulator”-to-superconductor transition as a function of at the fixed low temperature. In the present measurements, the electric vector of the incident photons lies within the CuO2 plane, rotated 45∘ from the Cu-O direction and is parallel to the Fermi surface segment around the diagonal region. Since the transition-matrix element is enhanced in the second Brillouin zone (BZ) with this measurement geometry yoshida , the data in the present paper are all taken from the second BZ although we retain the notation of the first BZ for the sake of convenience.
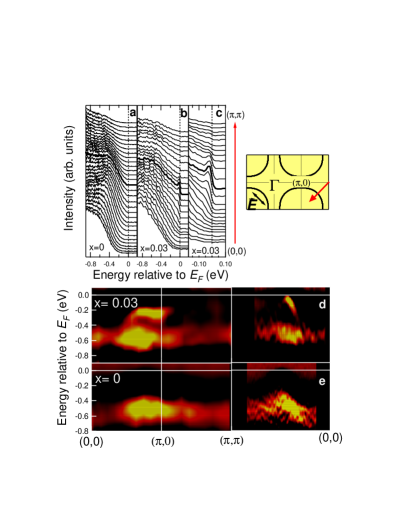
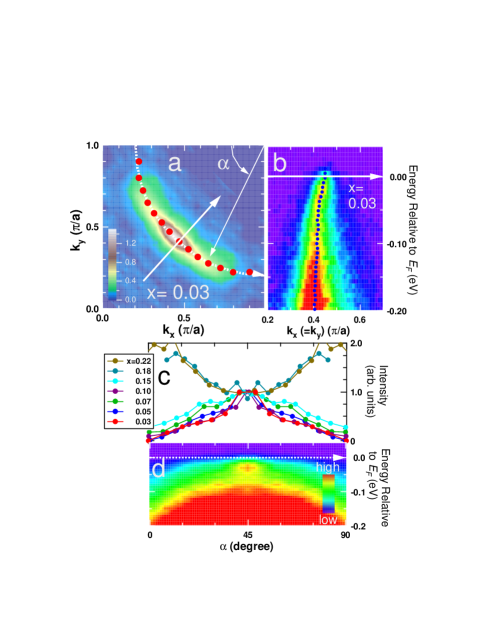
Figure 1 a and b show energy distribution curves (EDC’s) for the = 0 and 0.03 samples in the (0,0)-() direction, i.e., in the nodal direction of the -wave superconductor, where the -symmetry superconducting gap vanishes. The EDC’s for = 0 show only one broad dispersive feature at -(0.4-0.6) eV arising from the lower Hubbard band, consistent with what has been observed in another parent insulator Ca2CuO2Cl2 ronning . In going from =0 to =0.03, the lower Hubbard band becomes a little broader and an additional sharp feature crossing appears, indicating a metallic behavior (see the expanded plot in panel c). This “in-gap” state is reminiscent of the coherent part of the spectral function as predicted by dynamical mean field theory (DMFT) calculations zhang .
In order to highlight the energy dispersion of that sharp feature, we show a gray-scale plot of the second derivatives of EDC’s in Fig. 1d and e. The lower Hubbard band observed for = 0 at -(0.4-0.6) eV remains almost at the same binding energy with hole doping. Instead, there appear a sharp peak feature crossing in the nodal direction, and a broad feature around () at -0.2 eV corresponding to the “flat band” as in the previous report inoPRB . Because of the 0.2 eV gap, the electronic states around () would not contribute to the metallic transport in the normal state, and only the states around the nodal direction would contribute to it. It is rather striking to observe such a sharp peak crossing for hole doping as small as 3%, which is near the boundary between the “insulating” AFI phase () and the “insulating” spin-glass phase niedermayer ().
In Fig. 2a, we have plotted the distribution of spectral weight at in the -space (therefore the energy integration window 10 meV begin set by the energy resolution) for = 0.03. This plot is obtained from the spectra in the second BZ and symmetrized with respect to the (0,0)-() line. The color image was produced by interpolating the spectral intensity of the several momentum lines in two-dimensional momentum space. Owing to the (pseudo)gap around (), only the nodal region remains strong in the intensity map. Figure 2d indeed indicates that crossing occurs only near the nodal direction, forming an “arc” of Fermi surface seen in Fig. 2a. The red dots in Fig. 2a are peak position of the momentum distribution curve (MDC) at which represent minimum gap locus in the -space. The white broken line is determined by fitting a tight-binding Fermi surface to the red dots.
In Fig. 2c, the intensity profile along the “arc” is plotted as a function of Fermi angle (normalized to the nodal direction ). Each point for =0.03 corresponds to a red dot in Fig. 2a and the same procedure using MDC is applied to obtain the plots for other compositions. This figure shows how the intensity profile along the “arc” changes with doping. These profiles indicate that, although for some spectral weight appears in the () region ( and ), the length of the “arc” does not increase significantly with doping up to . In the overdoped samples (), the flat band at crosses inoPRB and therefore the intensity in this region increases. A similar “arc” feature has been observed in a previous work in the normal state of underdoped Bi2Sr2CaCu2O8 (Bi2212) marshall , and postulated from phenomenological norman and theoretical - model perspective wen . We emphasize the difference between our observation and the previous work: Here, the intensity of the “arc” changes as a function of doping at a fixed low temperature whereas in the previous work norman the length of the “arc” changes as a function of temperature associated with the opening of a normal-state gap above .

Figure 3 shows the evolution of spectra at and () with hole doping. The spectra have been normalized to the intensity above which arises from the high order light of the monochromator. At , a finite spectral weight exists at except for = 0, and increases with without an abrupt change across the “insulator”-superconductor transition boundary at . In contrast, the () spectra show (pseudo)gapped behaviors in the underdoped and lightly-doped regions. We stress that the “arc” is formed by the “in-gap” states of the two component electronic structure as shown in Fig. 1.
It has been demonstrated from comparison between LSCO and Nd-LSCO that the nodal QP is weakened by stripes whereas the flat-band region remains relatively unchanged zhouScience ; zhouPRL . While it remains true that the nodal weight in LSCO is significantly suppressed when compared with that of Bi2212 taken under the same condition, it was later found that the nodal spectral weight can be enhanced in the second BZ zhouPRL ; yoshida , indicating that matrix element also played a role. Focusing only on the nodal behavior, we have used the spectra in the second BZ for this analysis. We emphasize here that, in the underdoped region, states closest to occur along the nodal direction, as seen from Fig. 3, whereas the (,0) region is (pseudo)gapped. In the previous results for =0.10-0.15, since the gap size was small (less than 10meV), and the energy integration window was relatively large (30meV), the spectral weight map included both the nodal states and straight segment from the flat band around (,0) which is considered to be related to stripes zhouPRL . On the other hand, for the lightly-doped samples presented here, the Fermi arc is clearly observed because the (,0) region is strongly gapped and the spectral weight plots have been obtained exactly at .
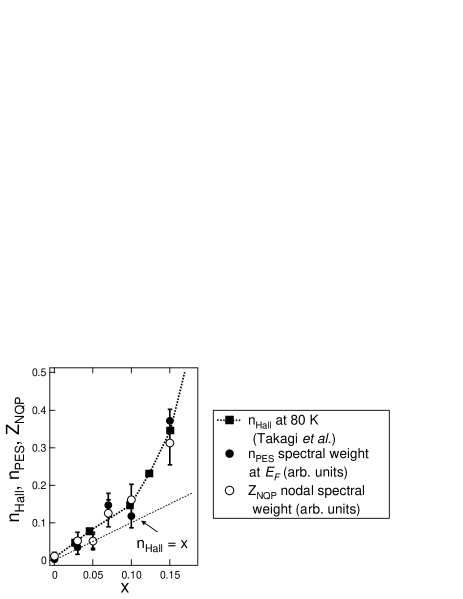
In order to see more quantitatively how the spectral weight at evolves with hole doping, we have plotted in Fig. 4 as a function of the nodal QP weight defined by the peak intensity of EDC in Fig. 3a and the spectral weight at integrated over the second BZ (effectively over the arc region), . Here, is the ARPES intensity normalized as described above. Both and monotonically increase with in a nearly identical fashion. Such a behavior is consistent with a recent optical study of lightly-doped LSCO, which has shown that the Drude weight is finite already in = 0.03 and smoothly increases with in the underdoped region dumm . and , in the underdoped regime, if properly scaled, increase in a remarkably similar way to the hole concentration derived from Hall coefficients through . We therefore tentatively attribute the behavior to the evolution of ARPES spectral weight at : .
Now we discuss the normal-state transport based on the present ARPES data for =0.03. From the width of the momentum distribution curve (MDC) at , the mean free path is obtained as Å. One can also obtain the Fermi velocity eVÅ from the energy dispersion. This yields the electron effective mass , where the Fermi wave number Å-1 is measured from , and the mean scattering time of fs. This value should be taken as the lower bound for the intrinsic value because any extrinsic contributions of unknown origin to the width lead to an underestimate of . Combining this with resistivity mcm at K ando , the upper bound for is given by per Cu. This is consistent with and hence with the conjecture that . On the other hand, leads to one to two orders of magnitude overestimate. If we apply a conventional Drude formula of 2D metal to the experimental value of in the lightly doped region, the large value yields , which indicates the apparent breakdown of the conventional metallic transport ando . Note that in 2D Drude formula is an average value over the Fermi surface while is a local quantity in the momentum space around node. The present study have shown that the unconventional behavior can be reconciled with the metallic transport when only a fraction of carriers contribute to the transport.
Here, it should be mentioned that the resistivity in fact shows an upturn below K, indicating carrier localization. One possibility is that the localization is caused by the opening of a small gap in the nodal direction. If we assume that with a thermal excitation gap , one can crudely estimate meV from the temperature dependence of in =0.03 sample, which is too small to observe with the present energy resolution. In fact, the divergence of at low temperatures does not obey thermal activation type but is better described by weak localization due to disorder. The pseudogap behavior (of 100 cm-1) in the optical spectra dumm would be considered as a signature of such localization.
Finally, we comment on the implication of the present results for charge inhomogeneity picture. We have shown that the nodal spectral weight is proportional to . This observation is consistent with a recent theoretical work of the resonant valence bond (RVB) picture paramekanti as well as an inhomogeneous picture like charge stripes. As for the nodal state and underlying Fermi surface around (), a recent theoretical work have shown that a metallic nodal state may appear even in an almost static stripe phase with a slightly irregular inter-stripe distances granath . Those effects may also account for why the nodal spectra do not show abrupt change from diagonal ( 0.06) to (dynamic) vertical stripe ( 0.06). Spectroscopic feature of 1D in the deeply underdoped regime are probably too subtle to be reflected in our experiment (using twinned samples) since only weak anisotropy is seen in transport ando2 and optical dumm experiments. A better understanding of fluctuations and disorder of stripes probed at different energy scale are required for reconciling the charge inhomogeneity and a band-like picture.
In conclusion, we have revealed the origin of the metallic behavior of lightly-doped LSCO through the observation of a sharp dispersive QP peak crossing in the nodal direction, leading to the formation of an“arc” of Fermi surface. The spectral weight of the “arc” increases with hole doping, which we propose to be related to the carrier number in the lightly-doped and underdoped regions and the origin of the unconventional transport with . The present results combined with the transport data ando reveal the novel metallic state which provides a new scenario of how the the Mott insulator evolves into a -wave superconductor upon hole doping.
We are grateful to Y. Ando, D. N. Basov and N. Nagaosa for valuable discussions. T. Y. acknowledges the Japan Society for Promotion Science for their support. This work was supported by a Grant-in-Aid for Scientific Research “Novel Quantum Phenomena in Transition Metal Oxides” and a Special Coordination Fund for the Promotion of Science and Technology from the ministry of Education, Science, Culture, Sports and Technology, the New Energy and Industrial Technology Development Organization (NEDO) and a US-Japan Joint Research Project from the Japan Society for the Promotion of Science. ALS is operated by the DOE’s Office of BES, Division of Materials Science, with contract DE-FG03-01ER45929-A001.
References
- (1) S. Wakimoto et al. Phys. Rev. B 61, 3699 (2000).
- (2) Y. Ando et al., Phys. Rev. Lett. 87, 017001 (2001).
- (3) A. Ino et al., Phys. Rev. B 62, 4137 (2000).
- (4) A. Ino et al., Phys. Rev. Lett. 79, 2101 (1997).
- (5) H. Takagi et al., Phys. Rev. B 40, 2254 (1989).
- (6) S. Uchida et al., Phys. Rev. B 43, 7942 (1991).
- (7) X.-J. Zhou et al., Phys. Rev. Lett. 86, 5578 (2001).
- (8) T. Yoshida et al., Phys. Rev. B 63, 220501 (2001).
- (9) F. Ronning et al., Science 282, 2067 (1998).
- (10) X. Y. Zhang, M. J. Rozenberg, and G. Kotliar, Phys. Rev. Lett. 70, 1666 (1993).
- (11) C. Niedermayer et al., Phys. Rev. Lett. 80, 3843 (1998).
- (12) D. S. Marshall et al., Phys. Rev. Lett. 76, 4841 (1996).
- (13) M. R. Norman et al., Nature 392, 157 (1998).
- (14) X.-G. Wen and P. A. Lee, Phys. Rev. Lett. 76, 503 (1996).
- (15) X.-J. Zhou et al., Science 286, 268 (1999).
- (16) M. Dumm, D. N. Basov, S. Komiya and Y. Ando, unpublished.
- (17) A. Paramekanti, M. Randeria, and N. Trivedi, Phys. Rev. Lett. 87, 217002 (2001).
- (18) M. V. Granath et al., Phys. Rev. B 65, 184501 (2002).
- (19) Y. Ando et al., Phys. Rev. Lett. 88, 137005 (2002)