Reverse undercompressive shock structures in driven thin film flow
Abstract
We show experimental evidence of a new structure involving an undercompressive and reverse undercompressive shock for draining films driven by a surface tension gradient against gravity. The reverse undercompressive shock is unstable to transverse perturbations while the leading undercompressive shock is stable. Depending on the pinch-off film thickness, as controlled by the meniscus, either a trailing rarefaction wave or a compressive shock separates from the reverse undercompressive shock.
PACS numbers: 68.15.+e,68.45.Gd,03.40.Gc,47.20.Ma
We consider a thin fluid film wetting a solid substrate and driven by a thermal gradient against gravity. This system exhibits a range of phenomena including two kinds of shocks (Lax and undercompressive) and a fingering instability that forms from a flat interface. A key issue that we explore is the role played by the meniscus at the lower boundary.
Insight is provided from two previous studies. In experiments by Ludviksson and Lightfoot[1] (LL), a partially immersed substrate was pulled from a liquid bath and allowed to drain. A temperature gradient drove the film up the substrate against gravity; no fingering instability was reported. Cazabat et al. (Cal) created very thin capillary driven films[2, 3] by leaving the lower end of the substrate in a liquid reservoir; the resulting meniscus controlled the climbing film thickness. A strong Marangoni stress created a capillary ridge, resulting in a fingering instability similar to that in gravitationally driven films [4].
In both types of experiments, the film thickness is a key parameter. In the Cal configuration, inclining the substrate changes the curvature of the meniscus, resulting in a range of film thicknesses[5]. Cazabat et al.[6, 7] show that the bulk film thickness can increase more than an order of magnitude with decreasing inclination angle from the horizontal. As varies, a transition occurs from a stable flat front to a front that is unstable to fingering.
This transition reflects a basic change in the dynamics of the film: very thin film fronts show a single shock profile that is unstable to fingering [8] while thicker films exhibit an undercompressive-compressive shock pair [6, 9] in which the leading undercompressive (UC) front is stable [8, 10]. The experiments in [6, 7] are, to our knowledge, the first examples of naturally occurring UC shocks for systems subject to a scalar conservation law.
In this Letter we present experimental evidence of a new structure involving a pair of UC shocks. This was recently proposed by Münch [11] to explain dynamics mentioned in the original LL work [1]. Using a lubrication model for the meniscus region, he computes film dynamics for an initial condition corresponding to the LL experiment. In this model, the meniscus region pinches off a body of fluid that travels up the substrate almost as a solitary wave. This structure contains leading and trailing fronts, both undercompressive. The trailing undercompressive front has never been documented in experiments, although its existence was rigorously proved[12]. Münch calls this trailing front a ‘reverse undercompressive’ (RUC) shock because it involves a thicker film receding upward from a thinner film, which is the reverse of the type found in [6, 7], in which a UC shock describes a thicker film advancing into a thinner region.
We compare theory for the film dynamics to our experiments. Münch uses a full meniscus model to describe the film and meniscus. In his simulations, the meniscus quickly pinches off the draining film, and later acts as a boundary condition for the climbing film structure. In the early stages of the experiment, we clearly observe this pinch-off process. Here we model the dynamics of the draining film using a well-known lubrication approximation with a ‘depth averaged’ velocity [6]
| (1) |
We model the meniscus as a boundary condition that we discuss later. In the above, denotes the surface tension, denotes the surface tension gradient, the angle of inclination (from the horizontal) of the plane, the gravitational constant. Also, is along the direction of the flow. The coefficient of in Eq. (1) represents convection due to the surface tension gradient and the component of gravity tangent to the surface. The component of gravity normal to the surface has a negligible effect. We couple Eq. (1) with mass conservation, . To understand the shock dynamics, we ignore perturbations transverse to and consider solutions depending only on and : . The flux satisfies . We rescale to dimensionless units as in [6]: , , where and Dropping the gives the dimensionless equation
| (2) |
The experiments are carried out as follows. An oxidized silicon wafer is partially dipped into a reservoir of silicone oil (PDMS, =100 cSt and =0.0209 N/m at 25oC) attached to a brass plate. The wafer is pulled out and clamped to the plate (Fig. 1). We create a uniform temperature gradient along the plate by heating at the bottom with a foil heater and cooling at the top with a circulating bath cooler. We monitor the temperature along the plate via thermistors. A typical gradient, which is constant during an experiment, is shown in the inset of Fig. 1. The distance between the heater and cooler is 20 mm, and the width of the brass plate is 152 mm (effectively infinite width in the transverse direction).
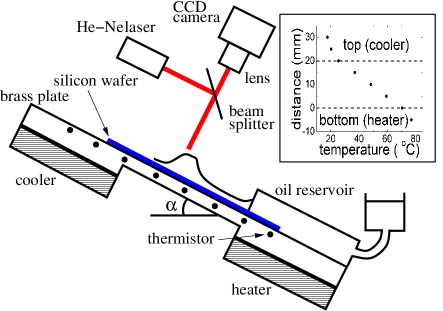
We measure the thickness of the film by both standard interferometric techniques and by a novel variation of this technique. The primary technique uses collimated light from a He-Ne laser (wavelength 632.8 nm) incident normally on the film. We record images with a CCD camera and a frame grabber. Additionally, at the end of a run, we shine an infrared laser (830 nm, 100 mW) at a point on the film. The film near the laser spot is reduced to essentially zero thickness due to the combination of local heating and the induced surface tension gradient. We then measure the thickness at other points on the film by counting the interference fringes from the reference position (One fringe m)[7]. We have less precision determining the absolute thickness of very thick regions, although the relative error between nearby fringes is small. This is reflected in the larger absolute error bar shown in the top right corner of Figs. 5 and 6.
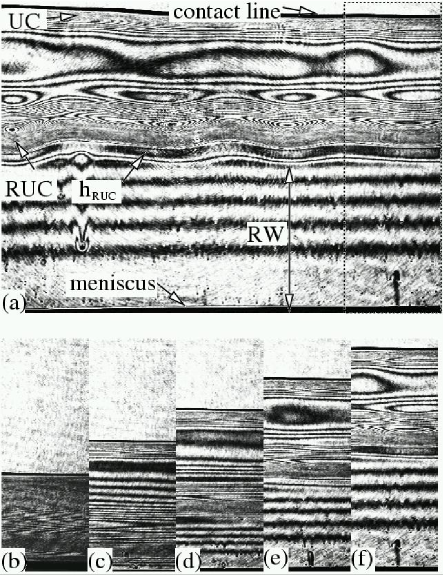
In the early stage of the film evolution, a stationary pinched-off portion appears in the meniscus, while the contact line climbs. Later, a RUC shock moves up from the pinched-off portion and a broadening RW appears between the meniscus and the RUC shock as in Fig. 2. In the experiments, the leading UC shock is stable, while the RUC shock becomes unstable and begins to finger as predicted[11]. The dimensionless fingering wavenumber () is which is close to the most unstable wavenumber of predicted by linear theory[11]. As the film evolves, a flat region () appears just behind the RUC shock.
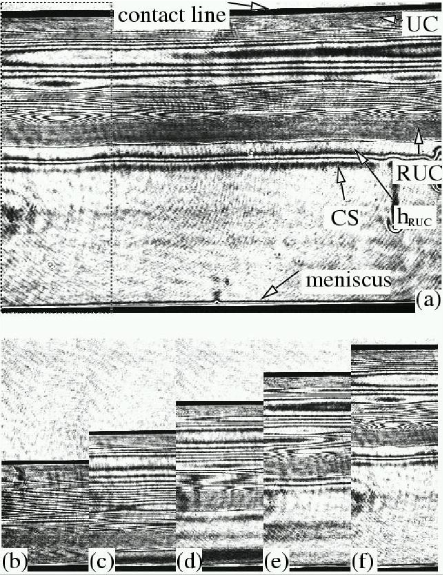
The film thickness just above the meniscus is determined by balancing surface tension gradient, gravity, and curvature[3]. Thus, the inclination angle and the surface tension gradient control . Here, we fix and we vary to control . Decreasing , leads to increasing and . If , the a flat region with a CS replaces the RW just behind the region as in Fig. 3.
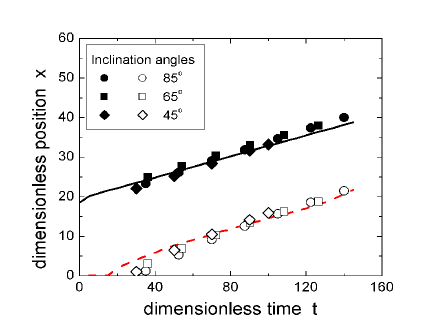
The position of the leading UC shock is linear in time, while the RUC shock shows transient nonlinear motion, consistent with the theoretical model (see below). The leading UC shock is the same as the one observed in the Cal experiments and the speed is the same as in[7]. The RUC shock is always faster than the leading UC shock, so that the size of the bump dwindles. The RUC shock position as a function of time for different inclination angles all collapse when the position is rescaled by , and time is rescaled by , as shown in Fig. 4.
To compare the experimental data with the model, we need boundary and initial conditions. Ahead of the contact line, we choose the simplest boundary condition consistent with complete wetting: a precursor model with as [6, 13, 14]. As shown previously[6, 7, 15], determines both the height and speed of the leading UC shock. This in turn determines the height and speed of the trailing reverse undercompressive wave. We find that gives the best approximation of the leading edge of the advancing film in these experiments. In the model, we take to be the position of the edge of the meniscus. For the lower boundary condition, we assume the meniscus has just pinched off a film of thickness with zero third derivative , i.e. that the meniscus enforces a zero net curvature gradient on the bulk film region. The initial condition is the simplest approximation of a draining film, that of constant film thickness for the range , where is given by the initial dipping and draining of the film. The parameters and can be measured precisely in the experiment. The value is chosen to produce a total volume of fluid consistent with what is observed in the experiment.
We numerically integrate (2) forward in time and compare with the experimental data in Figs. 2 and 3. In both cases and are determined from experimental data and is chosen to match the volume of fluid observed to pinch off in the experiment. The viscosity varies with temperature in the experiment. We choose a viscosity for the time rescaling of (2) that is optimized for agreement with the data while consistent with the experiment.


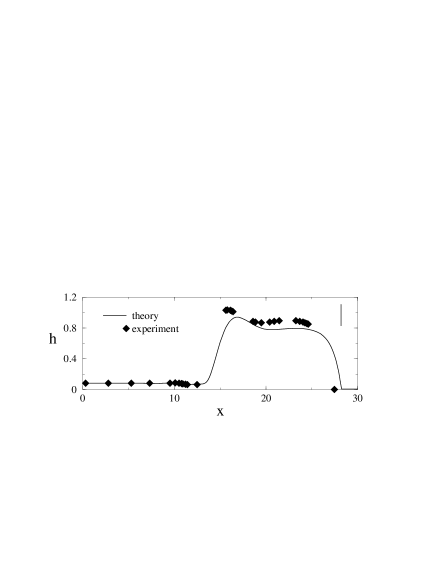
Fig. 5 shows the theoretical thickness profile compared with the experiment from Fig. 2a, the dimensionless time is 140. The numerical solution evolves into a structure composed of a leading UC shock, trailing RUC shock, and expanding RW, shown closeup in the bottom portion of Fig. 5. The leading UC shock speed and height are determined by the precursor thickness as in previous studies [6, 7]. The RUC shock speed and height are determined by the height of the leading UC shock, and hence also determined by the precursor. Fig. 5 shows a well developed structure, however at early times the RUC experiences a period of adjustment before it settles into a traveling wave shape, while the leading UC shock forms almost immediately. The trailing RW expands between the meniscus region (set by the boundary condition in the model) and the RUC shock. The trailing side of the RUC shock has a thickness . If is greater than , a RW forms between the RUC shock and the meniscus. Otherwise a CS forms to connect the meniscus pinch-off thickness to the thickness . This CS is seen to slowly separate from the RUC shock. Fig. 6, which compares the PDE solution with the data from Fig. 3a, in which . A CS forms to the left of the RUC shock, as shown close up in the bottom of Fig. 6. At this of , we are close to this transition point, and the experimental results are quite sensitive to changes in the initial draining film profile.

The experiments presented show clear evidence of the new UC-RUC double shock structure predicted by Münch. Our experimental results are compared with a lubrication model in which the pinch-off dynamics of the meniscus are incorporated into a boundary condition. There is good agreement between theory and experiment. The dynamics between the RUC shock and the meniscus can result in either a RW or a CS, depending on the pinch-off thickness compared with the RUC film thickness . Both situations are seen in the experiment and compared with theory. Future studies should address the nonlinear dynamics of the trailing RUC shock. Also the effect of temperature on viscosity is not considered in the model here but clearly plays a role in the experiment.
We thank A. Münch for sharing an advanced copy of his manuscript and A. M. Cazabat for helpful comments about the experiment. This work is supported by NSF grant DMS-0074049 and ONR grant N000140110290.
REFERENCES
- [1] V. Ludviksson and E. N. Lightfoot, Am. Inst. Chem. Engrs. J. 17, 1166(1971).
- [2] A. M. Cazabat, F Heslot, S. M. Troian, and P. Carles, Nature 346, 6287(1990).
- [3] P. Carles and A. M. Cazabat, J. Coll. Int. Sci. 157, 196(1993).
- [4] H. Huppert, Nature 300, 427(1982).
- [5] X. Fanton, A. M. Cazabat, and D. Quéré, Langmuir 12, 5875(1996).
- [6] A. L. Bertozzi, A. Münch, X. Fanton, and A. M. Cazabat, Phys. Rev. Lett. 81, 5169(1998).
- [7] M. Schneemilch and A. M. Cazabat., Langmuir 16, 8796(2000); 16, 9850(2000).
- [8] D. E. Kataoka and S. M. Troian, J. Coll. Int. Sci. 192, 350(1997); 203, 335(1998).
- [9] A. L. Bertozzi, A. Münch, and M. Shearer, Physica D 134, 431(1999).
- [10] A. L. Bertozzi, A. Münch, M. Shearer, and K. Zumbrun, Eur. J. Appl. Math. 12, 253(2001).
- [11] A. Münch, preprint submitted to Phys. Rev. Lett., (2002).
- [12] A. L. Bertozzi and M. Shearer, SIAM J. Math. Anal. 32, 194(2000).
- [13] A. L. Bertozzi and M. P. Brenner, Phys. Fluids 9, 530(1997).
- [14] S. M. Troian, E. Herbolzheimer, S. A. Safran, and J. F. Joanny, Europhys. Lett. 10, 25(1989).
- [15] A. Münch and A. L. Bertozzi, Phys. Fluids 11, 2812(1999).