Percolation, depinning, and avalanches in capillary condensation of gases in disordered porous solids
Abstract
We propose a comprehensive theoretical description of hysteresis in capillary condensation of gases in mesoporous disordered materials. Applying mean-field density functional theory to a coarse-grained lattice-gas model, we show that the morphology of the hysteresis loops is influenced by out-of-equilibrium transitions that are different on filling and on draining. In particular, desorption may be associated to a depinning process and be percolation-like without explicit pore-blocking effects.
pacs:
05.50.+q,05.70.Fh,64.60.CnHysteresis in the capillary condensation of gases adsorbed in disordered mesoporous materials has been widely studied, but its theoretical interpretation remains controversial. Experimentally, it is mainly observed in sorption isotherms measuring the amount of fluid present in the solid as the pressure of the ambient vapor (or the chemical potential ) is gradually increased and then decreased. Experiments have been performed in various adsorbents, from low-porosity glasses to very light silica aerogels, and the main observations can be summarized as follows: i) the hysteresis loop shrinks as the temperature increases and vanishes above a certain temperature E1967 ; ball89 ; G1999 ; ii) draining occurs over a narrow range of pressures, which usually results in an asymmetric shape of the loop; iii) the shape also depends on the geometric and energetic properties of the solid and may change from smooth to rectangular as the porosity increasestul99 ; iv) when the hysteresis is smooth, there is a whole family of scanning curves obtained by performing incomplete filling-draining cyclesE1967 ; lilly93 , and in the early stages of the drainage, the emptied regions exhibit long-range fractal correlations, reminiscent of invasion percolationweitz93 . The conjunction of these observations cannot be explained by the various mechanisms of hysteresis that have been proposed in the literature, either modelling the solid as a collection of independent poresE1967 or focusing on kinetic network effects (e.g., pore-blocking)M1983 . In an effort to provide a single unifying theoretical framework, we have recently presented a new description of capillary condensation in disordered materials that allows for the study of both equilibrium and out-of-equilibrium phenomenaK2001 . Applying mean-field density functional theory (i.e., local mean-field theory or MFT) to a lattice-gas model that incorporates at a coarse-grained level the geometric and energetic disorder of an interconnected porous structure, we have shown that the experimentally observed hysteretic behavior is related to the appearance of a complex free-energy landscape with a large number of metastable states; the main result is that hysteresis can occur both with and without a true equilibrium phase transition.
In this letter, we use the same theoretical framework to show that the morphology of the hysteresis loop is affected by out-of-equilibrium phase transitions (which differ on adsorption and desorption) and that the presence of the interface between the gas reservoir and the porous solid has a dramatic influence on the hysteretic behavior. A major finding of our study is that desorption can involve a percolation process without invoking additional kinetic mechanisms such as pore blocking. To understand the changes of morphology of the sorption isotherms and the out-of-equilibrium collective phenomena, we borrow from studies on avalanches and criticality in low-T ferromagnetic materials (i.e., Barkhausen noise)sethna93 ; planes99 ; tadic96 and on driven interfaces and depinning in systems with quenched disorderrobbins92 ; nowak98 . Whereas most of these studies are at T=0, MFT allows us to consider finite temperatures, which are relevant for capillary condensation, and to relate such phenomena as avalanches and interface depinning to the properties of the underlying free-energy surface.
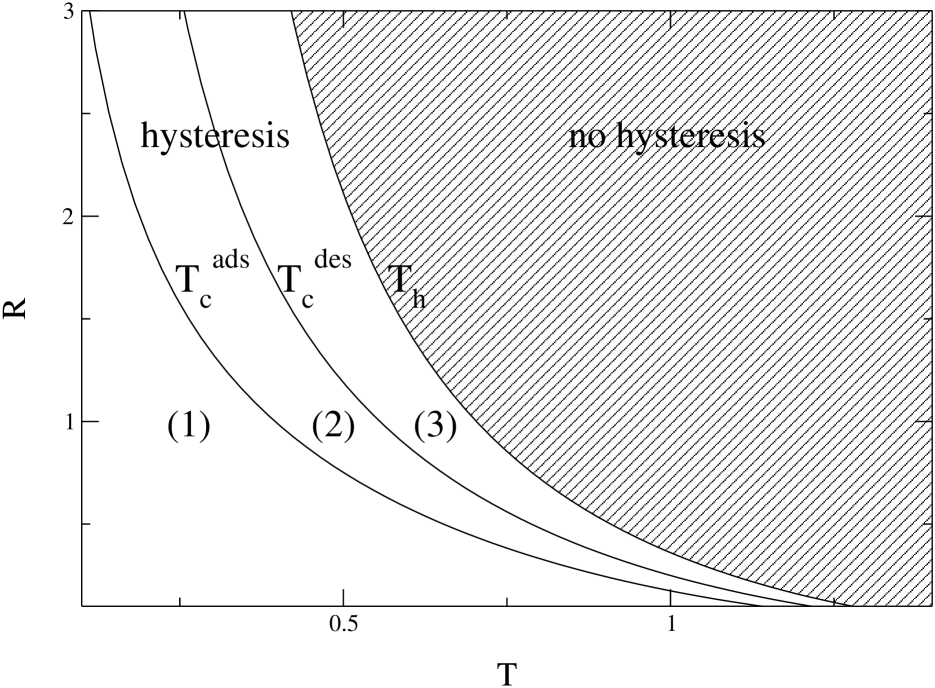
The hysteresis behavior seen experimentally can be rationalized by considering the phase diagram plotted in Fig. 1, that schematically summarizes the present study. More details will be given in a forthcoming publicationDKRT2002 . parametrizes the effective strength of the solid-induced perturbation and may depend in a complicated fashion on the porosity and on the solid-fluid interaction. Within MFT, there are lines of out-of-equilibrium critical points separating a region (1) (low , low ) in which both the adsorption and desorption isotherms have a jump that represents a first-order-like transition (an infinite avalanche), an intermediate region (2) in which the adsorption is smooth and the desorption discontinuous, and a region (3) (high , high ) in which the two branches are smooth and the desorption is essentially percolation-like. These collective phenomena take place below at which hysteresis first appears. (The equilibrium transition discussed previouslyK2001 is not considered here.) These sharp out-of-equilibrium transitions are well defined in MFT in which thermally activated processes are neglected. In experiments, these phenomena are observable when the experimental time scale is smaller than the equilibration time. The fact that the measured hysteresis loops are quite reproducibleE1967 ; ball89 ; G1999 and closely resemble those predicted by MFT strongly supports the existence of such a separation of time scales. Note also that avalanche events associated to capillary condensation are indeed observedlilly93 ; lilly96 .
As in previous studiesK2001 , we use a disordered lattice-gas model whose Hamiltonian is
| (1) | |||||
where and denote the fluid and matrix occupation variables, respectively, and stands for nearest-neighbor pairs of sites. We consider the simplest matrix microstructure in which matrix “particles” are distributed randomly over a 3-dimensional lattice of sites. The influence of the matrix is then specified by two parameters, the average matrix density that controls the porosity, and the interaction ratio that controls the wetting properties of the solid/fluid interface. The results are qualitatively similar for more realistic matrix microstructuresDKRT2002 . The lattice is periodically replicated in all directions. To study surface effects we consider two different setups, by letting or not a slab of width free of matrix sites: this defines a region (a “reservoir”) that only contains bulk vapor (at least for the thermodynamic conditions under study) with two planar interfaces in the x-direction (see Fig. 3).
For a given realization of the random matrix, the fluid density profile is obtained from minimization of the mean-field grand-potential functionalK2001 , which yields a set of coupled equations,
| (2) |
where and the sum is over the nearest-neighbors of site . These nonlinear equations are solved by a simple iterative method, increasing or decreasing progressively to obtain the sorption isotherms (i.e., ) or performing more complicated trajectories to obtain the scanning curves. The results are illustrated here for a bcc lattice, either for a single sample of linear size () with , or, when the slope of the sorption isotherms is steep and exhibit strong variations with , through a finite-size scaling analysis after averaging over several hundreds of matrix realizations.
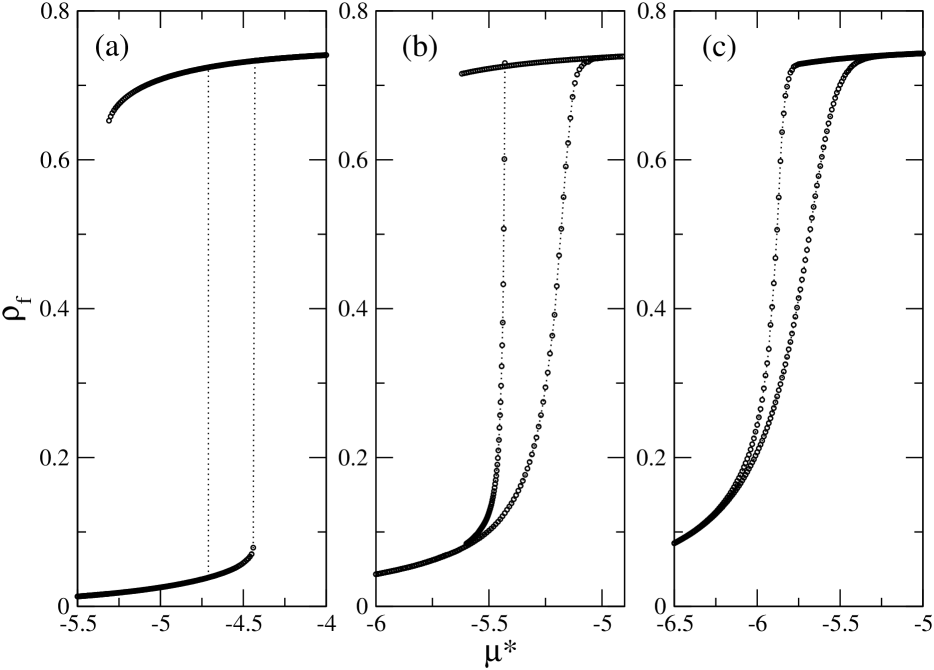
The shape of the hysteresis loop depends on and . Here, for the sake of clarity, we only discuss the variation with the interaction ratio while keeping and constant (then controls the strength of the local random fields in the systemK2001 ). Typical results obtained for and are shown in Fig. 2. One first notices that introducing an external interface has a major influence on the desorption branch, the adsorption branch being itself unaffected (see alsoSM2002 ). This influence is strongest at small and vanishes for : the presence of the surface reduces the range of stability of the metastable adsorbed liquid (the flat, upper part of the desorption curve in Figs. 2a,b), thereby narrowing the hysteresis loop. One can also see that the discontinuous jumps present in the sorption isotherms for (region (1) of Fig. 1) are replaced by smooth variations for and (region (3) of Fig. 1) and that the hysteresis loops become asymmetric, as observed in experiments.
Why is the desorption so sensitive to the presence of the external surface? For pores of simple geometry, one knows that draining is facilitated by the contact with the gas reservoir because of the presence of a meniscus that, at a given , can traverse the whole pore at no free-energy cost. However, this picture cannot be simply transposed to disordered porous materials: this is illustrated by the large- case for which the interface has no effect at all. The key-concept for understanding the results shown in Fig. 2 is that of pinning and depinning of a driven interface in the presence of quenched disorder. Consider the desorption process when slowly decreasing from , the chemical potential at bulk liquid-gas coexistence. At first, the interface between the external vapor and the adsorbed fluid is pinned by the disorder, i.e., it only enters superficially in the material and this latter stays macroscopically filled with liquid. As one further reduces , several situations are encountered. For a large enough interaction ratio , bubbles of gas may appear in the bulk of the porous medium, and the mass adsorbed decreases continuously as these bubbles grow, coalesce, and eventually extend over the whole pore space; this phenomenon is insensitive to the presence of the surface, as illustrated by Fig. 2c. For smaller values of , no bubbles of gas appear in the bulk of the material. This can be inferred from the fact that the same system without external surface does not drain until much smaller values of are reached (Figs. 2a,b). The draining mechanism is thus the depinning of the interface with the bulk vapor: for a certain chemical potential , the driving force on the interface is large enough to erase the free-energy barriers, and the interface sweeps through the whole system, which results in the rapid drop seen in the desorption isotherm.
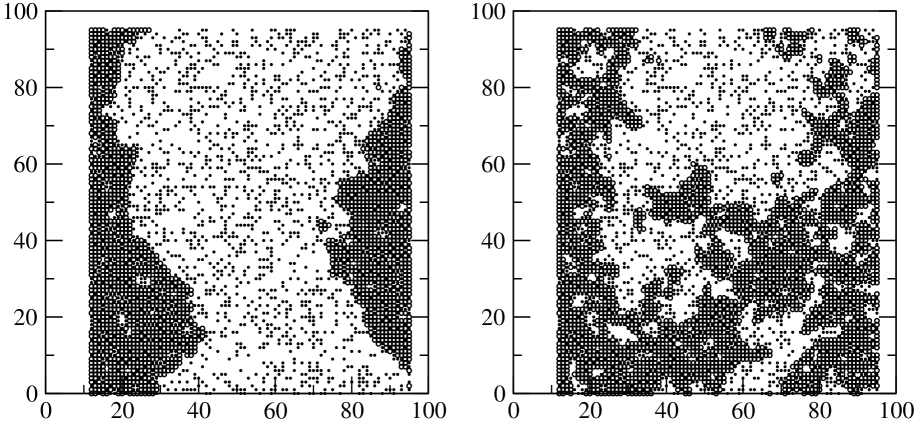
Two different cases can occur as approaches from above. For a small interaction ratio (Fig. 2a), the surface of the growing gas region inside the solid keeps a well-defined orientation at long length scales (that of the initial interface with the bulk vapor), and, exactly at , the desorption proceeds discontinuously, as shown in Fig. 2aRem . For intermediate values of (Fig. 2b), the growing interface has no well-defined orientation; it is rather isotropic and self-similar, and the desorption is rapid (at least in the early stage of draining), but continuous, as in invasion percolation. The former case corresponds to a compact growth of the gas region with a self-affine interface and the latter to a self-similar growth, characteristic of percolation: this is illustrated in Fig. 3 showing the drained regions where (since for a large majority of sites, is found either lower than or larger than , drained sites can be conveniently defined by this thresholdDKRT2002 ). It should be stressed that the percolation-dominated draining process which is observed for intermediate values of does not require the introduction of kinetic constraints such as pore blocking. The experimental observations for hexane in Vycorweitz93 can thus be interpreted without invoking this latter mechanism.
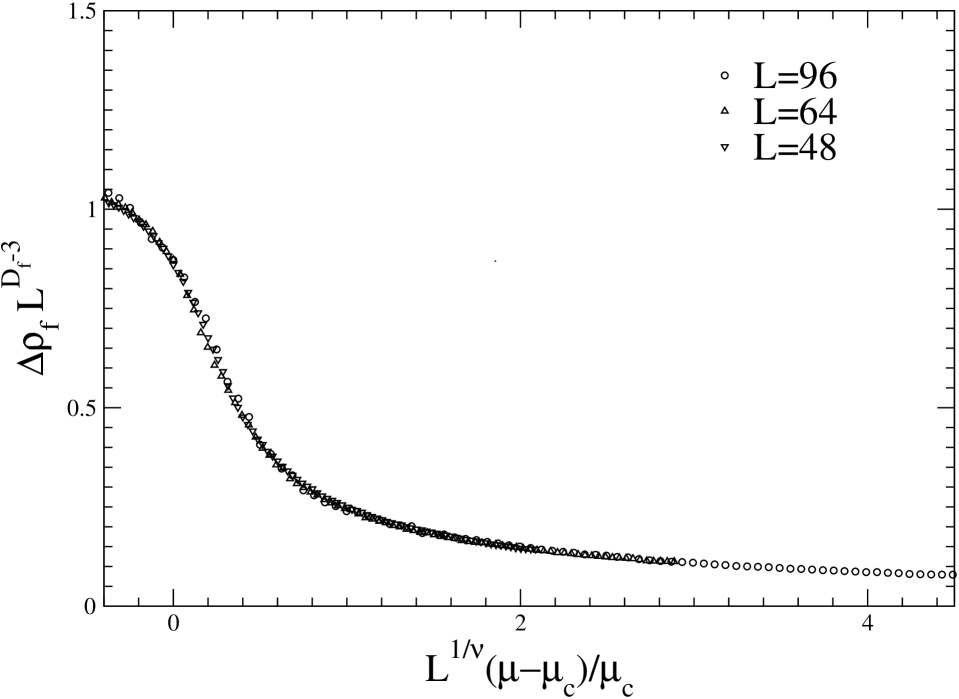
One can extract the exponents controlling the critical behavior as by performing a finite-size scaling analysis of . This is shown in Fig. 4 for the percolation regime: there, the value of is compatible with that of 3D percolation, whereas the value of the fractal dimension is somewhat larger, for reasons as yet unclear. A similar analysis can be carried out in the self-affine regime, and more details will be given elsewhereDKRT2002 . At a critical value of somewhere between and , there is a morphology transition from self-affine to self-similar growth, which corresponds to a transition from a discontinuous desorption to a continuous, percolation-like desorption. This is similar to what is observed for domain growth in random magnets or in fluid invasionrobbins92 , playing the role of the parameter controlling the wetting properties of the invading liquid.
Since the filling process is not affected by the presence of the interface with the gas reservoir, the jump in the adsorption isotherm observed in Fig. 2a has not the same origin as that in desorption (note that we had to perform a finite-size scaling study to conclude on the existence of a jump in the thermodynamic limitDKRT2002 ). It corresponds to the appearance of a macroscopic, connected network of liquid regions in the bulk of the porous medium. In MFT, this is again a bona fide phase transition, albeit out-of-equilibrium: it is similar to the infinite avalanche seen in the Barkhausen noise of low-T ferromagnetic materials and discussed in Refs.sethna93 ; planes99 ; tadic96 . One then expects that the adsorption isotherm should change from discontinuous to continuous at some critical value of (see Fig. 2).
Similar modifications of the hysteresis loop are observed when changing at constant and DKRT2002 : at low T there are macroscopic avalanches on draining and on filling that disappear at two different critical temperatures, and ; for higher , both the adsorption and the desorption branches are continuous, and at the two branches merge and the isotherm become fully reversible. This leads to the phase diagram illustrated in Fig. 1. Similar changes in the shape of the loop also occur when varying the porosity at constant DKRT2002 . This may account for the experimental observations on aerogelstul99 .
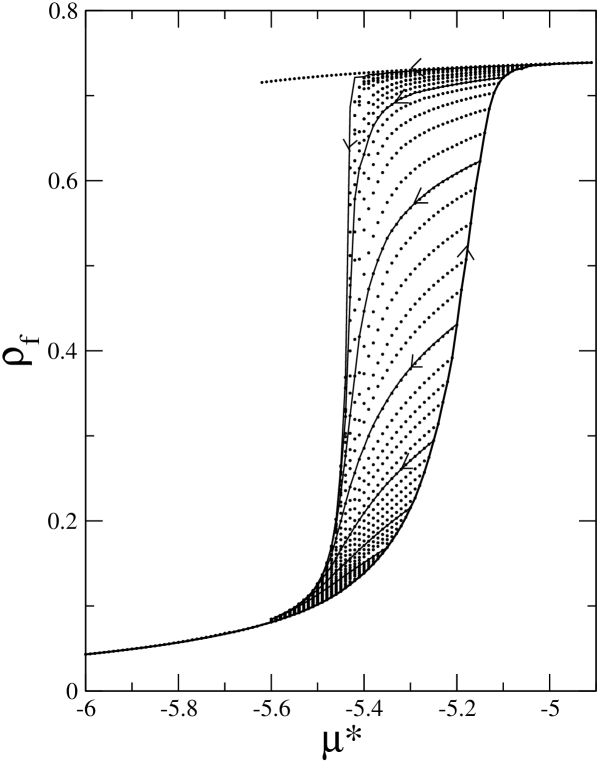
Finally, we have also studied the connection between the above results and the characteristics of the free-energy landscape. Below the hysteresis line (see Fig. 1), MFT predicts the appearance of a large number of metastable states (minima of the grand-potential functional) in which the system can get trapped. Untrapping only occurs under the influence of the external driving force, i.e., the change in . We again emphasize that this picture is valid provided the thermally activated processes for relaxation (processes that are for instance responsible for the creep motion of pinned interfacesnowak98 ) are slower than the experimental timescale. The metastable states are responsible for the hysteresis loop discussed above as well as for the scanning curves and the inner subloops. Fig. 5 displays some of these states obtained by performing desorption scanning trajectories in the system without surface for (additional metastable states could be obtained by the procedure explained in Ref.K2001 ). It is remarkable that the hysteresis loop obtained in the presence of the external surface appears as the true envelope of the scanning curves (compare with Fig. 2b), an observation that holds for all the cases studied.
In summary, by combining mean-field density functional theory and a coarse-grained lattice-gas model, we have provided a comprehensive picture of hysteresis in capillary condensation of gases in disordered mesoporous solids. We have shown that the change of morphology of the hystereresis loop is related to the occurence of out-of-equilibrium phase transitions whose nature is different on adsorption and on desorption: this is due to the presence of an interface between the porous matrix and the gas reservoir.
The Laboratoire de Physique Théorique des Liquides is the UMR 7600 of the CNRS.
References
- (1) D. H. Everett, in The Solid-Gas Interface, edited by E. A. Flood (Marcel Dekker, New York, 1967), Vol. 2, p. 1055.
- (2) P. C. Ball and R. Evans, Langmuir 5 714 (1989).
- (3) see, e.g., L. D. Gelb et al., Rep. Prog. Phys. 62 1573 (1999) and references therein.
- (4) D. J. Tulimieri, J. Yoon, and M. H. W. Chan, Phys. Rev. Lett. 82, 121 (1999).
- (5) M. P. Lilly, P. T. Finley, and R. B. Hallock, Phys. Rev. Lett. 71, 4186 (1993).
- (6) J. H. Page et al., Phys. Rev. Lett. 71, 1216 (1993); J. H. Page et al., Phys. Rev. E 52, 2763 (1995).
- (7) G. Mason, J. Colloid Interface Sci. 99, 277 (1983); N. A. Seaton, Chem. Eng. Sci., 46, 1895 (1991); R. A. Guyer and K. R. McKall, Phys. Rev. B 54, 18 (1996).
- (8) E. Kierlik et al., Phys. Rev. Lett. 87, 055701 (2001); E. Kierlik et al., cond-mat/0205663 (2002), to appear in J. Phys.: Condens. Matter.
- (9) J. P. Sethna et al., Phys. Rev. Lett. 70, 3347 (1993); O. Perkovic, K. Dahnen, and J. P. Sethna, Phys. Rev. Lett. 75, 4528 (1995).
- (10) E. Vives and A. Planes, Phys. Rev. B 50, 3839 (1994); E. Vives et al, Phys. Rev. E 52, R5 (1995).
- (11) B. Tadic and U. Nowak, Phys. Rev.E 61, 4610 (2000).
- (12) H. Ji and M. O. Robbins, Phys. Rev. B 46, 5258 (1992); B. Koiller and M. O. Robbins, Phys. Rev. B 62, 5771 (2000).
- (13) U. Nowak and K. D. Usadel, Europhys. Lett. 44, 634 (1998); L. Roters et al., Phys. Rev. E 60, 5202 (1999).
- (14) E. Kierlik et al. (in preparation).
- (15) M. P. Lilly and R. B. Hallock, Phys. Rev. B 64, 024516 (2001).
- (16) L. Sarkisov and P. A. Monson, preprint (2002).
- (17) Note that the depinning transition is a critical transitionrobbins92 ; nowak98 : the average distance traveled by the interface before pinning occurs diverges as a power law when .