The structural relaxation of molten sodium disilicate
Abstract
We use molecular dynamics computer simulations to study the relaxation dynamics of Na2O–2(SiO2) in its molten, highly viscous state. We find that at low temperatures the incoherent intermediate scattering function for Na relaxes about 100 times faster than the one of the Si and O atoms. In contrast to this all coherent functions relax on the same time scale if the wave–vector is around 1Å-1. This anomalous relaxation dynamics is traced back to the channel–like structure for the Na atoms that have been found for this system. We find that the relaxation dynamics for Si and O as well as the time dependence of the coherent functions for Na can be rationalized well by means of mode–coupling theory. In particular we show that the diffusion constants as well as the –relaxation times follow the power–law predicted by the theory and that in the –relaxation regime the correlators obey the factorization property with a master curve that is described well by a von Schweidler–law. The value of the von Schweidler exponent is compatible with the one found for the mentioned power–law of the relaxation times/diffusion constants. Finally we study the wave–vector dependence of and , the coherent and incoherent non–ergodicity parameters. For the Si and O atoms these functions look qualitatively similar to the ones found in simple liquids or pure silica, in that the coherent function oscillates (in phase with the static structure factor) around the incoherent one and in that the latter is approximated well by a Gaussian function. In contrast to this, for Na–Na is always smaller than for Na and the latter can be approximated by a Gaussian only for relatively large .
pacs:
PACS numbers: 61.20.Lc, 61.20.Ja, 02.70.Ns, 64.70.PfI Introduction
In the last two decades our understanding of the structural and dynamical properties of glass forming liquids has increased impressively [1, 2, 3, 4]. This progress is due to significant advances in various experimental techniques (light and neutron–scattering, dielectric measurements, etc.), the development of new theoretical approaches and concepts (mode–coupling theory (MCT), landscapes, etc.) [5, 6, 7, 8] and last not least to the extraordinary advances that computer simulations have made [9, 10, 11, 12, 13]. The results of all these efforts is a widely accepted picture on the relaxation dynamics of glass–forming liquids: At high temperatures this dynamics is the one of a normal liquid and hence the typical time correlation functions decay exponentially in time and the –dependence of the typical relaxation times shows an Arrhenius–law. (Note that although there is a well developed theoretical machinery to describe the static properties of such liquids [14], an accurate understanding of the dynamics is still lacking.) With decreasing temperature the dynamics changes in that time correlation functions are no longer exponential and the –dependence of the relaxation times is often super–Arrhenius. In the past it has been shown that the slow dynamics observed in this temperature range can be rationalized very well by means of the so–called mode–coupling theory of the glass transition, and that often this theory is not only able to describe this dynamics qualitatively but even quantitatively [5, 15, 16, 17, 18, 19, 20, 21]. If the temperature is decreased even further the relaxation times increase very quickly and typically show an Arrhenius dependence on with an activation energy that is larger than the one found at higher temperatures. The details of the dynamics in this temperature range are not understood very well and also there exist no satisfactory theoretical description for it.
The presence of the three mentioned regimes in (Arrhenius, super–Arrhenius, Arrhenius) is the typical behavior found in the so–called “fragile” glass–forming liquids [22], which include polymers, most molecular glass–formers, and simple liquids. In contrast to this, the so–called “strong” glass–forming liquids (typical examples include silica and many other oxide glasses) show in the whole accessible temperature range an Arrhenius–law, i.e. no super–Arrhenius temperature dependence is found. Since it is one of the main achievements of MCT to rationalize this super–Arrhenius –dependence, it was believed for quite some time that the theory is not very useful for these type of glass–formers. In recent computer simulations it was shown, however, that most models for strong glass–forming liquids exhibit at sufficiently high temperatures deviations from the Arrhenius law found at intermediate and low temperatures [23, 24, 25, 26, 27, 28] and that in the temperature range in which these deviations are seen the relaxation dynamics can be described very well by MCT [25, 29, 30], in agreement with the results of some experiments [31, 32]. Therefore one can conclude that this theory is not only able to describe fragile glass–formers, but also all the intermediate and strong ones.
The results discussed so far concern systems in which the dynamics of all atomic species occurs on roughly the same time scale. There are, however, large classes of materials in which this is not the case. E.g. in superionic glass–formers, such as Na2O–SiO2 or mixed alkali glasses such as 0.5Na2O–0.5K2O–3SiO2, the alkali atoms move on a time scale which at low temperatures is many orders of magnitude faster than the one of the atoms constituting the matrix (here Si and O) [33, 34, 35, 36, 37, 38]. To what extent MCT is able to rationalize the very heterogeneous dynamics of these type of glass–forming systems is presently unknown, although recently evidence has been found that certain aspects of the relaxation dynamics can indeed be understood by means of the theory [39]. The goal of the present paper is therefore to do a detailed investigation of the relaxation dynamics of a prototype of such an ion–conducting glass–former, Na2O–2SiO2, and to see to what extent the predictions of MCT regarding the dynamics of glass–forming liquids hold. Note that although so far there has been no test of MCT for these systems, computer simulations have already been used for a long time to study such ion–conducting materials. Seminal work on this goes back more than twenty years to Soules et al. [40] who studied the structure of sodium–disilicate and to Angell et al. who looked at certain aspects of the diffusion dynamics [41, 42]. These early investigations were more recently followed up by similar studies on related systems and also many experimental investigations [43, 44, 45, 46, 47, 48, 49, 50, 51, 52, 53, 54, 55, 56, 57, 58, 59, 60, 61, 62, 63].
A further interesting feature of these systems is that the distribution of the alkali ions in the SiO2 matrix is not completely uniform but instead forms an interconnected network of small pockets and filaments [34, 43, 48, 52, 61]. Although for a long time there was no direct experimental evidence for the presence of these structures, recent neutron–scattering experiments of Meyer et al. on Na2O–2SiO2 showed a structural feature at a wave–vector Å-1 [64], in excellent agreement with the results from computer simulations that could attribute this peak to the presence of the above–mentioned network [39, 65, 66]. How the presence of these channels affects the relaxation dynamics is, however, so far not known and therefore the present paper is also a contribution to gain insight into this matter.
The remaining of the paper is organized as follows: In the next section we will describe the model used for the simulations as well as give their details. The following section is then devoted to the presentation of the results and in the final section we summarize and discuss them.
II Model and Details of the Simulation
The force field used in the present work is a modification of the one proposed by Kramer et al. to describe zeolites [67], i.e. crystalline materials that contain also Si, O and Na. This potential had the functional form
| (1) |
where is the distance between two atoms of type and . The parameters , , and can be found in Ref. [67]. Note that is an effective charge with values and . In Ref. [67] the effective charge of the sodium atoms was chosen to be , which has the disturbing effect that Na2O is not neutral. Hence we changed the potential of Ref. [67] somewhat, by assigning to the Na atom an effective charge [66]. This change of the charge affects of course the local structure and therefore we have added to a term which compensates this change at short distances. Hence the potential we used in our simulation is given by
| (2) |
with , , and . (Here is the usual Heaviside function.) The parameters Å-2 and Å were chosen such that at ambient pressure the resulting structure is in good agreement with the experimental results from neutron scattering [66]. Thus the potential used in the present work is at short distances very similar to the one proposed by Kramer et al. and is at large distances (where the effective charges are screened) modified such that all systems of the form Na2O–SiO2 are neutral.
In previous studies it has been shown that this potential is able to reproduce many structural properties of Na2O–SiO2, with , and also certain aspects of the relaxation dynamics of this model are in good qualitative agreement with experiments [39, 61, 65, 66, 68]. Although it cannot be expected that such a simple model is able to reproduce faithfully all the features of the relaxation dynamics of the real material it can be expected that the salient properties are at least correct from a qualitative point of view.
In the present simulation we integrated the equations of motions using the velocity form of the Verlet algorithm with a time step of 1.6 fs. At each temperature we first equilibrated the system by coupling it to a stochastic heat bath. This equilibration time exceeded the structural relaxation time of the silicon atoms (measured by means of the incoherent intermediate scattering function for a wave–vector 1.7 Å-1, which corresponds to the length scale of the distance between two tetrahedra, see below). Subsequently we started a production run in the NVE ensemble using a density of 2.37 g/cm3 which is close to the experimental value [69]. The number of particles was 8064 (, , ) in a cubic simulation box of size Å. Such a large system size is needed if one wants to avoid finite size effects in the relaxation dynamics [70, 71]. In addition, previous simulations have shown that sodium–silicate glasses have structural features that extend over 6–8 Å [39, 52, 61] and therefore also this calls for rather large system sizes. The temperatures investigated were 4000 K, 3400 K, 3000 K, 2750 K, 2500 K, 2300 K, and 2100 K. At the lowest temperature the length of the production run was 1.5 million time steps, which corresponds to 2.5 ns. In order to improve the statistics of the results we did at each temperature two completely independent runs.
III Results
The main quantities of interest in the present paper are and , the coherent and incoherent intermediate scattering functions for wave–vector . (Note that for isotropic systems, like the one studied here, these space–time correlation functions depend only on , the modulus of , i.e. there is no directional dependence. Therefore we have made use of this fact also in the analysis of our data and have averaged over all wave–vectors with the same modulus.) These two observables are not only of great theoretical interest [14] but can also be measured directly in neutron–scattering experiments [72]. They are given by
| (3) | |||||
| (4) |
Here is the position of particle at time , is the number of atoms of type , and is the total number of atoms.
In Ref. [66] we have shown that in NS2 the partial structure factors , , and have two pre–peaks: one at 0.94 Å-1 and a second one at 1.7 Å-1. (The “main”–peaks, corresponding to the length scale of a nearest neighbor pair of Si–O and Na–O are at Å-1 and Å-1, respectively.) The peak at is related to the distance between neighboring tetrahedra and thus corresponds to the so–called “first sharp diffraction peak” in pure silica. The peak at has recently been shown to be related to the typical distance between the channels mentioned in the introduction [39]. Unfortunately, due to cancellation effects in the partial structure factors (weighted with the appropriate experimental neutron scattering cross sections) it is hard to see this peak in a neutron scattering experiment done at room temperature [64, 66, 73]. However, the recent neutron–scattering studies of Meyer et al. have shown that this system shows at high temperatures, i.e. above K which is well above the glass transition temperature [69], a feature in the elastic signal at a wave–vector around 0.9 Å-1, i.e. very close to [64]. Thus we conclude that this structural feature is not only seen in the present model for NS2, but can be found in the real material as well. In the following we will demonstrate that these structural features have also a strong influence on the relaxation dynamics of the system.
In Fig. 1 we show the time dependence of the incoherent intermediate scattering function for all temperatures investigated. We see that at high temperatures the relaxation of the structure is relatively fast in that the correlation function decays, after the microscopic time scale which lasts around 0.2 ps, basically exponentially. From this graph we also recognize that at these temperatures this decay is about a factor of four faster for the sodium atoms than the one for the silicon atoms, and about a factor of three faster than the one for the oxygen atoms. This is in agreement with the values for the diffusion constants which at this temperature show the same dependence on the species [66]. At low temperatures the correlators have a time dependence that differs qualitatively from the one at high in that they show a plateau at intermediate times. This plateau is related to the fact that on this time scale the particles are trapped by their surrounding neighbors (a behavior which is often called “cage–effect”) and hence the time correlation function changes only slowly. Only for relatively large times the particles are able to leave this (temporary) cage and hence the correlators finally decay to zero. It is customary to call the dynamics in the time window in which the correlators are close to the plateau the “–relaxation” whereas the second relaxation step is called the “–relaxation”. From the figure we see that at low temperature, (the time scale for the –relaxation) of the sodium atoms is about a factor of 30 smaller than the one for the oxygen atoms and about a factor of 100 smaller than the one for silicon. Hence we conclude that the temperature dependence of depends on the species, also this in agreement with the one found for the diffusion constant [66]. Below we will discuss this dependence in more detail.
Also included in the figure is a fit to the curves at the lowest temperatures with a Kohlrausch–Williams–Watts–law (KWW), i.e. (dashed lines). We see that this functional form is able to describe the data very well in the –relaxation regime, as it is usually the case for the relaxation dynamics of glass–forming liquids. The value of the exponent is 0.8 for Si and O and 0.47 for Na. Thus we see that the relaxation dynamics is not very stretched for the atoms making up the matrix whereas it is very stretched for the network modifier. Below we will come back to a possible interpretation for this low value of . (Note that a high value of for Si and O is in agreement with the observation that also in pure silica the correlators for these length scales are not very stretched [66]. The presence of sodium does, however, indeed lower the value of somewhat.)
Having discussed the species and temperature dependence of we now focus on the coherent function , defined in Eq. (3), since that one gives the information how the overall structure of the system relaxes. The time and temperature dependence of and is shown in Fig. 2 (the one for the O–O correlation is similar to the one for Si–Si). A comparison of the curves in this figure with the incoherent functions, Fig. 1, shows that for the case of silicon the coherent and incoherent functions are very similar in that the height of the plateau at intermediate times as well as the typical relaxation times for the –relaxation are quite comparable. This is the usual behavior found for glass forming systems such as pure silica, water, or simple liquids [30, 74, 75]. In contrast to this the time dependence of for sodium differs strongly for the coherent function in that the relaxation time of the former is about a factor of ten smaller than the one of the latter. This shows that the relaxation dynamics of the sodium atoms has unusual features. In fact it has been shown in Refs. [39, 61] that the motion of a tagged Na atom is relatively fast in that the particles hop between certain preferential sites (generated by the Si–O matrix). However, the relative spatial arrangement of the Na particles (i.e. their global structure) does not change under this type of motion and hence the coherent function decays much slower than the incoherent one.
One of the important predictions of MCT is that close to the critical temperature of the theory the shape of the time correlation functions does not depend on temperature. This means that a correlator can be written as
| (5) |
where is the –relaxation time at temperature . To what extent this prediction, which is often called the time–temperature superposition principle (TTSP), holds can easily be tested by plotting the correlators versus . For this we have defined the –relaxation time as the time it takes the correlator to decay to 0.1. Although this definition (and the value 0.1) is somewhat arbitrary, it is easy to see that if the TTSP holds the details of the definition do not matter. In Fig. 3 we show the correlators as a function of for all temperatures investigated. We see that for silicon and oxygen the TTSP holds basically for the whole –range. In the case of sodium we have already shown that its dynamics is very different from that of Si and O in that, e.g., for one obtains a very different stretching exponent from that for and at a given . However also for the TTSP work for low temperatures, K. That for this species the TTSP does not work for higher temperatures is reasonable since for K the typical –relaxation times are still of the order of a few picoseconds only (see Fig. 1b) and thus the –relaxation regime is not well separated from the microscopic dynamics. Note that if one would be able to equilibrate the system at even lower temperatures it can be expected that the TTSP starts to break down, since at low the dynamics is likely to be dominated by a simple diffusive motion in which the single step is the breaking of a Si–O bond, a behavior which has been found in pure silica [25]. Hence one can expect that this affects also the sodium dynamics and thus to the breaking down of the TTSP.
The correlators discussed so far were for Å-1, the length scale corresponding to the typical distance between two neighboring tetrahedra. We now investigate how the –relaxation time depends on the wave–vector as well as on the particle species. In Fig. 4 we show the –dependence of as determined from the incoherent correlators as well as some of the coherent ones. The temperature is K, thus the lowest temperature at which we were able to fully equilibrate the system. Since for the case of a diffusive motion the relaxation time of the incoherent function is equal to (: diffusion constant) we plot directly which can be understood as an inverse –dependent diffusion constant. We first start with the particles forming the matrix, i.e. Si and O. We see that for these elements from the incoherent functions increases weakly with increasing , goes through a maximum and then decreases again at large . The location of this maximum is around 2.8 Å-1, i.e. at the wave–vector at which the static structure factor has the peak that corresponds to the distance between neighboring Si–O. The same type of –dependence has also been found in the case of pure SiO2 [30] and it reflects the fact that on this length scale the system is particularly rigid. The relaxation times of the coherent functions have a more complex –dependence in that they oscillate around the for the incoherent function. This oscillation is in phase with the corresponding static structure factor, an effect that is known as de Gennes–narrowing [14] and which is found in simple liquids [75] but also in a system like pure silica [30], or water [74]. From the figure we recognize that the largest relaxation time is at a wave–vector Å-1, which corresponds to the length scale of the network of channels discussed in Refs. [39, 61]. The different chemical ordering of silicon and sodium leads to the presence of an additional intermediate length scale which is reflected in the dynamics of sodium in that the trajectories of the sodium atoms are restricted to a network of channels in a Si–O matrix. This network of channels is reflected in the collective correlations by the slowest relaxation process of our system, the rearrangement of the channel structure. Finally we remark that for wave–vectors below 0.95 Å-1 exhibits a very steep increase: We see that in this range of values the curves are very well compatible with a straight line which corresponds to a growth of the relaxation times like , where is a positive constant. Although we are not aware of any theoretical reason for such a dependence it seems to describe our data remarkably well over two decades in .
For the sodium atoms the –dependence of is more complicated than the one for Si and O. For the coherent correlators this function is qualitatively similar to the one found for Si–Si and O–O. In particular we find again a pronounced peak at Å-1, i.e. the length scale of the channels. Note that close to this peak also the absolute value of is close to the ones for Si and O which shows that on this length scale the spatial arrangement of the Na atoms can only relax if the Si–O matrix relaxes. The relaxation time for the incoherent Na function behaves very differently. First of all we see that it is significantly smaller than the one of the coherent function, in agreement with our conclusions from Figs. 1 and 2. Also this function increases for small and intermediate wave–vectors, shows a maximum at the location of the corresponding peak in the partial structure factor (included in the figure as well) and then decreases for even larger . It is not possible to determine the relaxation times of for Å-1 with our definition because for large wave-vectors has already decayed to values around or lower before the –relaxation starts to develop (see Fig. 8 below). In contrast to that we can determine the relaxation times for also for relatively large wave–vectors. Since for sufficiently large one has , we know that in this limit the relaxation times for have to approach the ones for . This implies that the curve for the Na–Na correlation must start to decrease quickly in order to approach the one for the Na correlation. Hence we expect that for large wave–vectors the relaxation times for the Na–Na correlation become significantly smaller than the one of the matrix. An inspection of the correlation functions shows however, that this is not yet the case for wave–vectors smaller than 3.5 Å-1.
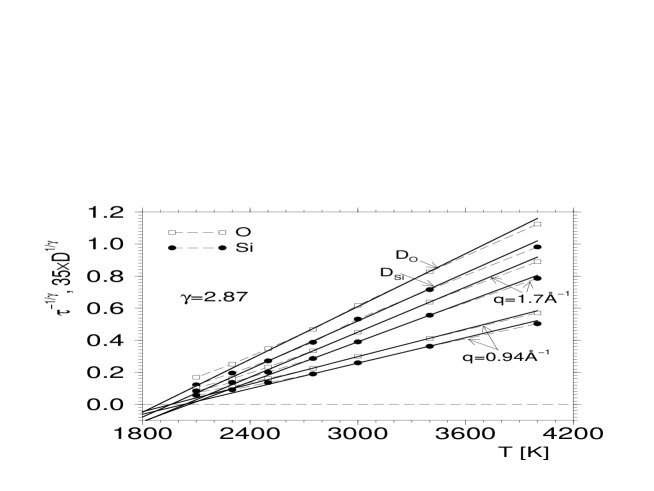
In an earlier study of pure silica, the paradigm of a “strong” glass–former, we found the surprising result that the temperature dependence of the diffusion constant as well as the viscosity show at high temperatures a significant deviation from the expected Arrhenius law [25]. In that paper it was argued that this deviation can be rationalized by mode–coupling theory which predicts the existence of a “critical temperature” close to which the transport coefficients show a non–Arrhenius behavior [5]. Since significant deviations from an Arrhenius law have been observed also for the sodium–silicate system investigated here [66] it is reasonable to see to what extent MCT is able to rationalize the relaxation dynamics. The theory predicts that close to the temperature dependence of the diffusion constants or –relaxation times is given by a power–law:
| (6) |
Here is a system–universal constant, i.e. it does not depend on what species or wave–vector one considers. In addition MCT predicts that the value of the exponent has a one–to–one correspondence with the exponent of the so-called von Schweidler-law that is discussed below. This connection is given by
| (7) |
i.e. the second equation can be used to determine the value of from and then the first equation can be used to calculate . (Here is the usual function.) In Ref. [39] we have shown that the value of is around 0.47 (see also Fig. 6 below). Hence Eqs. (7) give a value of , which can be considered as the theoretical estimate of MCT for the exponent. If the prediction of the theory on the power–law and the value of the exponent is correct, a plot of (or ) vs. should give a straight line. This type of plot is shown in Fig. 5 for the relaxation times for the wave–vectors Å-1 and Å-1 as well as the diffusion constants (which were determined from the long time limit of the mean squared displacement of a tagged particle [66]). Note that we have not included the data for Na, since, as shown in Ref. [66], the diffusion constant for Na follows an Arrhenius law in the whole temperature range, and hence the power–laws given by Eq. (6) certainly do not hold for this species. We see that all the curves do indeed show a straight line in a temperature interval that is quite substantial. Linear fits in this region are included in the graph as well (solid lines). Furthermore we see that the extrapolation of these straight lines to lower temperatures intersects the –axis at a point, the critical temperature , which depends only weakly on the time considered, and which is around 2000 K. Hence we conclude from this figure that the relaxation times and diffusion constants for Si and O do indeed show the predicted power–law dependence with a common exponent and a common critical temperature . Finally we note that in the temperature interval in which and show this power–law these quantities change by about two orders of magnitude and hence the existence of the power–laws is not just in a trivial matter. Note that although MCT predicts that at the relaxation times should diverge, in reality this is not found. The reason for this is that once the relaxation times have increased beyond a certain value, for atomic systems usually on the order of 10 ns, the system starts to relax via processes that currently can be taken into account by the theory only in a schematic way. Despite the presence of these processes, usually called “hopping processes” the theory is still able to make prediction on the relaxation dynamics on the time scale of the –relaxation. For more details we refer to Refs. [5, 76]. The presence of these hopping processes for the present system can be inferred from Fig. 5 in that the data points for K are above the theoretical straight line, i.e. the relaxation is faster than predicted from the power–law.
Having discussed the relaxation dynamics of the system in the –regime, we now turn our attention to the –regime, i.e. the time window in which the correlators are close to the plateau (see Fig. 1). One of the main predictions of MCT is that in the –regime and for temperatures close to the time dependence of the correlation function is system universal in that any time correlation function can be written as
| (8) |
Here is the height of the plateau, often also called non–ergodicity parameter, and the whole time dependence is in the system universal function . Due to its structure, Eq. (8) is often called “factorization property”, since factors into a time dependent function and a –dependent function. (Note that this factorization property holds also for the case that hopping processes are present [5, 76].) The time dependence of is given by the solution of a non–linear equation which can be solved numerically [5]. However, it can be shown that very close to this solution is given by the following form [77]:
| (9) |
This approximation is good for times at which the correlators have started to fall below the plateau, but are still close to it. The first power–law of Eq. (9) is often called “von Schweidler–law” and the exponent the “von Schweidler–exponent”. Note that, since is predicted to be independent of the correlator, also the value of should be the same for all . However, since Eq. (9) also includes the first correction term to this asymptotic result, the coefficient will depend on the correlator. In Fig. 6 we show the time dependence of the incoherent intermediate scattering function for the oxygen atoms for various wave–vectors (at K). Also included are fits with the functional form given by Eqs. (8) and (9) using the height of the plateau as a fit parameter. The dotted lines correspond to a fit in which is only given by the von Schweidler–law, i.e. the first term on the RHS of Eq. (9), whereas the dashed line is the case that also the second term in Eq. (9) is taken into account. In these fits and were fit–parameters that were allowed to depend on , whereas the exponent was a global fit–parameter. From the figure we conclude that the von Schweidler–law is indeed able to describe well the dynamics close to the plateau. Furthermore we see that the inclusion of the correction term increases the time window for which this law holds by about a factor of ten in qualitative agreement with the results of such an analysis for other glass–forming liquids [5, 30, 74, 75]. We also mention that a similar good fit is obtained for the case of for Si. In Ref. [39] we showed the same type of fits for the coherent functions of Si and O and found that also for these correlators the –regime is described very well by the functional form given in Eq. (9). Hence we conclude that in the –regime the relaxation dynamics is indeed independent of the correlator.
We emphasize that this universality holds only for the –relaxation regime and not for the –relaxation. For the latter one finds, that the stretching exponent , and therefore the shape of the correlator, depends on the species or the wave–vector. In particular we have discussed in Ref. [39] the wave–vector dependence of for the Na atoms and have shown that for small and intermediate , Å-1, changes significantly thus showing that the –relaxation is indeed not universal from this point of view.
In this context it is, however, very interesting that for the Na atoms becomes independent of for Å-1 [39], although in this –range the structure factor still shows pronounced features, i.e. is not a constant. Such a behavior was predicted some time ago by Fuchs who used MCT to show that , i.e. for large wave–vectors should converge to the von Schweidler exponent [78]. We have found that in our case this is indeed the case, i.e. that for large the stretching exponent is indeed compatible with [39]. Hence this nice agreement between our results and the prediction of MCT shows that the theory is indeed able to describe also this features of the relaxation dynamics of the present system. We also mention that for the case of a hard sphere system the MCT prediction for the independence of of holds only for wave–vectors that are much larger than the location of the first peak in the structure factor. The fact that for the present system this asymptotic value is reached already for quite small wave–vectors is thus rather surprising. We note, however, that a closer inspection of for Å-1 shows that the –relaxation regime of these correlators fall into the late –relaxation regime of all the other (slow) correlators in which the von Schweidler law holds. Thus, it seems that the relaxation processes in the –regime of the slow correlators that correspond to the universal von Schweidler decay are impressed onto the dynamical behavior of the single particle motion of the sodium atoms which leads to stretched exponential decay of with . For smaller wave-vectors this is not the case since there the –relaxation of overlaps essentially only with the plateau of the slow correlators.
The result in Fig. 6 shows that the time dependence of the correlation functions for the time regime in which they start to fall below the plateau is compatible with the functional form given in Eq. (9). The factorization property stated in Eq. (8) is, however, more general, since expression (9) is just the leading asymptotic prediction for . A different way to check to what extent the factorization property holds, without making use of the explicit form of , is to calculate the following quantity:
| (10) |
Here and are two arbitrary times in the –regime. It follows immediately that if Eq. (8) holds, is independent of , since it is just the system universal function . In Fig. 7 we show the time dependence of at K. The correlators used are for Si and O at Å-1, Å-1, Å-1, and Å-1, as well as the coherent functions for Si–Si, Na–Na, and O–O at the same values of . The times and from Eq. (10) are 2.9 ps and 10.3 ps, respectively. From the figure we recognize that in the –regime the for all these correlators collapse nicely onto a master function, which is the function . Hence we conclude that the factorization property predicted by MCT holds for the present system. Finally we mention that we find for higher temperatures the same type of collapse, but that the time window in which the master curve is observed shrinks rapidly, in qualitative agreement with the prediction of MCT.
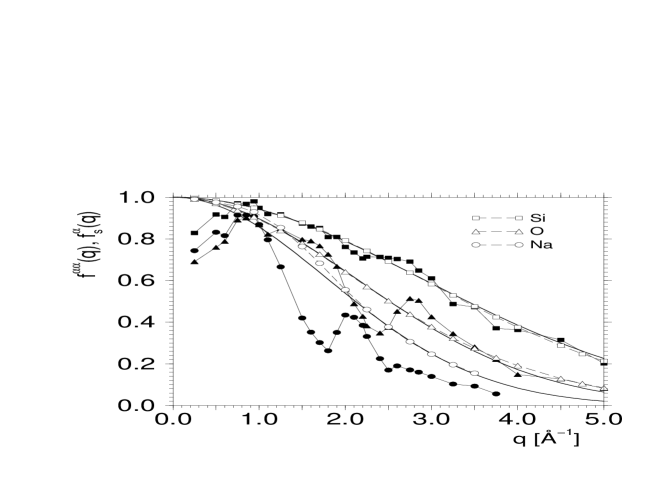
The last quantity we will discuss is from Eq. (8). Since is just the height of the plateau of the correlator at intermediate times, this parameter is often also called “non–ergodicity parameter” (NEP) since it reflects how much memory the system has of its state at . In the following we will focus on the wave–vector dependence of and , the NEP for the coherent and incoherent scattering functions. (Note that and are often also called the Debye–Waller factor and Lamb–Mössbauer–factor, respectively.) We have determined and by using Eq. (8) to fit the correlators. The –dependence of and for the case of silicon and oxygen are shown in Fig. 8. We see that in both cases (open symbols) decays quickly with increasing and that this dependence can be described very well by a Gaussian (bold solid lines). Such a behavior has already been found for the case of pure silica [66] and is in qualitative agreement with the prediction of MCT [5]. The width of these Gaussians are 4.1 Å-1 and 3.0 Å-1 for Si and O, respectively. This means that in the time scale of the –relaxation the particles are trapped in a cage with radius Å (Si) and 0.33 Å (O). For the case of pure SiO2 the corresponding values are 0.23 Å and 0.29 Å [66]. Hence we see that the presence of sodium slightly increases the size of the cage and that this increase is more pronounced for the case of oxygen than for silicon. This result is reasonable since some of the oxygen atoms are in the immediate vicinity of the sodium atoms but are bound to them less strongly than they are to the silicon atoms (and of course there is no Si–Na bond). In addition also the presence of dangling bonds (i.e. non–bridging oxygens) will lead to an increase of the size of the cage for oxygen.
The NEP for the coherent functions of Si and O oscillate around the ones for the incoherent functions. This oscillation is in phase with the corresponding structure factor, a behavior which is in qualitative agreement with the theoretical expectation [5]. In particular we see that the amplitude of this oscillation is smaller for the case of silicon than for oxygen, in agreement with the findings of pure SiO2 [30] or binary mixtures of particles [75]. This finding can be rationalized by the fact that in a binary system with strong asymmetry in the concentration the coherent correlation functions for the minority species are in general very similar to the incoherent functions.
Also included in the figure is as determined from the Na correlator. (Note that does not show a well defined plateau for Å-1 (see e.g. Fig. 2 in Ref. [39]). Hence a fit with the functional form given by Eq. (8) is rather difficult if is large and thus the height of the plateau cannot be determined with high accuracy. However, for Å-1 one does indeed find a well developed plateau and thus it is possible to determine with good accuracy.) From Fig. 8 we see that for Na decays significantly faster than the ones for Si and O. This can be interpreted by saying that the cage for the sodium atoms is wider than the one for Si and O. However, care must be taken in drawing this conclusion since, as just mentioned, at the temperatures investigated neither the intermediate scattering functions for intermediate and large nor the mean–squared displacement of the Na atoms show a well defined plateau at intermediate times. Hence one cannot really say that on this time scale the particles are caged and hence also the interpretation of as the Fourier–transform of the shape of the cage is not quite appropriate. What is remarkable with for Na is the fact that it is not possible to fit it well with a Gaussian. If one fits the data for Å-1 with such a functional form it is possible to obtain a very good fit (bold solid line). (The width of this Gaussian is 2.52 Å-1, which corresponds to a “cage” of size 0.39 Å.) However, this fit gives a very poor representation of the data for smaller wave–vectors. This result, which is in contrast to the findings for Si and O, shows that the dynamics of Na is indeed rather unusual. Roughly speaking one thus can say that for small length scales, i.e. large , the cage is relatively soft and therefore the decays quickly. However, on the length scales of the typical distances between the channels (small ) the “cage” is relatively rigid, since on this length scale, as we have mentioned before, the single particle dynamics of Na is not strongly coupled to relaxation processes in the matrix. But of course this is just a hand–waving explanation of the finding and it would be nice to find support for it by means of a more thorough theoretical calculation.
Also included in the figure is the NEP for the Na–Na correlation. Qualitatively this looks similar to the one for the Si–Si or O–O correlation and in particular it shows a pronounced peak at around 2.0 Å-1, which corresponds to the nearest neighbor distance between two Na atoms (= 3.3 Å) [66]. However, we notice an important difference in that this NEP does not oscillate around the NEP for the incoherent function but instead stays systematically below it. Also for this behavior we are not aware of any theoretical prediction or experimental result.
IV Summary
In this paper we have studied by means of molecular dynamics computer simulations the relaxation dynamics of a melt of Na2O–2SiO2, one of the prototypes of an ion–conducting glass former. In particular we investigated the temperature and wave–vector dependence of the coherent and incoherent scattering functions. Due to the very different time scale of the dynamics of Na from the one of the species forming the matrix, the –dependence of these correlators for the sodium atoms shows features that are neither found in simple liquids nor in network–forming liquids like pure silica, i.e. systems in which the dynamics of the individual species takes place on a comparable time scale. E.g. we find that the time and temperature dependence of the incoherent function for Na is very different from the one for the coherent function. This is related to the fact that in this system the sodium atoms have the tendency to populate a relatively small subregion of space, so–called channels, and that the dynamics of the atoms in these channels is relatively quick and occurs by (activated) single particle hops. In contrast to this the overall structure of the channel, and hence the coherent function for the Na atoms, relaxes only on the time scale of the –relaxation time of the Si–O matrix. The temperature dependence of the relaxation times for the matrix and show a strong deviation from an Arrhenius law in agreement with experimental findings for this system [79, 80]. In the past such deviations have been found for simple liquids [75, 81, 82, 83] and their existence has been rationalized by means of MCT. However, finding them in systems like silica [25, 26] or in the present sodium silicate system is rather surprising. In this paper we have shown that in the temperature regime where these deviations are seen many of the features of the relaxation dynamics can again be rationalized by means of MCT, thus showing that with respect to this there is no difference with the results found for the so–called fragile glass–formers. Hence we conclude that the main difference between strong and fragile glass–formers is that the presence of the hopping processes leads to a shrinking of the dynamical range in which the –dependence of the relaxation times follows the power–law predicted by MCT (as compared to the range found in fragile systems). Nevertheless, despite this reduced range, the time correlation functions still show a behavior that can be rationalized remarkably well by the theory.
Of course one has to wonder to what extent the results presented in this paper can be found also in real Na2O–2SiO2, or similar systems. Although it must be expected that the potential used is not sufficiently accurate to reproduce all the properties of the real material on a quantitative level, the surprisingly good agreement of the results of the present model with the neutron–scattering results of Meyer et al. [64] shows that the potential is quite realistic. Therefore it can be hoped that the results presented here will be found also in appropriate coherent and incoherent neutron–scattering experiments and we hope that the present work helps to motivate such experiments.
Acknowledgments: We thank A. Meyer for useful discussions. Part of this work was made possible by the DFG through SFB 262 and Schwerpunktsprogramm 1055. We thank the HLRZ Stuttgart for a generous grant of computer time on the CRAY T3E.
REFERENCES
- [1] K. L. Ngai (Ed.): Proceedings of the First International Meeting on Relaxations in Complex Systems, J. Non–Cryst. Solids 131–133 (1991).
- [2] K. L. Ngai (Ed.): Proceedings of the Second International Discussion Meeting on Relaxations in Complex Systems, J. Non–Cryst. Solids 172–174 (1994).
- [3] K. L. Ngai (Ed.): Proceedings of the Third International Discussion Meeting on Relaxations in Complex Systems, Non–Cryst. Solids 235–237 (1998).
- [4] K. L. Ngai (Ed.): Proceedings of the Fourth International Discussion Meeting on Relaxations in Complex Systems, Non–Cryst. Solids, in press (2002).
- [5] For reviews of the theory and tests of MCT see e.g. L. Sjögren and W. Götze, Rep. Prog. Phys. 55, 241 (1992); W. Götze, J. Phys.: Condens. Matter 11, A1 (1999).
- [6] S. Sastry, P. G. Debenedetti, and F. H. Stillinger, Nature 393, 554 (1998).
- [7] S. Sastry, Nature 409, 164 (2001).
- [8] P. G. Debenedetti and F. H. Stillinger, Nature 410, 259 (2001).
- [9] C. A. Angell, J. H. R. Clarke, and L. V. Woodcock, Adv. Chem. Phys. 48, 397 (1981).
- [10] J.–L. Barrat and M. L. Klein, Ann. Rev. Phys. Chem. 42, 23 (1991).
- [11] W. Kob, p. 1. in Vol. III Annual Reviews of Computational Physics, Ed. D. Stauffer, (World Scientific, Singapore, 1995).
- [12] P. H. Poole, P. F. McMillan, and G. H. Wolf, Reviews in Mineralogy 32, 563 (1995).
- [13] W. Kob, J. Phys.: Condens. Matter 11, R85 (1999).
- [14] J.–P. Hansen and I. R. McDonald, Theory of Simple Liquids (Academic, London, 1986).
- [15] J.–L. Barrat, W. Götze, and A. Latz, J. Phys.: Condens. Matter 1, 7163 (1989).
- [16] W. van Megen and S. M. Underwood, Phys. Rev. E 49, 4206 (1994).
- [17] M. Nauroth and W. Kob, Phys. Rev. E 55, 657 (1997).
- [18] L. Fabbian, A. Latz, R. Schilling, F. Sciortino, P. Tartaglia, and C. Theis, Phys. Rev. E 60, 5768 (1999).
- [19] C. Theis, F. Sciortino, A. Latz, R. Schilling, and P. Tartaglia, Phys. Rev. E 62, 2388 (2000).
- [20] C. Theis, F. Sciortino, A. Latz, R. Schilling, and P. Tartaglia, Phys. Rev. E 62, 1856 (2000)
- [21] A. Winkler, A. Latz, R. Schilling, and C. Theis, Phys. Rev. E 62, 8004 (2000).
- [22] C. A. Angell, in Relaxation in Complex Systems, Eds.: K. L. Ngai and G. B. Wright (US Dept. Commerce, Springfield, 1985).
- [23] K. Vollmayr, W. Kob, and K. Binder, Phys. Rev. B 54, 15808 (1996).
- [24] M. Hemmati and C. A. Angell, in Physics meets Geology, Eds.: H. Aoki and R. Hemley (Cambridge Univ. Press, Cambridge, 1998).
- [25] J. Horbach and W. Kob, Phys. Rev. B 60, 3169 (1999).
- [26] I. Saika–Voivod, P. H. Poole, and F. Sciortino, Nature 412, 514 (2001).
- [27] I. Saika–Voivod, F. Sciortino, and P. H. Poole, Phys. Rev. E 63, 011202 (2001).
- [28] I. Saika–Voivod, P. H. Poole, and F. Sciortino, unpublished results for BeF2.
- [29] F. Sciortino and W. Kob, Phys. Rev. Lett. 86, 648 (2001).
- [30] J. Horbach and W. Kob, Phys. Rev. E 64, 041503 (2001).
- [31] J. Wuttke, J. Hernandez, G. Li, G. Coddens, H. Z. Cummins, F. Fujara, W. Petry, and H. Sillescu, Phys. Rev. Lett. 72, 3052 (1994); J. Wuttke, W. Petry, G. Coddens, and F. Fujara, Phys. Rev. E 52, 4026 (1995).
- [32] T. Franosch, W. Götze, M. R. Mayr, and A. P. Singh, Phys. Rev. E 55, 3183 (1997).
- [33] A. K. Jonscher, Nature 267, 673 (1977).
- [34] M. D. Ingram, Phys. Chem. Glasses 28, 215 (1987).
- [35] J. C. Dyre, J. Non–Cryst. Solids 135, 219 (1991).
- [36] H. Kahnt, J. Non–Cryst. Solids 203, 225 (1996).
- [37] K. Funke and D. Wilmer, Mater. Res. Soc. Proc. 548, 403 (1999).
- [38] J. C. Dyre and T. B. Schroder, Rev. Mod. Phys. 72, 873 (2000.
- [39] J. Horbach, W. Kob, and K. Binder, Phys. Rev. Lett. 88, 125502 (2002).
- [40] T. F. Soules, J. Chem. Phys. 71, 4570 (1979); T. F. Soules and R. F. Busbey, J. Chem. Phys. 75, 969 (1980); T. F. Soules and R. F. Busbey, J. Chem. Phys. 78, 6307 (1983).
- [41] C. A. Angell, L. Böhm, P. A. Cheeseman, and S. Tamaddon, Solid State Ionics 5, 649 (1981).
- [42] C. A. Angell, P. A. Cheeseman, and S. Tamaddon, J. de Physique Colloque 43, C9 (1982).
- [43] M. D. Ingram, Phil. Mag. B 60, 729 (1989).
- [44] C. Huang and A. N. Cormack, J. Chem. Phys. 93, 8180 (1990).
- [45] B. Vessal, G. N. Greaves, P. T. Martin, A. V. Chadwick, R. Mole, and S. Houde–Walter, Nature 356, 504 (1992).
- [46] S. Balasubramanian and K. J. Rao, J. Phys. Chem. 98, 10871 (1994).
- [47] S. R. Elliott, Solid State Ionics 70/71, 27 (1994).
- [48] W. Smith, G. N. Greaves, and M. J. Gillan, J. Chem. Phys. 103, 3091 (1995).
- [49] S. Sen and J. F. Stebbins, Phys. Rev. B 55, 3512 (1997).
- [50] G. N. Greaves, Solid State Ionics 105, 243 (1998).
- [51] J. Habasaki, I. Okada, and Y. Hiwatari, J. Phys. Soc. Japan 67, 2012 (1998).
- [52] J. Oviedo and J. F. Sanz, Phys. Rev. B 58, 9047 (1998).
- [53] R. Richert and R. Böhmer, Phys. Rev. Lett. 83, 4337 (1999).
- [54] D. L. Sidebottom, Phys. Rev. Lett. 83, 983 (1999).
- [55] T. B. Schroder and J. C. Dyre, Phys. Rev. Lett. 84, 310 (2000).
- [56] P. Maass, M. Meyer, A. Bunde, and W. Dieterich, Phys. Rev. Lett. 77, 1528 (1996).
- [57] M. Porto, P. Maass, M. Meyer, A. Bunde, and W. Dieterich, Phys. Rev. B 61, 6057 (2000).
- [58] R. D. Banhatti and A. Heuer, Phys. Chem. Chem. Phys. 3, 5104 (2001).
- [59] A. Heuer, M. Kunow, M. Vogel, and R. D. Banhatti, Phys. Chem. Chem. Phys., in press, preprint cond-mat/0205547.
- [60] N. Zotov, J. Non–Cryst. Sol. 287, 231 (2001).
- [61] P. Jund, W. Kob, and R. Jullien, Phys. Rev. B 64, 134303 (2001).
- [62] X. Yuan and A. N. Cormack, J. Non–Cryst. Solids 283, 69 (2001).
- [63] E. Sunyer, P. Jund, and R. Jullien, Phys. Rev. B, in press.
- [64] A. Meyer, H. Schober, and D. B. Dingwell, Europhys. Lett., in press.
- [65] J. Horbach and W. Kob, Phil. Mag. B 79, 1981 (1999).
- [66] J. Horbach, W. Kob, and K. Binder, Chem. Geol. 174, 87 (2001).
- [67] G. J. Kramer, A. J. M. de Man, and R. A. van Santen, J. Am. Chem. Soc. 64, 6435 (1991).
- [68] S. Ispas, M. Benoit, P. Jund, and R. Jullien, Phys. Rev. B 64, 214206 (2001).
- [69] O. V. Mazurin, M. V. Streltsina, and T. P. Shvaiko–Shvaikovskaya, Handbook of Glass Data, Part A: Silica Glass and Binary Silicate Glasses (Elsevier, Amsterdam, 1983).
- [70] J. Horbach, W. Kob, K. Binder, and C. A. Angell, Phys. Rev. E 54, R5897 (1996).
- [71] J. Horbach, W. Kob, and K. Binder, Eur. Phys. J. B 19, 531 (2001).
- [72] Lovesey, Theory of Neutron Scattering from Condensed Matter I, (Clarendon, Oxford, 1986).
- [73] M. Misawa, D. L. Price, and K. Suzuki, J. Non–Cryst. Solids 37, 85 (1980).
- [74] F. Sciortino, P. Gallo, P. Tartaglia, and S. H. Chen, Phys. Rev. E 54, 6331 (1996); F. Sciortino, L. Fabbian, S. H. Chen, and P. Tartaglia, Phys. Rev. E 56, 5397 (1997).
- [75] W. Kob and H. C. Andersen, Phys. Rev. E 52, 4134 (1995).
- [76] S. P. Das and G. F. Mazenko Phys. Rev. A 34, 2265 (1986); W. Götze and L. Sjögren, Z. Phys. B 65, 415 (1987).
- [77] U. Bengtzelius, W. Götze, and A. Sjölander, J. Phys. C 17, 5915 (1984).
- [78] M. Fuchs, J. Non–Cryst. Solids 172–174, 241 (1994).
- [79] K.–U. Hess, D. B. Dingwell, and E. Rössler, Chem. Geol. 128, 155 (1996).
- [80] R. Knoche, D. B. Dingwell, F. A. Seifert, and S. L. Webb, Chem. Geol. 116, 1 (1994).
- [81] B. Bernu, Y. Hiwatari, and J.–P. Hansen, J. Phys. C 18, L371 (1985); B. Bernu, J.–P. Hansen, Y. Hiwatari, and G. Pastore, Phys. Rev. A 36, 4891 (1987); G. Pastore, B. Bernu, J.–P. Hansen, and Y. Hiwatari, Phys. Rev. A 38, 454 (1988); H. Miyagawa, Y. Hiwatari, B. Bernu, and J.–P. Hansen, J. Chem. Phys. 88, 3879 (1988); J.–N. Roux, J.–L. Barrat, and J.–P. Hansen, J. Phys.: Condens. Matter 1, 7171 (1989); J.–L. Barrat, J.–N. Roux, and J.–P. Hansen, Chem. Phys. 149, 197 (1990).
- [82] H. Miyagawa and Y. Hiwatari, Phys. Rev. A 40, 6007 (1989); H. Miyagawa and Y. Hiwatari, Phys. Rev. A 44, 8278 (1991); Y. Hiwatari, J. Matsui, K. Uehara, T. Muranaka, H. Miyagawa, M. Takasu, and T. Odagaki, Physica A 204, 306 (1994); J. Matsui, T. Odagaki, and Y. Hiwatari, Phys. Rev. Lett. 73, 2452 (1994).
- [83] W. Kob and H. C. Andersen, Phys. Rev. Lett. 73, 1376 (1994); Phys. Rev. E 51, 4626 (1995).