Influence of polymer excluded volume on the phase behavior of colloid–polymer mixtures
Abstract
We determine the depletion-induced phase-behavior of hard sphere colloids and interacting polymers by large-scale Monte Carlo simulations using very accurate coarse-graining techniques. A comparison with standard Asakura-Oosawa model theories and simulations shows that including excluded volume interactions between polymers leads to qualitative differences in the phase diagrams. These effects become increasingly important for larger relative polymer size. Our simulations results agree quantitatively with recent experiments.
pacs:
61.25.H,61.20.Gy,82.70DdAdding a sufficient amount of non-adsorbing polymer chains to a stable colloidal dispersion can cause a depletion-induced separation of the dispersion into colloid-rich and colloid-poor phases, a striking effect which has been extensively investigated experimentallyLiIn75 ; Cald93 ; Ilet95 ; Verh96 ; Bodn97 ; Verm98 ; Rent01 ; Rama02 and which has important industrialRuss89 and biologicalZimm93 implications. The entropy-driven depletion attraction between colloidal particles can be tuned by varying the polymer-to-colloid size ratio (where is the polymer radius of gyration and the radius of the spherical colloids) and the polymer concentration, thus providing a unique opportunity of generating rich phase behavior. A theoretical description of colloid-polymer mixtures is a challenging Statistical Mechanical problem because of the large length scale differences between the size of the colloids and the polymer segments. The simplest and most widely made assumption is to consider ideal (non-interacting) polymers obeying Gaussian or random walk statisticsdeGe79 . A further simplification is provided by the Asakura-Oosawa (AO) modelAsak58 whereby polymer coils are treated as mutually penetrable spheres, which are excluded from a sphere of radius around each colloid. Gast et al.Gast83 and Lekkerkerker et al.Lekk92 used this model to calculate the phase diagrams of colloid-polymer systems. Computer simulations of hard sphere (HS) colloids and ideal lattice polymersMeij94 yielded results in good agreement with predictions based on the simpler AO model. Thus the phase behavior of mixtures of HS colloids and ideal polymers is well understood, at least for size ratios . However, polymers rarely behave as ideal, except perhaps near the theta pointdeGe79 . The more general problem involving interacting polymer chains is much more difficult and over half a century of theoretical work has shown that excluded volume interactions between monomers lead to important qualitative and quantitative differences in the properties of polymer solutionsdeGe79 . This letter presents the first large scale systematic simulations of the phase behavior of mixtures of colloids and interacting polymers for three size ratios , and compares the calculated phase diagrams to recent experimental dataVerh96 ; Bodn97 ; Rent01 ; Rama02 .
Some earlier attempts to account for polymer interactions in colloid-polymer mixtures were based on a perturbation theory around -point conditionsWarr95 or on integral equationsFuch01 . In the present work the self-avoiding walk (SAW) model is adopted for the interacting polymers, which is known to be a very good representation of polymers in good solventdeGe79 . A full scale simulation of colloidal hard sphere particles and polymer chains, each made up of monomers or Kuhn segments would be a daunting task. However, large-scale simulations become feasible within a coarse-grained description of the polymers, whereby the latter are represented as single particles interacting via an effective pair potential between their centers of mass (CM). Such effective pair potentials can be calculated by a well controlled tracing out of the individual monomer degrees of freedom along the “polymer as soft colloids” approach we have recently put forwardLoui00 ; Bolh01 ; Bolh01a ; Bolh02 . This approach was shown to reproduce, within statistical simulation uncertainties, the correct equation of state of pure interacting polymer solutionsBolh01 ; Bolh02 , as well as the correct one-body free energy of inserting a single colloid into a polymer solution, and the related polymer surface tensionLoui02 . Compared to very time-consuming monomer-level simulations, the coarse-graining method moreover yields accurate depletion potentials between two platesBolh01 or between two colloidal spheresLoui02a for polymer volume fractions up to . The success with the two-colloid problem suggests that the coarse-graining procedure may be fruitfully extended to the full many-body problem of the phase behavior of polymer-colloid mixtures as long as is not much greater than (which marks the cross-over to the semi-dilute regime).
Firstly, as described in our previous publications, the effective potentials for the polymer-polymer interaction were obtained from simulations of a bulk system of self avoiding walks (SAW), at various concentrations. All simulations were for polymer chains of length segments, with the zero-concentration lattice units. This length is sufficient to show proper scaling behavior in the semidilute regime Bolh01 . The concentration-dependent effective interactions were obtained by inversion of the CM radial distribution function using the hypernetted chain (HNC) integral equationBolh01 , and were accurately parameterized by sums of Gaussians Bolh02 .
The concentration-dependent potentials for the colloid-polymer interaction at each and were obtained from simulations of a single hard sphere in a solution of SAW polymers. The CM concentration profile was inverted by using a two-component version of the HNC equation, and the resulting was fitted to an exponential form Bolh02 .
The direct colloid-colloid interaction was taken to be hard-sphere like. These three interparticle potentials are the basis of the coarse-graining scheme. Each polymer is now reduced to a single effective particle, opening the way to large-scale simulations of a binary mixture of polymers and colloids. It is important to note that in a system with a finite density of colloids, the polymer concentration parameter in the effective potentials and must be chosen to be that in a reservoir of a pure polymer system in osmotic equilibrium with the two-component system of interest. In other words, as discussed in detail by other authorsLekk92 ; Dijk98 ; Dzub01 , the effective interactions should be taken at the chemical potential of the polymers in an osmotic reservoir.
The Gibbs-Ensemble Monte Carlo (GEMC) techniquePana87 ; frenkelbook is naturally suited for studying fluid-fluid phase separation. The chemical potential was fixed by a standard grand canonical prescription Bolh94 and the number of colloidal particles were fixed at and for polymer-colloid size ratios of and respectively. The GEMC simulations yielded histograms for the polymer and colloid densities in both boxes. At chemical potentials above a critical value, the two boxes show different colloid densities, corresponding to phase separation.
Besides the fluid-fluid phase separation, colloid crystallization can also occur in colloid-polymer mixtures. At zero polymer concentration the fluid-solid coexistence occurs at colloid volume fractions of and , as expected for a pure HS system. The effect of the added polymer is initially to widen the coexistence curve. At very high polymer concentration, a dense colloidal crystal can be in equilibrium with a very dilute colloidal “gas” (see e.g. Ref.Loui01a ). Experiments and previous approximate theoretical work show that if the fluid-fluid critical point becomes metastable w.r.t. the crystallization phase-line. For this reason, it is important to also calculate the fluid-solid phase lines, which was done using Kofke’s Gibbs-Duhem integration technique Kofk93 ; frenkelbook . Starting with zero polymer activity at HS fluid-solid coexistence, we performed a series of ensemble simulations, integrating the Clausius-Clapeyron equation along the coexistence line, where and are the differences in number of polymers and in volume between the two phases respectively.
To compare with ideal polymer theories, full GEMC simulations were also performed for the AO penetrable sphere model of polymersAsak58 , with the same numbers of colloids and size-ratios as for the interacting polymer systems. These simulations should provide an accurate representation of a true ideal polymer systemMeij94 . For comparison, we also calculated the phase-diagrams within the free-volume theory of Lekkerkerker et al.Lekk92 .
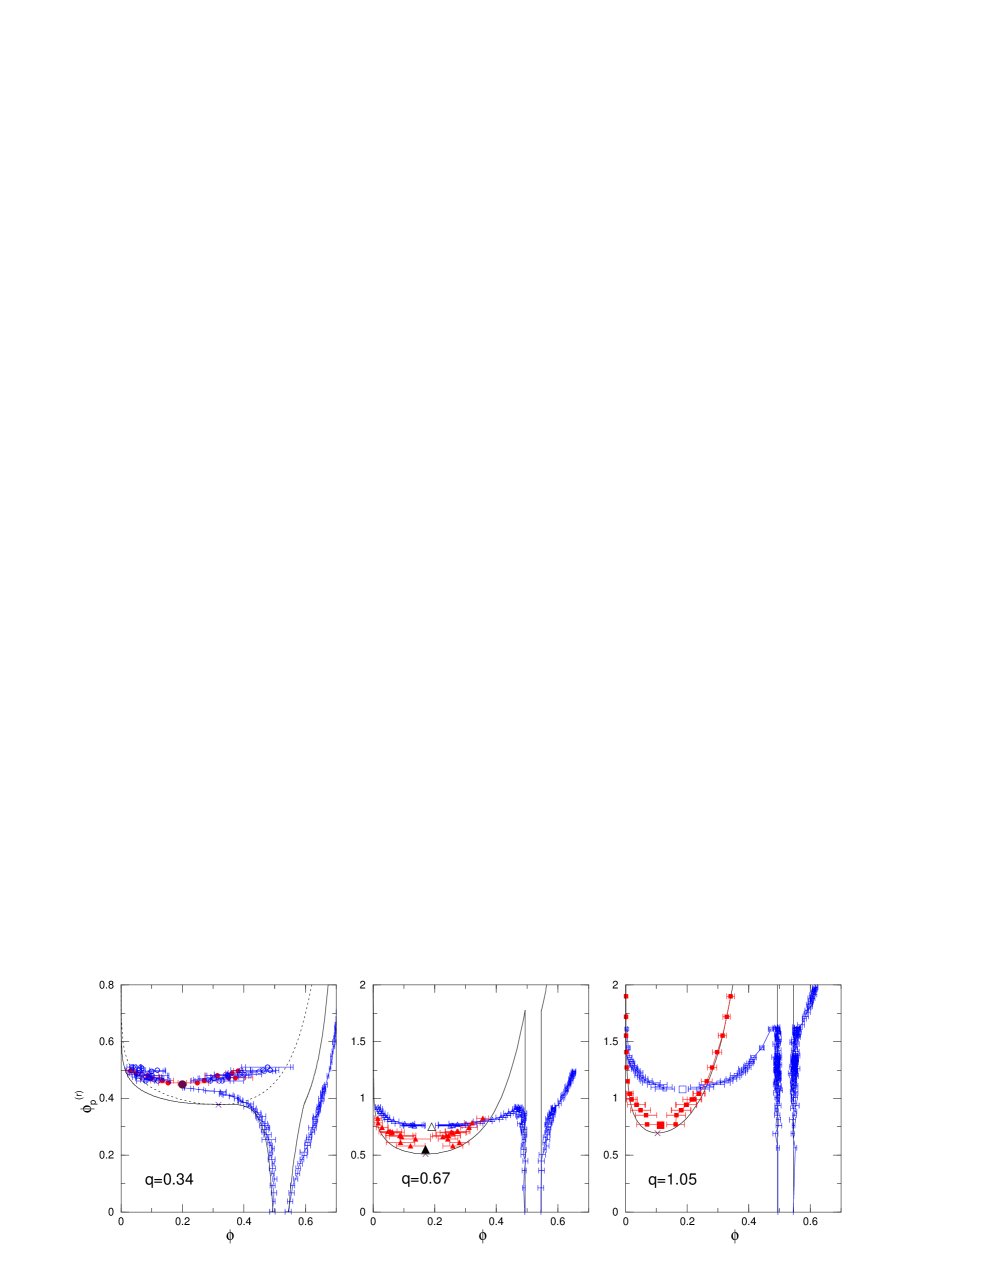
The complete phase diagrams for the ideal and interacting polymer models at all three size ratio’s are plotted in Fig. 1, in the polymer reservoir concentration-colloid volume fraction representation. Although the polymer chemical potential is the natural control variable in the simulations, the reservoir polymer concentration , directly obtainable from through the SAW equation of stateBolh01 ; Bolh02 , is a more suitable variable because this brings the interacting and non-interacting polymer phase-lines much closer to each other than a direct comparison of the chemical potentials would.
For the fluid-fluid binodal has just become metastable. This result is consistent with experimentsIlet95 , and close to the prediction of the AO model and other non-interacting polymer theoriesLekk92 ; Meij94 . The direct AO model simulations show a fairly good agreement with the interacting polymer simulations and are in good qualitative agreement with the free-volume perturbation theory, although the latter overestimates the critical colloid density. Although we did not explicitly calculate the triple point for the two-component AO system, it is expected to be fairly well located by the simpler free volume theory shown in the figureLekk92 ; Meij94 . For and larger differences are seen between the interacting polymers and the non-interacting AO model system. The triple point predicted by the latter moves to much higher polymer reservoir concentration than that found for interacting polymers. Whereas the critical point for interacting polymers stays near , the ideal polymer critical point moves to lower colloid densities, an effect that was predicted in the literatureSear01 . Finally we point out that since the polymer reservoir concentration stays well below the concentration , i.e. in the regime where we previously found good agreement for the two-body problem, we expect our coarse-graining model to provide a very accurate representation of the fully interacting polymer-colloid system. Should the critical polymer concentration continue to rise with increasing , then the coarse-graining method would become less trustworthy for large size ratios.
.
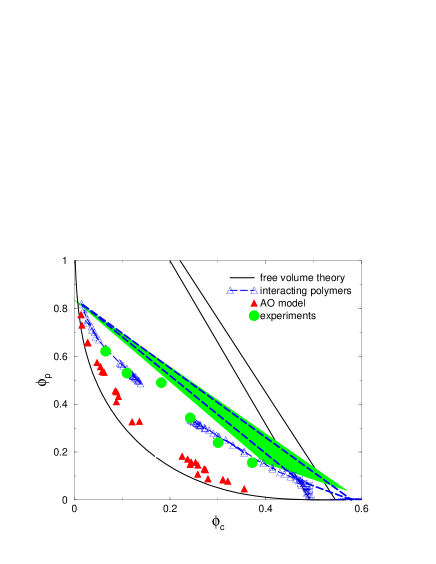
Experiments are usually done at fixed polymer concentration, so that the tie-lines are no longer horizontal. This representation is shown in Fig.2 for . Triple points turn into triangular areas in which three phases coexist. These have been measured experimentally using a mixture of PMMA-latex and polystyreneRent01 . We compare the experimental triple point results for to the theoretical diagram. Although the systems are not entirely equivalent, a much better agreement is found with the interacting polymer simulations than with the AO model estimates. The simulations also agree quantitatively with the fluid-fluid binodal which was accurately measured for in recent experiments on silica particles in tolueneRama02 . Similar quantitative agreement (not shown) was also found between the simulations and experimental binodalsRama02 .
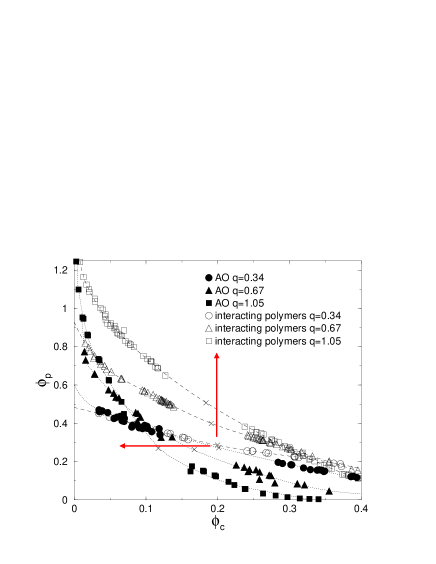
It is also instructive to compare the fluid-fluid binodals for different size-ratios, as done in Fig. 3. For small size ratio the AO and the interacting polymer estimates are close, as also seen in Fig. 1. This is not surprising, since we have shown previously that a cancellation of errors in the AO model leads to fairly good effective pair potentials for small and Loui02a . But the simulations for exhibit qualitatively different behavior: the critical colloid density of the AO model decreases whereas the polymer concentration does not change much. Including polymer interactions has the opposite effect: the critical polymer concentration increases and the colloid density hardly changes. Recent integral equation calculationsRama02 ; Fuch01 of the spinodal phase lines also show an increase in the polymer concentration with increasing .

The behavior of the critical point is summarized in Fig. 4, where the predicted trend for the critical colloid density is shown to agree very well with another set of experimentsVerh96 ; Bodn97 . We have recently performed direct simulations for much larger size ratios , and found that the colloid critical point is near the same density as found herelargepols . This suggests that even in the so called “protein limit”, , the colloid critical density is finite. The situation for the critical polymer volume fraction is less clear. The present simulations seem to agree fairly well with the experimental estimates from Ref. Ilet95 ; Rent01 although we should stress that the critical point was not determined accurately. Two other experimental results from Ref. Verh96 and Ref. Bodn97 based on mixtures of silica and PDMS polymer are also included. These studies determined the critical point accurately, and the colloid density agrees well with our simulations. However, the polymer concentrations are twice as large, which might be due to the highly polydisperse polymers used by these authors (, versus in Ref Rent01 ).
In summary, this letter presents the first large scale computer simulations of the full equilibrium phase-diagram of a binary mixture of colloids and interacting polymers. These simulations would not have been possible without using the accurate “polymers as soft colloids” coarse-graining approach. Even though the phase-separation happens mainly in the dilute regime of the polymer solution, we find important qualitative differences with ideal polymer behavior. In particular, the absolute polymer concentration at the critical point increases with increasing for interacting polymers, while it decreases with increasing for non-interacting polymers. Similarly, the critical colloid packing fraction remains nearly constant for interacting polymers, while it decreases with increasing for non-interacting polymers. We also showed that by including excluded volume interactions we find quantitative agreement with experiments. In conclusion then, just as excluded volume interactions are known to strongly influence the behavior of polymer solutions, we find here that polymer excluded volume interactions have important qualitative effects on the behavior of polymer-colloid mixtures.
AAL acknowledges support from the Isaac Newton Trust, Cambridge. We thank C.F. Zukoski and S. Ramakrishnan for sending a copy of their data.
References
- (1) F.K.R. Li-In-On, B. Vincent, and F. A. Waite, ACS Symp. Ser. 9, 165 (1975).
- (2) F.L. Calderon, J. Bibette, and J. Bais, Europhys. Lett. 23, 653 (1993).
- (3) S.M. Ilett, A. Orrock, W.C.K. Poon, and P.N. Pusey, Phys. Rev. E 51, 1344 (1995).
- (4) N.A.M. Verhaegh, J.S. van Duijneveldt, J.K.G. Dhont and H.N.W. Lekkerkerker, Physica A 230, 409 (1996)
- (5) I. Bodnar and W.D. Oosterbaan, J. Chem. Phys. 106, 7777 (1997).
- (6) R. Verma, J.C. Crocker, T.C. Lubensky, and A.G. Yodh, Phys. Rev. Lett. 81, 4004 (1998).
- (7) F.Renth, W.C.K. Poon, and R.M.L. Evans, Phys. Rev. E 64, 031402 (2001).
- (8) S. Ramakrishnan, M. Fuchs, K.S. Schweizer, and C.F. Zukoski, J. Chem. Phys. 116, 2201 (2002).
- (9) W.B. Russel, D.A. Saville, and W.R. Schowalter, Colloidal Dispersions (Cambridge University Press, Cambridge, 1989).
- (10) S.B. Zimmerman and A.P. Minton, Annu. Rev. Bioph. Biom. 22, 27 (1993).
- (11) P.G. de Gennes, Scaling Concepts in Polymer Physics (Cornell University Press, Ithaca NY, 1979).
- (12) S. Asakura and F. Oosawa, J. Polym. Sci., Polym. Symp. 33, 183 (1958), A. Vrij, Pure Appl. Chem. 48, 471 (1976).
- (13) A. P. Gast, C.K. Hall, and W.B. Russel, J. Colloid Interface Sci. 96, 251 (1983).
- (14) H.N.W. Lekkerkerker, W.C.K. Poon, P.N. Pusey, A. Stroobants, and P.B. Warren, Europhys. Lett. 20, 559 (1992).
- (15) E.J. Meijer and D. Frenkel, Phys. Rev. Lett. 67, 1110 (1991); J. Chem. Phys. 100, 6873 (1994).
- (16) P.B. Warren, S.M. Ilett, and W.C.K. Poon, Phys. Rev. E 52, 5205 (1995).
- (17) M. Fuchs and K.S. Schweizer, Phys. Rev. E 64, 021514 (2001); J. Phys. Condens. Matt. 14, R239 (2002).
- (18) A.A. Louis, P.G. Bolhuis, J.P. Hansen and E.J. Meijer, Phys. Rev. Lett. 85, 2522 (2000).
- (19) P.G. Bolhuis, A.A. Louis, J-P Hansen and E.J. Meijer, J. Chem. Phys. 114, 4296 (2001).
- (20) P.G. Bolhuis, A.A. Louis, and J-P Hansen, Phys. Rev. E 64, 0640118 (2001).
- (21) P.G. Bolhuis and A.A. Louis, Macromolecules, 35, 1860 (2002).
- (22) A.A. Louis, P.G. Bolhuis, E.J. Meijer, and J.P. Hansen, to appear in J. Chem. Phys. cond-mat/0111518 (2002).
- (23) A.A. Louis, P.G. Bolhuis, E.J. Meijer, and J.P. Hansen, to appear in J. Chem. Phys. cond-mat/0203144 (2002).
- (24) M. Dijkstra, R. van Roij, and R. Evans, Phys. Rev. E. 59, 5744 (1999).
- (25) J. Dzubiella et al. Phys. Rev. E 64, 010401(R) (2001).
- (26) D. Frenkel and B. Smit, Understanding molecular simulations, 2nd ed. (Academic Press, San Diego, 2002).
- (27) A.Z. Panagiotopoulos, Mol. Phys. 61, 813 (1987).
- (28) P.G. Bolhuis and D.Frenkel, J. Chem. Phys. 100, 9869 (1994).
- (29) A.A. Louis, Phil. Trans. Roy. Soc. A 359, 939 (2001).
- (30) D.A. Kofke, Mol. Phys. 78, 1331 (1993); D.A. Kofke, J.Chem. Phys. 98, 4149 (1993).
- (31) R.P. Sear, Phys. Rev. Lett 86, 4696 (2001).
- (32) E.J. Meijer, A.A. Louis and P.G. Bolhuis, to be published (2002).