Signatures of polaronic excitations in quasi-one-dimensional LaTiO3.41
Abstract
The optical properties of quasi-one-dimensional metallic LaTiO3.41 are studied for the polarization along the and axes. With decreasing temperature modes appear along both directions suggestive for a phase transition. The broadness of these modes along the conducting axis might be due to the coupling of the phonons to low-energy electronic excitations across an energy gap. We observe a pronounced midinfrared band with a temperature dependence consistent with (interacting) polaron models. The polaronic picture is corroborated by the presence of strong electron-phonon coupling and the temperature dependence of the dc conductivity.
pacs:
PACS numbers: 78.20.-e, 71.38.-kTitanium oxide compounds have been investigated extensively over the last decades, at the latest since the discovery of high- superconductivity in the cuprates, to study the role of electronic correlations and to explore the doping induced transition from a Mott insulator to a metal, like, e.g., in La1-ySryTiO3. [2, 3] Of further interest are the titanates because of the proposed polaronic nature of their charge carriers. For example, the existence of small polarons in La1-γTiO3±δ was shown by dc resistivity and thermoelectric power measurements.[3, 4] Signatures of polaronic carriers were also found in the optical response of TiO2, BaTiO3, and SrTiO3 in the form of a midinfrared (MIR) band.[5, 6, 7, 8, 9] Since a MIR band of (spin-) polaronic origin at 1000 cm-1 was also found in several cuprates [10, 11, 12, 13] it seems to be a characteristic feature of this class of compounds for low doping as well. The proposal that (bi)polarons might play a major role for the high- superconductivity[14] stimulated a vast amount of experimental investigations on this issue.
On the other hand, the nature of the polaronic carriers in the titanates is still under discussion. In this paper we present the optical properties of another titanium oxide compound, LaTiO3.41, to search for polaronic signatures and test their compatibility with the existing models. Indeed, we find a strong MIR band in the optical response showing a strong temperature dependence. A particular property of LaTiO3.41 is its quasi-one-dimensional (quasi-1D) metallic character which was recently found by resistivity measurements. [15] It is interesting to note that a MIR band was also observed for a variety of organic and anorganic quasi-1D metals, like TTF-TCNQ,[16] the Bechgaard salts,[17] -Na0.33V2O5,[18] and SrNbO3.41.[19] Whether this band is related to the 1D transport and, in particular, is of (vibrational or spin-) polaronic origin, are open questions which we want to address here.
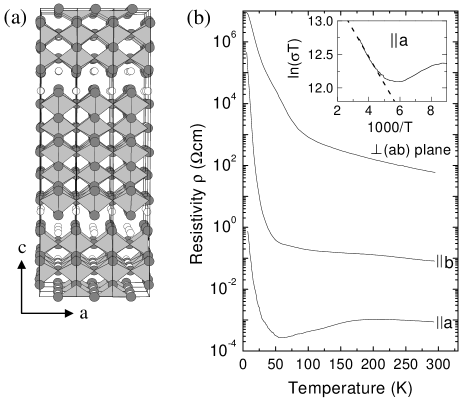
Single crystals of LaTiO3.41 were grown by a floating zone melting process;[15] the oxygen content was determined by thermogravimetry. The layered crystal structure [see Fig. 1(a)] is built from slabs of distorted TiO6 octahedra parallel to the (,) plane; it is monoclinic with lattice constants =7.86 Å, =5.53 Å, =31.48 Å, and =97.1∘. Like for the closely related compound SrNbO3.41 a characteristic property of the structure are the 1D chains of octahedra along the axis.[15] LaTiO3.41 belongs to the homologous series LanTinO3n+2 which exhibits a very rich phase diagram:[15] stoichiometric LaTiO3.00 (=, Ti ) is an antiferromagnetic Mott insulator, while for off-stoichiometric La1-γTiO3±δ metallic character of polaronic type was observed;[3, 4] LaTiOx for 3.003.50 is conducting,[15] and in particular LaTiO3.41 (Ti ) shows a quasi-1D metallic behavior;[15] LaTiO3.50 (=4, Ti ) is a ferroelectric band insulator.[20] The dc resistivity as a function of temperature depicted in Fig. 1(b) demonstrates the strongly anisotropic character of LaTiO3.41. Along the direction and perpendicular to the (,) plane the compound shows a semiconducting behavior, whereas along the direction the dependence is more complicated: Below 60 K rises steeply with decreasing , between 60 and 200 K its dependence is metallike, and above 200 K slightly decreases with increasing . This temperature dependence will be discussed in more detail later.
Near-normal incidence reflectivity spectra were measured from 40 to 6000 cm-1 (5 meV-0.74 eV) utilizing a Fourier-transform spectrometer equipped with an ultra-
stable optical cryostat. To obtain absolute reflectivities the spectra were divided by the reflectivity spectra of a gold film recorded at the same set of temperatures, where the film was deposited in situ on the sample. Since no temperature dependence was found above 6000 cm-1, the spectra were extended to 36 000 cm-1 by the room-temperature (RT) reflectivity data recorded with a variable angle spectroscopic ellipsometer. Each reflectivity spectrum was extrapolated to low and high frequencies according to a Drude-Lorentz fit; from the subsequent Kramers-Kronig transformation the phase of the reflection coefficient and thus the complex dielectric function could be obtained.
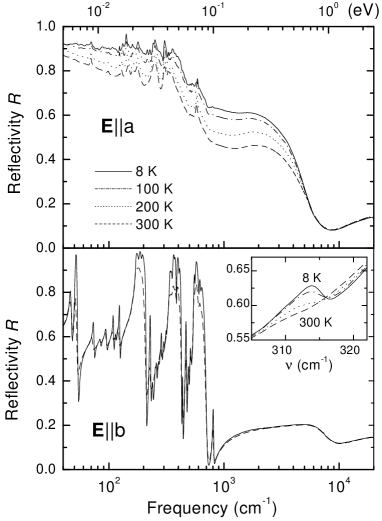
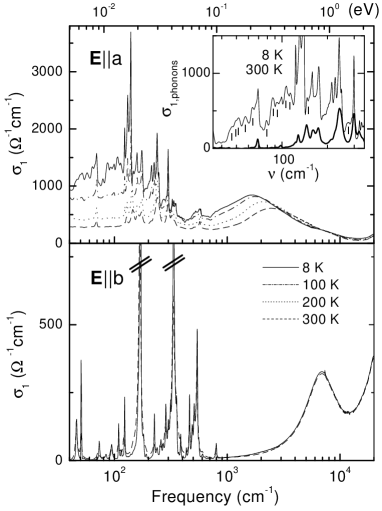
The polarization-dependent reflectivity spectra of LaTiO3.41 for several temperatures are shown in Fig. 2. They clearly demonstrate its quasi-1D metallic character: For the polarization E, i.e., along the chains, we find a metallic behavior with a high reflectivity at low frequencies and a sharp plasma edge (3600 cm-1), while the overall low reflectivity for E indicates an insulating character. The optical conductivity is presented in Fig. 3. For E no electronic absorption is observed in the far infrared (FIR); the spectrum below 1000 cm-1 consists of a large number of phonon lines, and the onset of interband transitions is found above 1000 cm-1. Along the chains consists of a Drude peak superimposed by vibrational lines and a pronounced MIR band.[21] With decreasing temperature we observe two major changes in the E conductivity: (i) in the FIR region, between 50 and 300 cm-1, modes (indicated by ticks in the inset of Fig. 3) possibly of vibrational origin appear below 100 K which are broader than the others, and (ii) the MIR band, located around 2500 cm-1 at RT, continuously shifts to lower frequencies and its intensity increases; besides, an additional feature appears around 940 cm-1. The changes are illustrated by the normalized difference,
| (1) |
shown in Fig. 4. In the FIR, below 150 cm-1, for 100 K has slope zero and it increases with decreasing due to the increase of ; but below 100 K the slope clearly changes and in particular for 45–100 cm-1 increases strongly, indicating additional excitations in this frequency range.
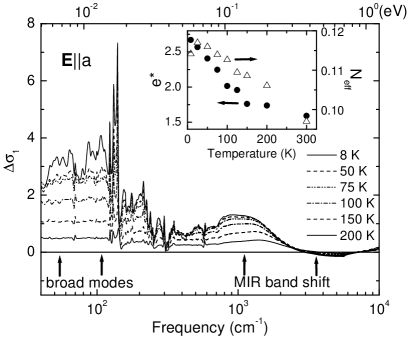
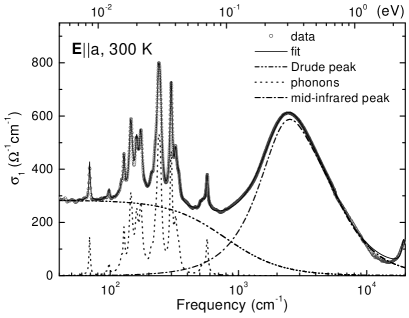
To quantify these changes we fitted the E conductivity spectra with the Drude-Lorentz model. The MIR band was modelled by two Lorentzian functions. As an example we show the fit for the RT spectrum in Fig. 5. This way we were able to extract the various contributions (Drude peak, “phonon” modes, MIR band) for each temperature. From the spectral weights we calculated the effective number of carriers (per Ti atom) for each contribution according to , where is the free electron mass, and the unit cell volume (containing 20 formula units). The upper integration limit was set to 15000 cm-1, where the onset of the interband transitions is located. As is shown in the inset of Fig. 4, the effective carrier number of the MIR absorption increases as the temperature decreases, but below 75 K a saturation sets in. From the integrated intensities of the phonon modes and by using the ionic charges of the atoms we calculated the effective charge according to the sum rule.[22] The temperature dependence of (inset of Fig. 4) illustrates the substantial spectral weight growth of the modes with decreasing temperature.
We now want to discuss the observed changes in the optical conductivity in more detail. (i) The appearance of vibrational modes in general suggests a breaking of the crystal symmetry. Some of the new modes for E are already very weakly present in the 125-K spectrum, but the substantial growth of their spectral weight sets in below 100 K. The occurrence of a phase transition in LaTiO3.41 is corroborated by the development of ten phonon lines for E with decreasing temperature (an example is shown in the inset of Fig. 2). A remarkable finding is the broadness of the new lines along the conducting axis (see inset of Fig. 3) which might be due to the coupling of the phonons to electronic excitations. These low-energy excitations might be excitations across an energy gap at which develops below 100 K due to the phase transition. A coupling of the phonons to these excitations could also explain their significant spectral weight growth below this temperature. Since the broad modes appear at frequencies above 50 cm-1, one could estimate the size of the gap to 6 meV. The appearance of strong modes along the metallic axis caused by a coupling of phonon bands to the electronic density was in fact predicted by Rice [23] when considering organic linear-chain conductors which undergo a charge-density wave transition. For LaTiO3.41 the presence of strong electron-phonon coupling is indicated by the enhanced effective charge =1.6 at RT (see inset of Fig. 4) compared to the value =1 if there is no coupling. In general, the interaction between a discrete level and a continuum of states gives rise to asymmetric peaks in the excitation spectra.[24] Unfortunately, the large electronic background (Drude contribution) and the strong overlap of the modes render a line-shape analysis and thus a proof of the asymmetry of the new modes in LaTiO3.41 difficult.
Within this scenario two open questions remain, however: First, the dc resisitivity of LaTiO3.41 shows no anomaly and thus no clear signature of a phase transition over the whole measured temperature range; a possible explanation could be the small number of carriers involved. Second, there is no direct evidence in the optical conductivity spectrum for excitations across an energy gap. Based on the present experimental results the occurrence of a phase transition therefore remains speculative. Additional experimental investigations, for instance x-ray diffraction or neutron-scattering measurements at low temperature, would be needed to clarify this issue.
(ii) The strong temperature dependence of the MIR band, namely its shift to lower frequencies and intensity increase for decreasing with a saturation at a specific temperature, renders an interpretation of the band in terms of interband transitions unlikely. The observed evolution with temperature is similar to that of the MIR absorption in the cuprate superconductors which was attributed to polaronic excitations.[11, 12] The formation of polarons in LaTiO3.41 is corroborated by the presence of strong electron-phonon coupling indicated by the enhanced effective charge . A temperature-dependent MIR band was also found for the nickelates La2-xSrxNiO4+δ, where it was explained by photon-assisted hopping of small polarons:[25, 26] photons in the MIR range excite self-trapped carriers from a localized state to localized states at neighboring sites, and the absorption is peaked at an energy twice the polaron binding energy .[27] The position of the MIR band thus provides an estimate of , which yields 155 meV for LaTiO3.41 at RT. A conduction mechanism due to the hopping of small polarons, as suggested by the existence of a temperature-dependent MIR band, is corroborated by the dependence of (see Fig. 1): Starting from the lowest temperature, the steep drop of denotes the thermal activation of charge carriers. At 60 K the carriers are free and with further temperature increase rises since the carriers are increasingly scattered by phonons; metallic transport is observed. The decrease of above 200 K indicates that the contribution due to hopping of polaronic carriers prevails. For the dc conductivity due to small polaron hopping one expects the thermally activated form [28]
| (2) |
where is the hopping energy; the disorder energy is omitted since it is negligibly small compared to in crystalline bulk materials. In the range 200-300 K can be fitted according to Eq. (2) (see inset of Fig. 1) which yields 35 meV. This thermal activation energy is a factor of 2.2 smaller than the activation energy =78 meV,[28] obtained from our optical data; such a discrepancy between the thermal and optical activation energies is expected since in the thermally activated process the lattice has time to relax and is thus reduced.
On the other hand, the temperature dependence of the MIR band in LaTiO3.41 – the softening with decreasing temperature – is not compatible with a noncorrelated small polaron model for strong electron-phonon coupling.[5, 25, 29] In the case of the high- cuprate superconductors the MIR band softening was interpreted in terms of large polaron models including polaron-polaron interactions.[12, 30, 31, 32] A different approach was recently used by Fratini et al.[33] who considered small polaron absorption for intermediate electron-phonon coupling: Their calculated optical conductivity exhibits a noticeable transfer of spectral weight from high to low frequencies with decreasing temperature, like we observe in LaTiO3.41. Besides, the calculated spectra show anomalous peaks at frequencies comparable to the phonon frequencies with a strongly temperature-dependent intensity. These peaks, denoted as “polaron interband transitions”, are purely electronic in nature and due to transitions between different subbands in the polaron excitation spectrum. They might serve as an alternative explanation for the broad peaks found in LaTiO3.41 along the conducting direction.
Whether one of these polaron models actually applies to LaTiO3.41, may be judged from a detailed comparison of the observed features (MIR absorption features, broad modes) to the theoretical absorption spectra, thereby considering that not only vibrational but also spin degrees of freedom could be involved in the polaron formation, as it was proposed for other materials with strong electronic correlations like the cuprates [13] or the manganites.[34] The clarification of these issues is of general importance, since a band in the MIR frequency range is a characteristic feature in the optical spectrum of quasi-1D conductors.[35] According to the present results for LaTiO3.41 the MIR band contains important information on the transport mechanism in quasi-1D systems and the careful study of its temperature and doping dependence is therefore worthwhile.
In summary, we studied the polarization dependent optical response of quasi-1D metallic LaTiO3.41 as a function of temperature. With decreasing temperature modes appear along both studied crystal axes suggestive for a phase transition. The new modes found along the conducting direction below 100 K are broader than the other modes, which might be caused by the coupling of the phonons to low-energy electronic excitations across an energy gap. The E conductivity spectrum contains a pronounced MIR band whose temperature dependence is similar to that of the MIR absorption in the cuprate superconductors and consistent with (interacting) polaron models. The polaron formation in LaTiO3.41 is corroborated by the presence of strong electron-phonon coupling and the temperature dependence of the dc conductivity. The findings for LaTiO3.41 suggest the general importance of polaronic quasiparticles for the transport mechanism in quasi-1D conductors.
ACKNOWLEDGEMENTS
We thank P. Haas for providing additional data. This work was supported by the BMBF (project No. 13N6918/1), and the Deutsche Forschungsgemeinschaft.
REFERENCES
- [1] [∗] Electronic address: kuntscher@pi1.physik.uni-stuttgart.de
- [2] A. Fujimori, I. Hase, M. Nakamura, H. Namatame, Y. Fujishima, Y. Tokura, M. Abbate, F. M. F. de Groot, M. T. Czyzyk, J. C. Fuggle, O. Strebel, F. Lopez, M. Domke, and G. Kaindl, Phys. Rev. B 46, 9841 (1992); N. Shanthi and D. D. Sarma, ibid. 57, 2153 (1998); M. Imada, A. Fujimori, and Y. Tokura, Rev. Mod. Phys. 70, 1039 (1998).
- [3] C. C. Hays, J.-S. Zhou, J. T. Markert, and J. B. Goodenough, Phys. Rev. B 60, 10 367 (1999).
- [4] W. H. Jung, H. Wakai, H. Nakatsugawa, and E. Iguchi, J. Appl. Phys. 88, 2560 (2000); S. Gariglio, J. W. Seo, J. Fompeyrine, J.-P. Locquet, and J.-M. Triscone, Phys. Rev. B 63, 161103 (2001).
- [5] V. N. Bogomolov and D. N. Mirlin, Phys. Status Solidi 27, 443 (1968); V. N. Bogomolov, E. K. Kudinov, D. N. Mirlin, and Ju. A. Firsov, Fiz. Tverd. Tela 9, 2077 (1967) [Sov. Phys. Solid State 9, 1630 (1968)].
- [6] P. Gerthsen, R. Groth, K. H. Hardtl, D. Heese, and H. G. Reik, Solid State Commun. 3, 165 (1965).
- [7] D. M. Eagles and P. Lalousis, J. Phys. C 17, 655 (1984).
- [8] P. Calvani, M. Capizzi, F. Donato, S. Lupi, P. Maselli, and D. Peschiaroli, Phys. Rev. B 47, 8917 (1993).
- [9] V. V. Kabanov and D. K. Ray, Phys. Rev. B 52, 13 021 (1995).
- [10] G. A. Thomas, D. H. Rapkine, S. L. Cooper, S.-W. Cheong, A. S. Cooper, L. F. Schneemeyer, and J. V. Waszczak, Phys. Rev. B 45, 2474 (1992).
- [11] P. Calvani, M. Capizzi, S. Lupi, P. Maselli, A. Paolone, and P. Roy, Phys. Rev. B 53, 2756 (1996).
- [12] S. Lupi, P. Maselli, M. Capizzi, P. Calvani, P. Giura, and P. Roy, Phys. Rev. Lett. 83, 4852 (1999).
- [13] M. Grüninger, D. van der Marel, A. Damascelli, A. Zibold, H. P. Geserich, A. Erb, M. Kläser, Th. Wolf, T. Nunner, and T. Kopp, Physica C 317-318, 286 (1999); M. Grüninger, Ph.D. thesis, University of Groningen, 1999.
- [14] D. Emin, Phys. Rev. Lett. 72, 1052 (1994); S. Robaszkiewicz, R. Micnas, and J. Ranninger, Phys. Rev. B 36, 180 (1987).
- [15] F. Lichtenberg, A. Herrnberger, K. Wiedenmann, and J. Mannhart, Prog. Solid State Chem. 29, 1 (2001).
- [16] H. Hinkelmann and H. G. Reik, Solid State Commun. 16, 567 (1975); H. Basista, D. A. Bonn, T. Timusk, J. Voit, D. Jérome, and K. Bechgaard, Phys. Rev. B 42, 4088 (1990).
- [17] C. S. Jacobsen, D. B. Tanner, and K. Bechgaard, Phys. Rev. B 28, 7019 (1983).
- [18] C. Presura, M. Popinciuc, P. H. M. van Loosdrecht, D. van der Marel, M. Mostovoy, G. Maris, T. T. M. Palstra, H. Yamada, and Y. Ueda, cond-mat/0211653, unpublished.
- [19] C. A. Kuntscher, S. Schuppler, P. Haas, B. Gorshunov, M. Dressel, M. Grioni, F. Lichtenberg, A. Herrnberger, F. Mayr, and J. Mannhart, Phys. Rev. Lett. 89, 236403 (2002).
- [20] S. Nanamatsu, M. Kimura, K. Doi, S. Matsushita, and N. Yamada, Ferroelectrics 8, 511 (1974).
- [21] The discrepancy between the dc conductivity and the low-frequency limit of the optical conductivity along the chain direction , most obvious below 50 K, are probably due to the low-frequency extrapolations used for the Kramers-Kronig analysis, which are based on the Drude-Lorentz fits of the reflectivity spectra in the range 40-36 000 cm-1.
- [22] M. Dressel and G. Grüner, Electrodynamics of Solids (Cambridge University Press, Cambridge, England, 2002).
- [23] M. J. Rice, Phys. Rev. Lett. 37, 36 (1976).
- [24] U. Fano, Phys. Rev. 124, 1866 (1961).
- [25] P. Calvani, A. Paolone, P. Dore, S. Lupi, P. Maselli, and P. G. Medaglia, Phys. Rev. B 54, 9592 (1996).
- [26] X.-X. Bi and P. C. Eklund, Phys. Rev. Lett. 70, 2625 (1993); X.-X. Bi, P. C. Eklund, and J. M. Honig, Phys. Rev. B 48, 3470 (1993).
- [27] D. Emin, Phys. Rev. B 48, 13 691 (1993).
- [28] N. F. Mott and E. A. Davis, Electronic Processes in Non-crystalline Materials (Clarendon Press, Oxford, 1971).
- [29] D. A. Crandles, T. Timusk, J. D. Garret, and J. E. Greedan, Physica C 216, 94 (1993).
- [30] S. Fratini and P. Quémerais, Mod. Phys. Lett. B 12, 1003 (1998).
- [31] V. Cataudella, G. De Filippis, and G. Iadonisi, Eur. Phys. J. B 12, 17 (1999).
- [32] J. Tempere and J. T. Devreese, Phys. Rev. B 64, 10 4504 (2001).
- [33] S. Fratini, F. de Pasquale, and S. Ciuchi, Phys. Rev. B 63, 153101 (2001).
- [34] A. J. Millis, R. Mueller, and B. I. Shraiman, Phys. Rev. B 54, 5405 (1996); Y. Okimoto, T. Katsufuji, T. Ishikawa, T. Arima, and Y. Tokura, ibid. 55, 4206 (1997); A. V. Boris, N. N., Kovaleva, A. V. Bazhenov, P. J. M. van Bentum, Th. Rasing, S-W. Cheong, A. V. Samoilov, and N.-C. Yeh, ibid. 59, 687 (1999).
- [35] H. Tajima, Solid State Commun. 113, 279 (2000).