Does a surface attached globule phase exist ?
Abstract
A long flexible neutral polymer chain immersed in a poor solvent and interacting with an impenetrable attractive surface exhibits a phase known as surface attached globule (SAG) in addition to other adsorbed and desorbed phases. In the thermodynamic limit, the SAG phase has the same free energy per monomer as the globular phase, and the transition between them is a surface transition. We have investigated the phase diagrams of such a chain in both two- and three- dimensions and calculated the distribution of monomers in different domains of the phase diagram.
keywords:
Surface attached globule(SAG) phase; Exact enumeration.PACS:
64.60.-i,68.35.Rh,5.50.+qA long flexible neutral polymer chain immersed in a poor solvent and interacting with an impenetrable surface is known to exhibit a very rich phase diagram [1]. Competition between the lower internal energy near an attractive wall and higher entropy away from it results in a transition, where for a strongly attractive surface the polymer sticks to the surface and for weak attraction the polymer chain remains desorbed. On the other hand, due to the self-attraction in the polymers the possibility of a collapse transition both in the desorbed and adsorbed states occur. The phase diagram is generally plotted in variables and where is the inverse temperature, is the (attractive) energy associated with each monomer lying on the surface and represents an attractive interaction energy between pairs of monomer which come close to each other and are separated along the chain by more than one unit. The short range repulsion between the monomer is taken in a lattice model by self-avoidance [2]. Considerable attention has been paid to find the full phase diagram of such a chain in both two dimensions () and three dimensions ().
In one of the earliest papers on the subject, Bouchaud and Vannimenus [3] derived the exact phase diagram on a -Sierpinski gasket. The phase diagram consisted of the adsorbed expanded (AE), desorbed expanded (DE) and desorbed collapsed (DC) phases. Kumar and Singh [4] have reinvestigated the phase diagram for -Sierpinski gasket and showed that for a certain range of surface interactions, an additional phase having the feature of globule attached to the surface exists. Recently Singh et.al. [5, 6] using extrapolation of exact series expansions calculated the phase diagram for the polymer chain in both and (Euclidean) space. These phase diagrams show the existence of the surface attached globule (SAG) phase in qualitative agreement with the one found earlier for the gasket. It is important to note that in the thermodynamic limit, the SAG phase has the same free energy per monomer as the DC phase, and the transition between them is a surface transition.

As shown earlier [1], it is easy to understand the SAG and its boundary in the limit . At , the polymer configurations may be mapped by Hamiltonian walk as shown in Fig 1(a). Its bulk energy is the same as in the DC phase and the surface energy is . Minimizing the surface energy with respect to , we obtain
| (1) |
While for the DC phase,
| (2) |
In the AC phase, we have , , and the free energy at is
| (3) |
Comparing the energies of these phases, we see that SAG phase has lower free energy than the DC or the AC phases for . Thus the lower and upper boundaries of the SAG phase (lines and in Fig.2) tend to and for large .
In the case of partially directed polymer in we have found [1] exact phase diagram of the SAG phase. In this case the polymer has different behaviour depending on whether it is near the wall perpendicular to the preferred direction (SAG1) or the wall is parallel to the preferred direction (SAG2). The phase boundaries of SAG1 and SAG2 have been found by calculating this orientation dependent surface energy.
Since the analytical approach are limited to very few cases such as fractal lattices or the directed walks on lattices, we have to resort to numerical methods to calculate the phase diagram in other cases. A lattice model using extrapolation of exact series expansions (herein after referred to exact enumeration method) has been found to give satisfactory results as it takes into account the corrections to scaling. To achieve the same accuracy by the Monte Carlo method, a chain of about two order magnitude larger than in the exact enumeration method has to be considered [7].
In this article we report our results which we have found using exact enumeration method both for and cases. Let be the number of SAWs of sites having monomers on the surface and nearest neighbour monomer pairs. We analyzed the series for up to for square lattice and for the cubic lattice; thus extending the series by two more terms in both cases.
To obtain better estimates of critical points as well as the phase boundaries, we extrapolate for large using ratio method [8]. Let
| (4) |
be the partition function. Then, the reduced free energy per monomer can be written as [8]
| (5) |
The phase boundaries are then found from the maxima of () and ().

The phase diagram thus obtained is shown in Fig.2(a) for three dimensions. It has five phases which are denoted as desorbed expanded (DE), desorbed collapsed (DC), adsorbed expanded (AE), adsorbed collapsed (AC) and surface attached globule (SAG). Since in case of two dimensions, surface is a line, therefore, we do not find adsorbed collapsed phase [Fig2(b)]. The value of at is found to be and for and , respectively. The value of at is found to be and for and , respectively. The special adsorption line separates the AE phase from that of DE phase. The line meets line which is a multi-critical point ( for and (1.76, 1.38) for , respectively. Values of are same as those reported by us earlier [1]. The value of critical exponents both at the ordinary and multi-critical points are in very good agreement with the known results [9-10].
In order to show how the monomers distribute when the chain is in the different regimes of the phase diagram, we calculate the value of each term in Eq.(4) for given values of and and plot the results for walk up to 20 steps (3D case only) in Fig.(3-6). Here we have plotted for eight values of , where ( being the maximum value of ) as a function of and . Since the term which contribute most to the sum of Eq.(4) represents the most probable configurations of the chains, we can infer, from these figures about the manner in which the monomers are distributed in different states. For example, Fig.(3(a-d) and 4(a-d)) show how the distribution of monomers changes as is varied at fixed and (corresponding to expanded state). It is clear from these figures (3(a) and 4(a)) that and are nearly zero around . In Fig.(3(d)-4(d)), at , is around 20 corresponding to the adsorbed expanded state of chain. For and (correspoding to the collapsed state), distribution is shown in Fig.(5(a-d) and 6(a-d). For , the polymer chain is in the bulk as there is any monomer on the surface () but is large which indicate that monomers occupy the neighbouring sites. When is chosen equal to 2.0 a value which lies in between and line, as shown in Fig.2, a fraction of monomers gets attached to the surface () indicating the breaking of translational invariance of the globule corresponding to the SAG phase. With further increase in polymer gets adsorbed in collapsed state where and is around 8.


.

.
We also calculate number of neighbouring pairs of monomers at the surface i.e. . This can be calculated from the expression
| (6) |
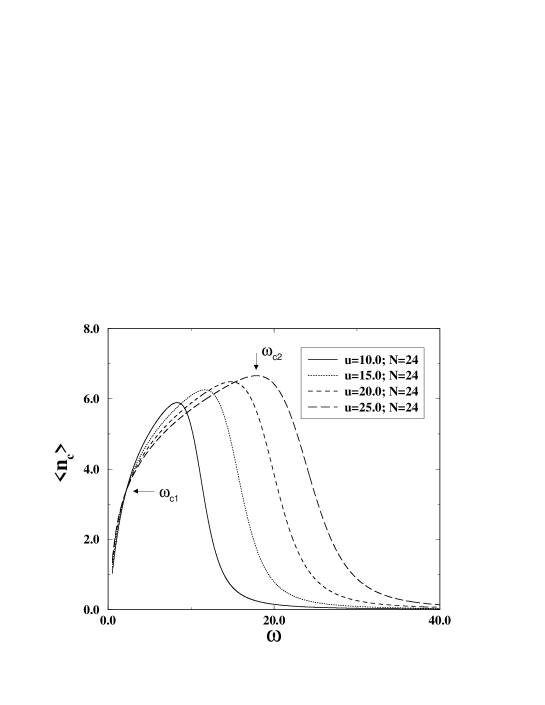
The variation of with for different value of is shown in Fig.7 for two dimensions. At such a high value of the most likely structure is of Hamiltonian walk as shown in Fig.1(a). Below certain value of , this structure remains in bulk and and are almost zero. At certain critical value , this structure gets stuck on the surface (Fig.1(b)). At this value of , the is equal to and goes as . As increases also increases and reaches to its maximum at . The corresponding configuration is shown in Fig.1(d). With further increase in , polymer gets adsorbed on the surface with decrease in as shown in Fig.7 and Fig.1(e).
The results given above should provide ample evidences in favour of the existence of the SAG phase. The phase boundaries and tend to 1 and respectively as goes to zero and is independent of dimension. We once again emphasized that the transition associated with line is surface transition.
We thank Deepak Dhar and R. Rajesh for many helpful discussions. We would also like to thank the organizers for giving us opportunity to present this work. Financial assistance from , New Delhi and DST, New Delhi are acknowledged.
References
- [1] R. Rajesh, D. Dhar, D. Giri, S.Kumar and Y.Singh, Phy.Rev. E(2002)
- [2] P. G. de Gennes, Scaling Concepts in Polymer Physics (Cornell Univ. Press, Ithaca, 1979)
- [3] E. Bouchaud E and J. Vannimenus, J. Physique 50, (1989) 2931.
- [4] S.kumar and Y. Singh, Phy. Rev. E 48 (1993),734; Y. Singh, S.Kumar and D. Giri, Pramana, 53 (1999) 37.
- [5] Y. Singh, S. Kumar and D. Giri, J. Phys. A: Math Gen. 32,(1999) L407.
- [6] Y. Singh, D. Giri and S. Kumar J. Phys. A: Math Gen. 34,(1999) L67.
- [7] P. Grassberger and R. Hegger, Phys. Rev. E 51, (1995)2674; P. Grassberger and R. Hegger, J. Phys. I France 5, (1995) 597.
- [8] D.S. Gaunt and A.J. Guttmann,Phase transition and critical phenomena Vol 3,ed C. Domb and M. S. Green (London Acedemic, 1974)
- [9] D. P. Foster, E. Orlandini and M. C. Tesi, J. Phys. A:Math. Gen. 25, (1992) L1211; D. P. Foster and J. Yeomans, Physica A 177 (1991)443; F. Igloi, Phys. Rev. A 43, (1991) 3194.
- [10] T. Vrbová and S. G. Whittington, J. Phys. A: Math Gen. 31, (1998) 3989.
yashankit@yahoo.com
giri@cts.iitkgp.ernet.in
ysingh@banaras.ernet.in